Int. J. Electrochem. Sci., 7 (2012) 7451 - 7462
International Journal of
ELECTROCHEMICAL
SCIENCE
www.electrochemsci.org
Influence of Lithium Salt Concentration on PAN-PMMA Blend
Polymer Electrolytes
X.Helan Flora1,2, M.Ulaganathan3, S.Rajendran1,* 1
School of Physics, Alagappa University, Karaikudi-630 003, Tamil Nadu, India 2
Dept.of Physics, Kamaraj College, Tuticorin, Tamil Nadu, India 3
Energy Research Institute @ NTU (ERI @ N), Nanyang Technological University, Singapore-637 553
*
E-mail: [email protected]
Received: 18 June 2012 / Accepted: 12 July 2012 / Published: 1 August 2012
Polymer blend electrolytes are prepared for various concentration of LiClO4 salt with the constant ratio of PAN and PMMA polymers using solution casting technique. The structural and complex formations of the basic constituents and their complexes are analyzed by XRD and FTIR spectroscopic techniques. The effect of salt concentration on the ionic conductivity and the temperature dependence of ionic conductivity in the range 302-373K have been studied using ac impedance spectroscopy analysis. The maximum ionic conductivity value is found to be of the order of 0.562 x 10⁻⁵ Scm-1 for the film containing PAN (75 wt.%) PMMA (25wt.%) with LiClO4 (wt.8%). The thermal behaviours of the films are ascertained from thermo gravimetric analysis and differential scanning calorimetry. The sample exhibits higher ionic conductivity has also been subjected to scanning electron microscopy inorder to study the micro structure of the electrolyte system.
Keywords: X-ray diffraction analysis, ac impedance spectroscopy, polymer blend electrolyte, differential scanning calorimetry, ionic conductivity.
1. INTRODUCTION
assist transport of ions at the operating temperature ensuing conductivity. Hence, the polymer electrolyte should possess low degree of crystallinity as the conduction in polymer electrolytes is through the amorphous domain of the polymer salt system. Various approaches viz. co-polymerization[5], grafting[6], physical cross linking[7], blending[8], plasticization[9] and addition of inert ceramic oxides into the matrix[10] were carried out in insinuation of preparation of polymer electrolytes with high conductivity and appreciable thermal stability at ambient temperature. Among these techniques, blending of polymers is the most feasible approach for the preparation of polymer electrolytes which has been adopted in this research work.
The blending of polymers may lead to the increase in stability due to one polymer portraying itself as a mechanical stiffener and the other as a gelled matrix supported by the other. The lithium salt is added so as to increase the amorphicity and the introduction of conducting moieties into the matrix. The scope of PAN as a host polymer was first reported by Reich and Micheali[11]. The applications of PAN based electrolytes further extended by many of the researchers[12-19]. Slane and Salomon[20] studied composite polymer electrolyte that consisted of zeolite powders dispersed in PAN based gel electrolytes with LiAsF6 as complexing salt. PMMA having high tensile strength can act as a mechanical stiffener in the electrolyte. Optimization of PAN/PMMA blend ratio has been explained elsewhere. On the basis of ionic conductivity and the thermal stability, we have optimized the PAN/PMMA ratio in the electrolyte for constant LiClO4 salt ratio[21]. Further improve the ionic conductivity of the PAN/PMMA blend matrix, the effect of salt concentrations are optimized because the conductive species in the matrix is mainly depends on the salt concentration. In the present work, solid polymer electrolyte film consisting of PAN, PMMA and LiClO4 are examined for various concentration of lithium salt by keeping PAN/PMMA blend ratio as a constant with a view to optimize the dominant salt concentration which could give the maximum conductivity at ambient temperature. The prepared polymer electrolyte films are characterized by XRD, FTIR, ac impedance; TG and DSC for the structural, complexation, conductivity and thermal stability, respectively.
2. EXPERIMENTAL
All the films were prepared by solution casting technique[22-24]. The electrolytes were prepared from poly (acrylonitrile) (PAN) (Aldrich, average molecular weight 94,000) and poly (methyl methacrylate) (PMMA) (Aldrich, average molecular weight 120,000) which were dried at 100°C under vacuum for 10 h; LiClO4 was annealed at 70°C under vacuum for 24 h. Appropriate quantities of each component were dissolved in distilled DMF (E-Merck Germany) and then stirred continuously for 48h at room temperature and at 60°C for 4 h until homogeneous slurry was obtained. The obtained mixture was cast onto teflon bushes and glass plates. DMF was allowed to evaporate slowly at room temperature and then at 50°C for the removal of the residual DMF content if any. The obtained film was visually examined for its dryness and free standing nature.
(model 3330) with signal amplitude of 10 mV in the frequency range of 40 Hz – 100 kHz at various temperatures ranging from 303 to 373K, using stainless steel as the blocking electrode. The thermal analysis was performed by PERKIN ELMER (Pyris Diamond thermo gravimetric analyzer) at a heating rate of 10°C min-1
from room temperature to 350°C. DSC analysis was carried out using Metller Toledo DSC analyzer in the temperature range 0-400°C at a heating rate of 10°C min-1 in the atmosphere of nitrogen gas.
3. RESULTS AND DISCUSSION 3.1.XRD analysis
X-ray diffraction studies are performed for the structural elucidation of the polymer electrolytes. Ionic conductivity in polymer electrolyte is determined chiefly by the amorphous nature of the polymer where the rocking chair model of the ionic motion is assisted. Hence, it is necessary to determine the crystalline and amorphous phases of the polymer electrolyte. The XRD patterns of pristine PAN, PMMA, LiClO4 and the complexes are shown in Fig. 1.
Figure 1. XRD patterns of LiClO4; PMMA; PAN; (B1) PAN (75 wt.%)/PMMA (25 wt.%) LiClO4 (2 wt.%); (B2) PAN (75 wt.%) PMMA (25 wt.%) LiClO4 (5 wt.%); (B3) PAN (75 wt.%)PMMA (25 wt.%) LiClO4 (8 wt.%); (B4) PAN (75 wt.%) PMMA (25 wt.%) LiClO4 (11 wt.%);
[image:3.596.171.427.383.665.2]
1 indicates the complete crystalline nature of LiClO4. It has been observed that the incorporation of salt disturbed the crystalline region and increased the amorphous phase of PAN and hence intensity of the peak is reduced. It can be interpreted in terms of the criterion of Hodge et al.[25] that have established a correlation between the height of the peak and the degree of crystallinity. The diffraction peak corresponding to 8% of the salt is broader and less prominent revealing the amorphous nature of the complex which is responsible for higher ionic conductivity. The sharp crystalline peaks pertaining to LiClO4 (Fig. 1) were found to be absent in the complexes, indicating the complete dissolution of lithium salts in the polymer complexes. These observations suggest that the polymer undergoes significant structural reorganization. Salt content at 11 wt.% reduces the ionic conductivity of the electrolyte film. This may be due to the formation of separate crystallisation phase of excess salt in the complex, which confirms the presence of small hump in the complex of XRD pattern shown in (Fig.1.B4)
3.2.FTIR analysis
Figure 2. FTIR spectra of LiClO4; PMMA; PAN; (B1) PAN (75 wt.%) PMMA (25 wt.%)LiClO4 (2 wt.%) (B2) PAN (75 wt.%) PMMA (25 wt.%) LiClO4 (5 wt.%) (B3) PAN (75 wt.%) PMMA (25 wt.%) LiClO4 (8 wt.%)(B4) PAN (75 wt.%) PMMA (25 wt.%) LiClO4 (11 wt.%)
[image:4.596.168.431.328.626.2]
among polymer matrices[26-31] and the interaction between the various constituents. The FTIR spectra of PAN, PMMA, LiClO4 and the complexes are shown in Fig. 2.
The C≡N stretching band in the IR spectrum is by far the most characteristic feature of nitrile group which appears at 2245 cm-1 in pure PAN. The band corresponding to nitrile group is displaced towards higher frequency region in all the complexes due to the inductive effect created by the interaction of N atoms in –C≡N with Li+ ions[32]. The vibrational peak at 1250 cm-1 which is assigned to the C-N stretching of pure PAN is shifted to higher frequency in all the complexes irrespective of salt concentration. The vibrational peak at 2942 cm-1 is assigned to asymmetric stretching of PAN. The band at 1733 cm-1 assigned to C═O stretching of PMMA is shifted to lower frequency side around 1726 cm-1 in all the complexes. The vibrational peak at 1388 cm-1 corresponding to CH3 symmetric bending vibration is shifted to lower frequency side and then increases with increase of salt concentration and the shift is maximum for the film having higher percentage of salt (11 wt.%). The characteristic CH2 wagging is found shifted to 980 cm-1 and the CH2 rocking is shifted around 758 cm -1
.
The vibrational bands at 2812 ,2297 and 1074 cm-1 are assigned to symmetric CH2 stretching, in plane symmetric stretching and symmetric C-C stretching of PAN and the bands at 2952 ,1437 ,1195 cm-1 correspond to CH3 stretching, OCH3 stretching and CH2 twisting of PMMA. Apart from the shift in frequencies, some new peaks appear and few peaks are found absent in the complexes. The vibrational peaks at 2854, 1097, 950,712 and 515 cm-1of LiClO4 are absent and the new peaks at 2353, 1790, 1666, 845, 670 cm-1 are present in all the complexes, indicating the complex formation.
3.3.Conductivity studies
[image:5.596.107.491.466.721.2]
The electrochemical impedance spectroscopy is an excellent tool to characterize many of the electrical properties of the material and their interfaces with the electrode materials. In the present study the ionic conductivities of PAN-PMMA solid polymer electrolyte film with different concentration of LiClO4 have been analyzed.
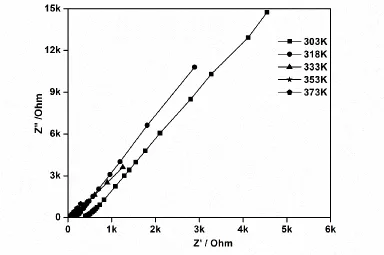
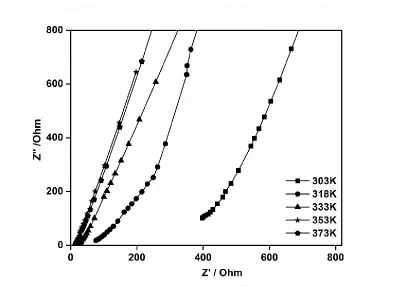
[image:6.596.100.499.143.430.2]Figure 3b. Enlarged view of temperature dependent complex impedance plot of the sample having maximum ionic conductivity
Table 1. Ionic conductivity values of prepared complexes at different temperatures
The conductivity values of the polymer complexes were calculated from the bulk resistance (Rb) obtained from the intercept of the Cole-Cole plot, known area of the film (A) and measured thickness of the film (l), using the formula σ = l / RbA. The complex impedance plot with high ionic conductivity (PAN (75 wt.%)-PMMA (25 wt.%)-LiClO4 (8 wt.%)) at room temperature is given in Fig 3. Enlarged view of the complex impedance plot is also shown in Fig. 3b. The disappearance of high frequency semicircular portion in the complex impedance plot indicates that the conductivity is mainly due to the ion conduction[33].
Sample code
Compositions of PAN (X wt.%)-PMMA(X wt.%)-LiClO4(X wt.%)
Ionic conductivity x10-5 S cm-1
303K 318K 333K 353K 373K
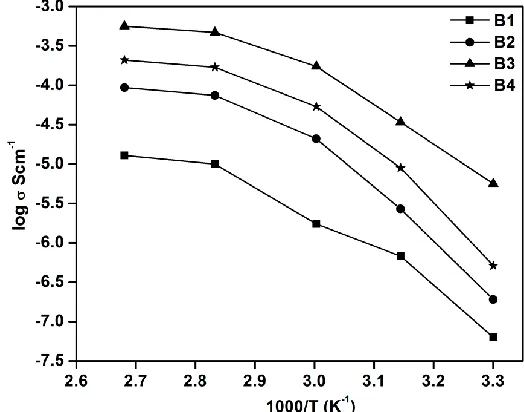
The ionic conductivity as a function of different wt% of LiClO4 over the temperature range 303-373K is given in Table 1. As the temperature increases, the conductivity increases for all the complexes irrespective of salt concentration, and this behavior is in agreement with Armand et al.[34]. The rising temperature increases the vibrational energy of the polymer segment, enabling it to push against the hydrostatic pressure imposed by its neighboring atoms and creating a small amount of space surrounding its own volume through which the ionic motion can occur2. Furthermore due to the increase in volume, it reduces the retarding effect of ion clouds which could be the reason for higher conductivity at elevated temperatures.
The Arrhenius plot of the ionic conductivity of PAN/PMMA blend with different salt concentrations is given in Fig.4. The temperature dependence of the ionic conductivity is not linear which indicates that the ionic conduction fits well with the WLF (William Landel Ferrey) mechanism.
Figure 4. Conductivity of PAN (75 wt.%) PMMA (25 wt.%) blend as a function of LiClO4 concentration at different temperatures
0 0.0001 0.0002 0.0003 0.0004 0.0005 0.0006
1 3 5 7 9 11 13
Salt Concentration (wt%)
C
on
du
c
ti
v
it
y
(
S
/c
m
)
303
318
333
353
[image:7.596.155.417.283.489.2]373
[image:7.596.125.472.560.728.2]
Salt concentration dependent ionic conductivity plot of the prepared electrolyte samples is shown in Fig. 5. It is found that ionic conductivity increases with increase of salt concentration until an optimum concentration is reached and found to retard with further addition. This could be due to increase of charge carrier up to the optimum concentration (8 wt.% of LiClO4) which gives the highest ionic conductivity among the various polymer films characterized. As the concentration is increased above the optimum concentration, the conductivity is found to decrease that could be ascertained due to formation of ion pairs or ion clusters which restricts the mobility of the charge carriers in the matrix[35].
3.4. Thermo gravimetric analysis
A B
C D
[image:8.596.52.542.261.680.2]
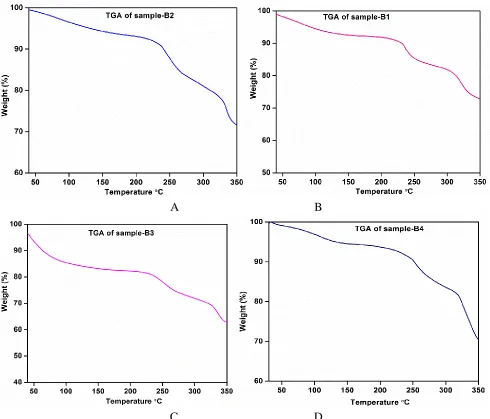
TG (thermo gravimetric) technique has been widely used to study the physical changes encountered by the polymer electrolyte during thermal excitation which gives a rough idea of the kind of changes the polymer electrolyte may undergo in the working atmosphere. The process involves change in weight attributed to moisture uptake and thermal stability of the polymer electrolyte. Typical thermogram obtained for the films containing constant PAN/PMMA ratio (75:25) with different concentration of LiClO4 are shown in Fig. 6(a-d). TG curve shows that there is a gradual weight loss of 5% until the sample reaches 120°C irrespective of the salt concentration which could be due to the evaporation of moisture absorbed while loading the sample. The films having 2, 5, 8 wt.% of LiClO4 are found to be stable up to 230, 224 and 219°C with gradual weight loss of about 10, 13, 18% respectively. The sample with 11 wt.% of salt is found to have a weight loss of 9% with thermal stability up to 240°C. Beyond the second transition temperature, the polymer electrolytes suffer a rapid weight loss associated to the degradation and could be ascertained from DSC results. Even though the polymer electrolyte with 8 wt.% of salt is found to have a thermal stability lower than the other films, this film is considered to be the best film on the basis of conductivity.
3.5. DSC analysis
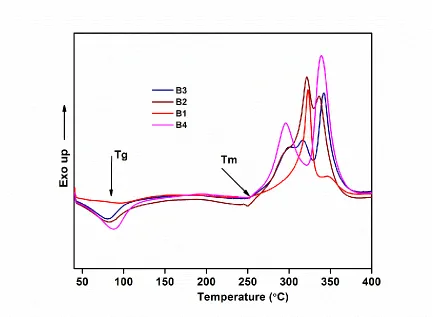
Fig.7 shows DSC thermogram of the synthesized polymer electrolyte samples. The actual Tg value of pure PAN and PMMA is 85 and 105˚C, respectively.
[image:9.596.84.517.403.720.2]
The complexes show a single Tg indicating the compatibility of the polymers. The incorporation of LiClO4 to the polymer blend matrix decreases the Tg value, and is minimum for 8wt.% salt content. On further increase of salt concentration, Tg value is increased. This observation suggests the increase of crystallinity of the complexes because of the presence of excess salt. It is also evident from conductivity studies that the conductivity of the complexes increases with increase of salt concentration and decreases for higher concentration of salt due to formation of ion cluster. It is observed that all the samples start to melt around 250°C. This is in good agreement with TGA results.
3.6. SEM analysis
A
B
[image:10.596.162.435.239.718.2]
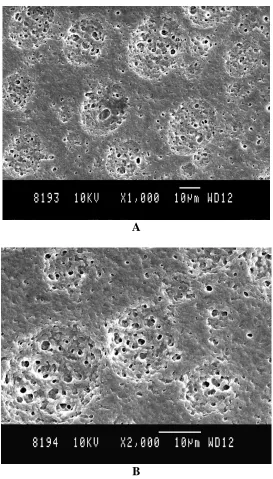
Fig.8a and b reveals the surface morphology of the polymer complex PAN/PMMA/LiClO4 having maximum ionic conductivity at two different magnifications X1000 and X2000. The polymer complex has maximum number of highly interconnected pores and the pore size is in the order of few µms. The difference in the pore size is related with the difference in the driving force for phase separation. The presence of pores is mainly due to the solvent removal [30, 31] and increased amorphousity. A fully amorphous morphology has increased ionic conductivity, since the ionic conductivity of the electrolyte depends on the segmental motion of the blended polymers and solvated carrier ions. The segmental motion either permits the ions from one site to another or provides the pathway for ions to move. Hence, the conductivity gets increased.
4. CONCLUSIONS
Polymer electrolyte systems consisting of PAN (75 wt. %) – PMMA (25 wt. %) – LiClO4 for various salt concentrations have been prepared using solvent casting technique. The complex formation of the electrolytes has been confirmed from FTIR and XRD studies. Melting temperature and thermal stability of the electrolytes have also been ascertained with the help of differential scanning calorimetry and TGA respectively. The maximum ionic conductivity of the polymer electrolyte PAN (75 wt. %) – PMMA (25 wt. %) – LiClO4 (8 wt. %) is found to be 0.56 x 10⁻⁵ Scm-1 at 303 K. The surface morphology of the polymer electrolytes has been studied and the presences of the pores are identified using scanning electron microscope. Hence the properties of PAN (75 wt. %) – PMMA (25 wt. %) – LiClO4 (8 wt. %) polymer electrolyte looks very desirable and promising for lithium battery applications.
References
1. M.Armand, J.M.Chabagno, M.J.Duclot, P.Vashishita, J.N.Mundy and G.K.Shenoy, Fast Ion Transport in solids; Eds.; Elsevier: New York, 1991; p131.
2. J.R.MacCallum and C.A. Vincent, Polymer electrolyte reviews-1; Elsvier: London, 1987; 3. J.R. MacCallum and C.A. Vincent, Polymer electrolyte reviews-2;Elsvier: London, 1989; 4. B. Scrosati, Applications of electro active polymers; Chapman & Hall: London, 1993; 5. J.Prud`home and C. Robitaille, Macromolecules, 16 (1983) 665.
6. D.J. Bannister, G.R. Davis, I.M. Ward and J.E. Melntyre, Polymer, 25 (1984) 1600. 7. W. Wieczorek, Z. Florjanczyk and J.R. Stevens, Electrochim. Acta., 40 (1995) 2251.
8. R.C.V.Subba, Z. Quan-Yao, M. Li- Qiang and W. Chen, J.Solid State Electrochem., 11 (2007) 543. 9. G.K. Prajapati, R. Roshan and P.N. Gupta, J.Phys. Chem. Solids, 71 (2010) 1717.
10.D. Shanmukaraj, G.X. Wang, R. Murugan and H.K. Liu, J.Phys. Chem. Solids, 69 (2008) 243. 11.S. Reich and I. Michacli, J.Polym. Sci. Phys., 13 (1995) 9.
12.M. Watanabe, M. Kanba, H. Matsuda, K. Tsunemi, K. Mizoguchi, E. Tsuchida and I. Shinohara, Makromol. Chem. Rapid Commun., 2 (1981) 741.
13.M. Watanabe, M. Kanba, K. Nagaoka, and I. Shinohara, J.Appl.Polym. Sci., 27 (1982) 4191.
14.M. Watanabe, M.; Kanba, K. Nagaoka, and I. Shinohara, J.Polym. Sci.Polym.Phys., 21 (1983) 939. 15.E. Tsuchida, H. Ohno, K. Tsunemi and N. Kobayashi, Solid State Ionics, 11(1983) 227.
17.K.M. Abraham and M. Alamgir, J.Electrochem.Soc., 137 (1990) 1657.
18.D. Peramunage, D.M. Pasquariello and K.M. Abraham, J.Electrochem.Soc., 142 (1995) 1789. 19.C.R. Yang, J.T. Perng, Y.Y. Wang and C.C. Wan, J.Power sources, 62 (1996) 89.
20.S. Slane and M.J. Salomon, J.Power Sources, 55 (1995) 7.
21.X. Helan Flora, M. Ulaganathan, R.S. Babu and S. Rajendran, Ionics, 2012, DOI 10.1007/s11581-012-0690-3.
22.M. Ulaganathan and S. Rajendran, J.Appl.Polym.Sci., 118 (2010) 646.
23.A. Manuel Stephen, N.G. Renganathan, T. Prem Kumar, R. Thirunakaran, S. Pitchumani and J. Shrisudershan, Solid State Ionics, 130 (2000) 123.
24.A. Manuel Stephen, T. Prem Kumar, N.G. Renganathan, S. Pitchumani, R. Thirunakaran, and N. Muniyandi, J.Power sources, 89 (2000) 80.
25.R.M. Hodge, G.H. Edward and G.P. Simon, Polymer, 37 (1996) 1371. 26.S.R. Starkey and R. Frech, (1997) Electrochim. Acta, 42 (1997) 471.
27.D.R. Macfarlane, P. Meakin, A. Bishop, D. Mc-Naughton, J.M. Rosalie and M. Forsyth, Electrochim. Acta, 40 (1995) 2333.
28.S. Chintapalli and R. Frech, Solid State Ionics, 86 (1996) 341.
29.Z. Wang, B. Huang, H. Huang, L. Chen, R. Xue and F. Wang, Electrochim.Acta, 41 (1996) 1443. 30.M. Forsyth, P. Meakin and D.R. Macfarlane, J.Mater. Chem., 7 (1997) 193.
31.A.S. Quist, J.B. Bates and G.E. Boyed, J.Chem.Phys., 54 (1971) 4896. 32.O. Zurina, B.M.I. Khairul, A. Azhar and O. Lisani, Ionics, 16 (2010) 431.
33.M.M.E. Jacob, S.R.S. Prabaharan and S. Radhakrishna, Solid State Ionics, 104 (1997) 267.
34.M.B. Armand, J.M. Chabagno, M.J. Duclot, P. Vashita, L.N. Munday and G. Shoney, Fast-ion transport in solids. eds.; North-Holland, Amsterdam, 1979, p131.
35.M. Ulaganathan, S. SundarPethaiah and Rajendran, Mater.Chem.Phys., 129 (2011) 417.