Int. J. Electrochem. Sci., 7 (2012) 8236 - 8254
International Journal of
ELECTROCHEMICAL
SCIENCE
www.electrochemsci.orgKinetics of Homogeneous Reactions in Ionic Liquids
Inas M. AlNashef1*, Maan Hayyan2
1
Chemical Engineering Department, King Saud University, Riyadh, Saudi Arabia
2
Department of Chemical Engineering, Faculty of Engineering, University of Malaya, Kuala Lumpur, Malaysia
*
E-mail: alnashef@ksu.edu.sa
Received: 21 June 2012 / Accepted: 23 July 2012 / Published: 1 September 2012
In this work, the double potential step chronoamperometry (DPSC) was used to determine the rate constants for the homogeneous reactions of alcohols with superoxide ion (O2-) at different
temperatures in ionic liquids (ILs). The technique was first tested by determining the pseudo first order rate constant for reduction of azobenzene to hydroazobenzene that, in turn, undergoes the benzidine rearrangement. The results were in good agreement with values reported in the literature using DPSC and conventional kinetic methods. The pseudo first order rate constant for the homogeneous reaction of O2- with different primary and secondary alcohols in 1-butyl-3-methylimidazolium
hexafluorophosphate [bmim][HFP] and 1,2-dimethyl-3-n-butylimidazolium hexafluorophosphate [bdmim][HFP] at different temperatures was then determined. The Arrhenius plot was used to determine the activation energy and pre-exponential factor for the corresponding reactions.
Keywords: superoxide ion; ionic liquid; imidazolium cation; double potential step
chronoamperometry.
1. INTRODUCTION
There is a paucity of reliable, quantitative information on reaction rates and rate constants in ILs despite the recent widespread interest in developing their use as alternative solvents for a wide range of applications including synthesis [1-2], biphasic catalysis [3-5], electrochemistry [6] and separations [7]. McLean et al. (2002) have determined the temperature dependence of the bimolecular rate constants for a diffusion controlled reaction involving neutral reactants in five commonly used imidazolium cation based ILs [8].
molecular weights that are observed in polymerization of methyl methacrylate when ILs are used in place of conventional organic solvents. Harrison et al. (2002) measured the rate constants of propagation and termination of methyl methacrylate in [bmim][HFP] using the pulsed laser polymerization technique across a range of temperatures, and calculated Arrhenius parameters for the rate of propagation at different IL concentration [13]. Chiappe et al. (2002) studied the kinetic behavior and the product distributions of several arylalkynes with Br2 in [bmim][HFP] and [bmim]Br at
different temperatures. They compared the kinetic constants and the activation parameters for the reaction in [bmim]Br with those relating to the reaction of the same alkynes with tetrabutylammonium tribromide in 1,2-dichloroethane. On the basis of kinetic data, they found that a significant role for solvent viscosity in determining the reaction rate may be envisaged [14].
Mohammad et al. (2001) measured the rate constants for the reaction of O2- with various
substrates through stationary electrode polarography. In solvent acetonitrile (MeCN), the substrate and the rate constants of the reaction are AH = iso-propanol (k2 0.01 M-1 s-1); ethanol (k2 = 1.42 x 10² M -1
s-1); methanol (k2 = 1.1 x 10⁷ M-1 s-1); H2O (k2 = 1.0 x 10⁵ M-1 s-1). They also showed that O2- is
stable in pyridine as well as acetone and other aprotic solvents. The reaction rate was found to be first order with respect to both O2- and the alcohol [15].
2
2
OAHK Products
1
2 2
O eO
2
2
OR1OHR2Products 3
Andrieux et al. (1987) studied the electrochemical reduction of dimethyl sulfoxide (DMSO) as a function of the addition of acids by means of DPSC. Analysis of the kinetics as a function of dioxygen and acid concentrations and of the measurement time in a series of acids involving five phenols and nitromethane allowed them to determine the reaction mechanism and of the characteristic rate constants. The HO2· radical resulting from the neutralization of the initial O2- undergoes an
electron-transfer reduction by O2- itself rather than abstracting a hydrogen atom from the solvent or
exchanging an H atom with another HO2· radical, a commonly accepted mechanism. They found that
this mechanism appears to be the same in dimethyl formamide (DMF); pointing to the conclusion that disproportionation of superoxide ions follows the same reaction pathway in aprotic organic solvents and in water. They determined the rate constant for the reaction of O2- with halogenated aromatic
alcohols and phenol [16].
cations 1-butyl-3-methylimidazolium [bmim]+, 1-methyl-3-octylimidazolium [moim]+ and 1-butyl-2,3-dimethylimidazolium [bmmim]+, combined with the anions [PF6]– and [Tf2N]– (Tf = CF3SO2), chosen
to give a moderate degree of structural variation.
Conventional spectrophotometric techniques cannot be used when investigating reactions that occur at a sub-second rate, as in the case of the reaction between O2- and alcohols. This is overcome
by using a stopped-flow-apparatus. A stopped flow apparatus, which provides instantaneous mixing and recording of data on a tens-of-millisecond time scale, can be used. The stopped flow apparatus can be connected to a UV-vis spectrophotometer through a remote-send-cable that is attached to an accessory controller port on the instrument. Potassium superoxide (KO2) can be dissolved in ILs at
moderate temperatures ( 40C). The chemically generated O2- in IL can be used to measure the rate
constant of the homogeneous reaction using the stopped flow method.
Many electrochemical methods can also be used to measure the rate constant for fast homogeneous reactions, e.g. rotating ring disc electrode (RRDE) and DPSC. DPSC is a simple technique that does not require large volumes of the solution. The values of the diffusion coefficient and bulk concentration of the electrochemically active material are not needed, in contrast to RRDE. Briefly, DPSC involves producing O2- at a stationary electrode under diffusion-controlled conditions
by applying a constant potential for a timed interval,. During this interval, O2- diffuses into the
solution and simultaneously reacts. At t = , the potential is switched to a value where O2- is oxidized
back to O2. The anodic current is an indication of the amount of O2- that has not reacted and can be
related to the rate constant k. Schwarz and Shain (1965) developed this method and they gave an analytical solution for the boundary value problem for the combined diffusion-electron transfer-kinetic system for the case of planar electrode [21].
2.EXPERIMENTAL DETAILS
Before conducting DPSC experiments in the ILs [bmim][HFP] and [bdmim][HFP], cyclic voltammetry tests were performed to generate O2- and to confirm its short-term stability.
[bmim][HFP] and [bdmim][HFP] (SACHEM), both with a stated purity of 97%, were dried overnight in a vacuum oven at 50 °C. The electrochemistry was performed using an EG&G 263A potentiostat/galvanostat controlled by computer and data acquisition software. The electrode configuration was a glassy carbon, or Pt working (BASi, 3 mm dia.) and a platinum mesh counter (Aldrich). Ag/AgCl (Fisher Scientific) was used as a reference electrode. All [bmim][HFP] and [bdmim][HFP] experiments were performed in a dry glove box under an argon atmosphere. The systems were sparged prior to electrochemical experiments with UHP nitrogen or oxygen fitted through a Drierite gas purification column (W.A. Hammond).
Prior to O2- generation, an argon sparge was used to obtain a background voltammogram.
After confirming the short-term stability of O2- a weighed amount of alcohol is added to the IL
and the solution is stirred with a magnetic stirrer and sparged with argon. DPSC experiments at different values of switching time, , are then conducted and back ground currents are recorded. Oxygen is bubbled through the IL. After 15-20 min the sparging of oxygen is stopped and DPSC experiments are conducted in the O2 saturated ILs. The background currents should be deducted from
the corresponding values obtained after sparging with O2.
The potential applied to the working electrode was a single square pulse with amplitude of –0.8 V. The initial potential value was set at –0.2 V vs. Ag/AgCl reference electrode. Under these conditions, the cathodic potential step was carried out at –1.0 V vs. Ag/AgCl; the subsequent anodic step, at –0.2 V. CVs in the ILs showed that the applied potential always fell in the diffusion controlled limiting current region. In addition, by running argon blanks it was verified that the initial potential used was sufficiently cathodic.
3.RESULTS AND DISCUSSION
DPSC involves producing O2- at a stationary electrode under diffusion-controlled conditions
by applying a constant potential for a timed interval, . During this interval, O2- diffuses into the
solution and simultaneously reacts, Eq 1.
Figure 5.1 Experimental cathodic-anodic current-time curves for 20 mM benzhydrol
in [bmim][HFP] at 27 C, = 1 s.
-120 -70 -20 30 80
0 1 2
Time (s)
C
u
rr
en
t (
u
A
)
Anodic current Cathodic
current
At t = , the potential is switched to a value where O2- is oxidized back to O2 as shown by Eq
2. The rate expression for the homogeneous reaction can be written as shown in Eq 4.
-• -•
2 2
2 AH O 1 O
r k C C k C
4 Where CAH is the concentration of the substrate that is in excess, -•
2
O
C is the concentration of the superoxide ion, k2 is the second order rate constant, and k1 is the pseudo first order rate constant.
The anodic current is an indication of the amount of O2- that has not reacted and can be related
to the rate constant k1. Eqs 2 and 3 show the electrochemical reactions and the homogeneous reaction
of O2- with alcohol. Typical cathodic-anodic current-time curves are shown in Figure 1.
The theoretical relationship between the current, the time of electrolysis, and the rate constant, k1, for a system following Eqs 5 and 6 can be derived by solving Fick’s laws of diffusion to a plane
(modified by the appropriate kinetic terms) [21].
2 2 o o o C C D t x 5 2 1 2 -R R R R C C
D k C
t x 6
Where CO and CR are concentrations of O2 and O2-, t is the time, x is the distance from the
electrode, and DO and DR are the diffusion coefficients of O2 and O2-.
The electrolysis conditions resulting from the application of a single large amplitude square voltage pulse to the working electrode are expressed in the initial and boundary conditions
0 0
0, 0 : , R 0
t x C C C
7
0 0
0, : , R 0
t x C C C
8
0
0 0
0, 0 : 0, = R
R
C C
t x C D D
x x
9
, 0 : 0, =
o R
R o R
C C
t x C D D
x x 10 0 0
- o = - R
o R
x x
C C
i nFAD nFAD
x x
Here CO* is the bulk concentratism of O2, is the switching time, n is the number of electrons
involved in the charge transfer, F is the Faraday constant, and A is the area of the electrode. Schwarz and Shain (1965) gave an analytical solution to this problem and the results are shown in Eqs 12 and 13 [21].
for t
*
/
c
o o
i
C D t
nFA
12 for t
-kt
* -kt *
0 1 1 1 1
1
e
/ ( ) e 1/ 2,1, 1/ 2, 1, - /
!
n a
o o o
n
t k
i
C D t F k F n n k C D t
nFA n
13 Where 1F1
1/ 2,1,kt
is a confluent hypergeometric series [23] with the following properties
1 1 , , ( / )1 1 1, 1,
d
F x F x
dx 14
1 1
and F , , 0 1 15
where
2 ...1 1
x a(a+1) x
, , 1 + +
1! c(c+1) 2! a
F a c x
c
16
Dividing Eq 13 by Eq 12 gives
-kt
-kt
1 1 1 1
1
for
e
/( ) e 1/ 2,1, 1/ 2, 1, - 1
! n a n c t t k i
t t F k F n n k
i n
17It was found that if three terms of the infinite series in Eq 17 are used, approximately 0.4% accuracy in the anodic current is obtained. So in this study we used three terms of the infinite series. Eq 17 becomes:
1
2 2
- 1 1 1
1
for
3( ) 3 ( )
/( ) e 1 ( )
2 8 4 1
k t a
c
t
i k k k t
t t k t
i
3 2 3 2 4 2 2
2 2
1 1 1
1
15 ( ) 5 ( ) 35 ( )
( )
8 1 24 1 16 1
k t k t k t
k t
18
3.1 Azobenzene system
In order to test the theoretical calculations and the apparatus used, the reduction of azobenzene, Scheme 1, was investigated. The rearrangement of hydrazobenzene has been the subject of numerous investigations [21,24] in which spectrophotometric [25], potentiometric [26], or titration [27] techniques were used to follow the rate of the reaction. Schwarz and Shain (1965) used DPSC to determine the pseudo first order rate constant for the rearrangement of benzidine in 50% wt. ethanol-water at different perchloric acid concentrations [21].
Scheme 1. Electrochemical and homogeneous reactions for the azobenzene system.
electrodes, glassy carbon or platinum in this case. Schwarz and Shain (1965) showed that the background currents can be neglected only when u mercury electrodes are employed, but mercury electrodes cannot be used due to hazards problems associated with the use of mercury [21]. Special attention should be given to polishing the working electrodes after each set of runs or whenever needed. Running CVs before DPSC experiments proved to be beneficial. The results, Table 1, are in good agreement with those reported by Shwarz and Shain (1965) [21].
Table 1. Kinetic data for the perchloric acid catalyzed rearrangement of hydrazobenzene in 50 wt% ethanol-water system.
Perchloric acid conc. (mol/L)
Azobenzene conc. (mol/L)
k1 (s-1)
This work
k1 (s-1)
Ref. [21]
0.641 0.6 0.61 0.57
0.641 1.0 0.59 0.56
3.2 Primary and secondary alcohols in ILs
A kinetic investigation was undertaken to obtain information on the kinetics of primary and secondary alcohols reaction with O2- in ILs, and to compare these solvents with conventional organic
solvents. The rates of the reaction of primary and secondary alcohols with O2- in [bmim][HFP] and
[bdmim][HFP] were measured with DPSC, under pseudo-first order conditions (in the presence of large excess of alcohol) at different temperatures and for different alcohol concentrations.
The potential applied to the working electrode was a single square pulse with amplitude of –0.8 V. The initial potential value was set at –0.2 V vs. Ag/AgCl reference electrode. Under these conditions, the cathodic potential step was carried out at –1.0 V vs. Ag/AgCl; the subsequent anodic step, at –0.2 V. CVs in the ILs showed that the applied potential always fell in the diffusion controlled limiting current region. In addition, argon blanks verified that the initial potential used was sufficiently cathodic.
Prior to kinetic measurements, a quantitative study was made of cathodic-anodic current time curves obtained after sparging with argon and oxygen in the absence of alcohol. These control experiments were used to evaluate the general procedures for the step functional method. Then under identical experimental conditions, a second cathodic-anodic current-time curves were obtained after sparging with O2 and Ar in the presence of alcohol. Since the cathodic portion of these curves should
be unaffected by the subsequent chemical reaction, they could be used for further evaluation of the techniques and for investigation of possible side reactions [21]. Then the anodic current-time curves were used along with respective cathodic portions for the determination of the rate constants.
Straight lines were obtained for all experiments and the individual slopes showed a deviation less than 10% from the average. These results indicated that the generation of the superoxide ion was a simple diffusion-controlled process over the entire time scale of the experiments. Using Eq 10 gives:
*
0 0
slopenFAC D /
19
* 2
0 0
and D = slope /(nFAC )
20
The diffusion coefficient for O2 calculated from the average slope was 2.4×10⁻⁶ cm2/s, a value
consistent with that calculated using cyclic voltammetry, 2.2×10⁻⁶
cm2/s.
R2=0.999
0.7 0.8 0.9 1.0
ic
(
A)
32 34 36 38 40 42
1 / t
=5 s
R2=0.999
0.7 0.8 0.9 1.0
ic
(
A)
32 34 36 38 40 42
1 / t
[image:9.596.156.441.273.712.2]=3 s
Figure 2. A plot of cathodic current vs. 1/t for oxygen in [bmim][HFP] without the presence of any
The analysis of the anodic-current-time curves involved measuring the ratio of –ia/ic for a series
of time ratios (t-)/. Some typical results for =1 are shown in Figure 3. The results for different values of showed that the anodic currents were essentially controlled by the diffusion of oxygen to the electrode surface. The agreement between the experimental points and theory was reasonably good. In most cases, slight deviations of ia/ic from theory could be ascribed to deviation in ia rather than ic.
The deviation is related, in part, to the adsorption of impurities in ILs on the surface of the electrode. We noticed that the experiments in IL with the same electrode that was used in azobenzene aqueous solution gave non-reproducible results even after the electrode was polished with 0.1 M alumina. It is well known that the fundamental process in electrochemical reactions is the transfer of electrons between the electrode surface and the molecules in the interfacial region (either in solution or immobilized at the electrode surface). The kinetics of this heterogeneous process can be significantly affected by the microstructure and roughness of the electrode surface, the blocking of active sites on the electrode surface by adsorbed materials, and the nature of the functional groups (e.g. oxides) present on the surface. The most common method for surface preparation is mechanical polishing. The protocol chosen for polishing depends on the application for which the electrode is being used, and the state of the electrode surface.
(t- )/
0.0 0.2 0.4 0.6 0.8 1.0 1.2
-i a /i c
0.25 0.30 0.35 0.40 0.45 0.50 0.55 0.60 0.65
[image:10.596.125.449.371.604.2]
Figure 3. A plot of -ia/ic vs. (t-)/ for oxygen in pure [bmim][HFP] for = 1.
polished with 1 m diamond polish. The electrode was then thoroughly rinsed with water, de-ionized water, and methanol, respectively. This procedure should be repeated before any new set of experiments or when the CV run before DPSC gives unexpected results. So although DPSC is a simple and efficient technique, it is very sensitive to impurities that can adsorb on the surface of the electrode. This problem can be overcome easily by running CVs before conducting DPSC experiments.
We also noticed that the deviation between experimental and theoretical values is very small. We used UV-vis spectrophotometer to find an approximate value for the pseudo first order constant for the reaction of O2- with [bmim][HFP]. The value was determined to be 2.1x 10⁻⁵ s-1. This value is
about 4 orders of magnitude less than the value of the pseudo first order constant for the reaction of aromatic alcohols with O2- in IL and in a good agreement with earlier reported values by AlNashef et
al. (2010) and Hayyan et al. (2012) [22,29]. So this side reaction can be neglected while conducting DPSC experiments. However, since the time needed for bulk electrolysis is much larger than the time needed to run DPSC and CV experiments and due to the high molar concentration of the solvent relative to the substrate, this side reaction cannot be neglected when running bulk electrolysis experiments. UV-vis analysis showed that O2- does not react with [bdmim][HFP]. In the presence of
alcohol, cathodic-anodic current-time curves were obtained at different temperatures and for different concentrations of primary and secondary alcohols in [bmim][HFP] and [bdmim][HFP]. As with the non-reactive system, values were in the range from 0.5 to 3 seconds.
In addition to their use in the analysis of the rate data, the cathodic current-time curves also serve as a method for detecting such side reactions as the reaction of O2- with H+, which is generated
in ILs with PF6 anion even if the solvent was kept inside a glove box. If such side reaction were
present, the regeneration of oxygen by the chemical step would result in an enhancement of the cathodic current due to the catalytic effect.
Schwarz and Shain (1965) showed that the maximum accuracy in the kinetic measurements is achieved when the switching time, , is the same order of magnitude as the half-life of the chemical reaction [21]. Thus the switching times used here were selected to be approximately within 50% of the half-life of the chemical reaction. This permitted significant amount of reaction to take place, but at the same time enough superoxide ion remained so that the anodic currents could be measured with reasonable accuracy.
From any individual cathodic-anodic current-time curve, several estimates of the kinetic parameter were obtained. In principle, ia and ic could be measured at any arbitrarily selected value of t
and (t-). However, we noticed that for small values of the currents take some time to reach reasonable values after switching the potential. The same phenomenon was observed while running experiments in aqueous solutions. This may be due to limitations in the potentiostat.
For each alcohol solution in IL, the values of k1 were converted to k1(t-) so that data obtained
with different values of could be combined in a form to give weight to each value. Then plots were made of k1(t-) versus (t-) and the rate constant was calculated directly from the slope. In each case,
the experimental data determined a straight line that passed through the origin, as required by theory. One of these plots is shown in Figure 4. It worth mentioning here that if the concentration of the alcohol was not high enough so that pseudo-first-order conditions dominate, the plot of k1(t-) versus
The same procedure was repeated at least at three different temperatures and the natural logarithm of the rate constant was plotted versus the reciprocal of the absolute temperature to get the kinetic parameters as shown in Eq 20.
exp( / )
2
k A Ea RT
20
where A is the pre-exponential factor, Ea is the activation energy, R is the universal gas
constant and T is the absolute temperature. Using Eq 20 the kinetic parameters for the reaction of the superoxide ion with benzhydrol in [bmim][HFP] and [bdmim][HFP] were determined. The results are summarized in Table 2 and Table 3.
R2=0.999
(t- )
0.2 0.4 0.6 0.8 1.0 1.2
k
1(
t-
)
0.2 0.4 0.6 0.8 1.0 1.2 1.4
= 0.5 s =1.0 s
Figure 4. A plot of (t-) vs. k1(t-) for the reaction of superoxide ion and 12.5 mM benzhydrol in
[image:12.596.120.476.278.542.2][bdmim][HFP] at 65C . Solid line is a linear fit to the experimental values.
Table 2. Kinetic parameters for the reaction of O2- with benzhydrol in [bdmim][HFP].
Benzhydrol concentration (mM) T (C) k1 (s-1) k2 (L mol-1 s-1)
12.5 49 0.75 60
12.5 57 0.90 72
12.5 65 1.15 92
12.5 84 1.85 148
25 49 1.40 56
25 57 1.65 66
[image:12.596.121.479.647.767.2]
Table 3. Kinetic parameters for the reaction of O2- with benzhydrol in [bmim][HFP].
Benzhydrol concentration (mM) T (C) k1 (s-1) k2 (L mol-1 s-1)
10 27 0.53 53
10 40 0.74 74
10 80 2.01 201
The values of k2 in Table 2 and Table 3 were calculated by dividing k1 by the concentration of
the alcohol in IL. The values of k1 and k2 were determined for two different concentrations of
benzhydrol in [bdmim][HFP]. It can be seen from Table 2 that doubling the concentration of benzhydrol doubles the value of the pseudo first order rate constant and does not, within the limits of the experimental error, affect the value of the second order rate constant. This indicates that the measured rate constant is an intrinsic rate constant. Muldoon et al. (2001) showed that there is a significant difference in Ea values for the hydrogen abstraction by benzophenone triplet excited states
between the ionic liquids and those in conventional solvents (ca. 25 and 15 kJ mol–1, respectively). They also indicated that the activation parameters for H abstraction in the ionic liquids are essentially independent of the anionic component and the availability of the hydrogen atom at the 2-position on the imidazolium ring [17].
McLean et al. (2002) reported the results of an investigation on the temperature dependence of diffusion-controlled rate constants and the solvent viscosity, , of five structurally related ILs based on the 1-alkyl-3-methylimidazolium cation. They stated that the confirmation that measured rate constant values do reflect the diffusion controlled rate constant should come from the comparison of the temperature dependence of the measured rate constant values with the temperature dependence of viscous flow of the solvent [8]. Identical activation energies would indicate that both processes are driven by solvent viscous flow, and therefore that measured rate constant does indeed reflect the diffusion controlled rate constant. They determined the activation energy for viscous flow for [bmim][HFP] to be 37.6 kJ/mol. Using the results of DPSC in [bmim][HFP] at a series of temperatures we determined the diffusion coefficient of O2 as a function of temperature. When the natural logarithm
of the diffusion coefficient was plotted versus 1/T a straight line was obtained, Figure 5. The activation energy for the diffusion process was determined from the slope. This value, 36.9 kJ/mol is in good agreement with that reported by McLean et al. (2002) [8]. Comparing this value to the values of activation energy determined in our work for the reaction of superoxide ion with different alcohols in [bmim][HFP] (19-23 kJ/mol) and the fact that this value is different for different alcohols, Table 4 and Table 5, indicate that the measured kinetic parameters are those for the homogeneous reaction rather than for the diffusion-controlled process. The other kinetic parameters of the process can be calculated using the fundamental equation of the theory of the active complex [30]:
exp exp
B
xek T S E
k
h R RT
where x is a transmission coefficient which is unity for monomolecular reactions, kB the
Boltzmann constant, h the corresponding Plank constant, e=2.7183 is the Neper number andSis the change of entropy for the active complex formation from the reagent.
R2=0.982
1/T (K-1)
0.0028 0.0029 0.0030 0.0031 0.0032
ln D
0
(c
m
2 /s)
[image:14.596.99.478.151.417.2]-12.2 -12.0 -11.8 -11.6 -11.4 -11.2 -11.0 -10.8 -10.6 -10.4
Figure 5. A plot of natural logarithm of the diffusion coefficient of O2 in [bmim][HFP] versus 1/T in
the presence of 2-hydroxymethyl pyridine.
Table 4. Arrhenius parameters for the reaction of O2- with benzhydrol in ILs. Solvent Ea (kJ/mol) ln(A)
[bmim][HFP] 22.3 12.9 [bdmim][HFP] 25.0 14.0
MeCN 29.1 14.5
Table 5. Arrhenius parameters for the reaction of O2- with different alcohols in [bmim][HFP]. Substrate Ea (kJ/mol) ln(A)
Benzhydrol 22.3 12.9
Benzyl alcohol 19.1 8.8
exp( )
B
xek T S
A
h R
22
and S can be calculated:
ln lnxek TB
S R A
h
23
where A is the pre-exponential factor in the Arrhenius Eq with values presented in Tables 4 and 5. Since the changes of the enthalpy Hand Gibbs free energy G for the active complex formation can be calculated using the well known thermodynamic equations:
a
E HRT
24
G H T S
25
The corresponding values of S, H and G for the reaction of superoxide ion with benzhydrol in [bdmim][HFP] calculated at T = 45C are –0.49 kJ/mole, 22.4 kJ/mole, and 177.9 kJ/mole, respectively. Unfortunately, no values are reported in the literature for the corresponding reaction.
McLean et al. (2002) stated that attention should be drawn to the correlation between pre-exponential factors and the activation energies for both the measured rate constant values and the temperature dependence of viscous flow of the solvent [8]. This correlation gives rise to isokinetic behavior in ILs and remains even when the conventional solvent data are included, Figure 6. Such correlations are relatively commonplace in organic chemistry.
McLean et al. (2002) reported that both Ea and A values show a significant, systematic
dependence on the identity of the anion and the nature of the alkyl substituents on the cation constituting the ILs, Figure 6. For any particular cation, the Ea values are 12–15 kJ mol–1 higher for the
[PF6]– salts than the [Tf2N]– salts, where Tf2 stands for CF3SO2. This is readily accounted for on the
basis of the differences in charge distribution between these two anions. The more symmetrical distribution of the negative charge on [PF6]– permits interaction with several of the surrounding cations
whereas the more directional charge on [Tf2N]– restricts the degree of interaction with the surrounding
cations.
Consequently, the greater Ea values in the [PF6]– salts may simply reflect the greater extent of
ionic cross-linking possible in ILs with this anion compared to [Tf2N]–. The relative magnitudes of the
pre-exponential factors may also reflect this, as enhanced ionic cross-linking would result in a greater effective diffusing mass. The movement of larger solvent masses requires the breaking of significant interionic bonding, whilst creating large cavities for solutes to jump into. This enhanced cross-linking may explain the apparent contradiction that the [PF6]– salts display larger A factors than the [Tf2N]–
breakdown of van der Waals forces that play a significant part in facilitating diffusion processes in these liquids despite the presence of strong electrostatic interactions between ions. The apparent strength and significance of the van der Waals interactions is supported by the very large molar mass of ILs [8]. This is consistent with the values of Ea determined for the reaction of superoxide ion with
benzhydrol in [bmim][HFP] and [bdmim][HFP] as can be seen from Table 4.
10 20 30 40 50
26 28 30 32 34 36 38
Toluene + CH3CN
[bmim][Tf2N]
[bmmim][Tf2N]
[omim][Tf2N] [bmim][PF6]
[omim][PF6]
ln
A
Ea / kJ mol-1
Figure 6. Isokinetic plot obtained for the energy transfer reaction of triplet benzophenone and naphthalene in five ionic liquids, toluene and acetonitrile reported by Mclean et al.26 where [omim] = octyl methyl imidazolium; [bmmim] = [bdmim]; PF6 = hexafluorophosphate; and
[Tf] = CF3SO2.
Ganiev et al. (2002) studied the kinetics of the oxidation of a series of alcohols with the oxoammonium salt 2,2,6,6-tetramethypiperidine-1-oxyl chlorite in MeCN. They found that the activation energy for the oxidation of benzyl alcohol is 16.5 kJ/mol; this is in good agreement with the value reported here in [bmim][HFP], 19.1 kJ/mol. The second order rate constant for the oxidation of benzyl alcohol at 10C was 0.037 L mol-1
s-1 [31]. This value is more than one order of magnitude lower than that for the same reaction utilizing the O2- in the same IL determined by our group, 1.3 L
mol-1 s-1.
[image:16.596.140.456.186.434.2]
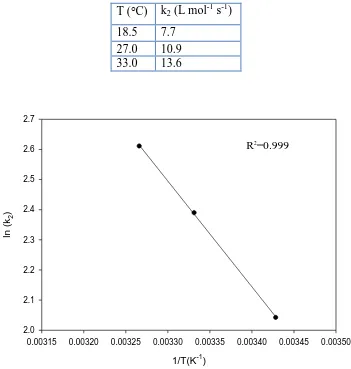
Table 6. Kinetic parameters for the reaction of O2- with benzhydrol in MeCN.
T (C) k2 (L mol-1 s-1)
18.5 7.7 27.0 10.9 33.0 13.6
1/T(K-1)
0.00315 0.00320 0.00325 0.00330 0.00335 0.00340 0.00345 0.00350
ln
(k2
)
2.0 2.1 2.2 2.3 2.4 2.5 2.6 2.7
R2
=0.999
Figure 7. A plot of natural logarithm of k2 versus 1/T for the reaction of O2- with benzhydrol in
MeCN.
4.CONCLUSIONS
It was shown that DPSC is an efficient and effective method for measuring the rate constants for the homogeneous reactions of alcohols with O2- in [bmim][HFP] and [bdmim][HFP] ILs. It was
also found that although DPSC is a simple method that does not need large quantities of the solvent. Careful attention should be given to polishing the working-electrode because this method is very sensitive to the adsorbed impurities on the surface of the working electrode. Activation energy values for different alcohols in [bmim][HFP] and [bdmim][HFP] were determined using Arrhenius plot for the kinetic data obtained at different temperatures. The values of the activation energy showed that the activation parameters determined in this work are the intrinsic kinetic parameters and not those associated with diffusion. It was found significant (ca. 5 kJ/mol) increase in Ea values associated with
despite the presence of strong electrostatic interactions between ions. The apparent strength and significance of the van der Waals interactions is supported by the very large molar mass of ILs.
ACKNOWLEDGMENTS
The authors thank the National Plan for Science, Technology, and Innovation at King Saud University for their financial assistance through project no. 10-ENV1010-02, and University of Malaya Centre for Ionic Liquids (UMCiL) for their support to this research.
References
1. J.D. Holbrey, K.R. Seddon, Clean Prod. Processes 1 (1999) 223. 2. T. Welton, Chem. Rev. 99 (1999) 2071.
3. C.M. Gordon, Appl. Cat. A, General 222 (2001) 101.
4. S.A. Stratton, K.L. Luska, A. Moores, Catal. Today 183 (2012) 96.
5. I.J. Villar-Garcia, A. Abebe, Y. Chebude, Inorg. Chem. Commun. 19 (2012) 1.
6. M. Hayyan, F.S. Mjalli, M.A. Hashim, I.M. AlNashef, X.M. Tan, J. Electroanal. Chem. 657 (2011) 150.
7. M. Hayyan, F.S. Mjalli, M.A. Hashim, I.M. AlNashef, Fuel Process. Technol. 91 (2010) 116. 8. A.J. McLean, M.J. Muldoon, C.M. Gordon, I.R. Dunkin, Chem. Commun. 17 (2002) 1880. 9. G. Schmidt-Naake, A. Schmalfuß, I. Woecht, Chem. Eng. Res. Des. 86 (2008) 765.
10.S. Perrier, T.P. Davis, A.J. Carmichael, D.M. Haddleton, Eur. Polym. J. 39 (2003) 417. 11.E. Andrzejewska, M. Podgorska-Golubska, I. Stepniak, M. Andrzejewski, Polymer 50 (2009)
2040.
12.S. Mallakpour, Z. Rafiee, Prog. Polym. Sci. 36 (2011) 1754.
13.S. Harrisson, S.R. Mackenzie, D.M. Haddleton, Chem. Commun. (2002) 2850. 14.C. Chiappe, V. Conte, D. Pieraccini, Eur. J. Org. Chem. ( 2002) 2831.
15.M. Mohammad, A.Y. Khan, M.S. Subhani, N. Bibi, S. Ahmad, S. Saleemi, Res. Chem. Intermed. 27 (2001) 259.
16.C.P. Andrieux, P. Hapiot, J.M. Saveant, J. Am. Chem. Soc. 109 (1987) 3768.
17.M.J. Muldoon, A.J. McLean, C.M. Gordon, I.R. Dunkin, Chem. Commun. 22 (2001) 2364. 18.C. Lee, T. Winston, A. Unni, R.M. Pagni, G. Mammantov, J. Am. Chem. Soc. 118 (1996) 4919. 19. . lvaro, . Ferrer, . arc a, M. Narayana, Chem. Phys. Lett. 362 (2002) 435.
20.M. Harada, C. Kawasaki, K. Saijo, M. Demizu, Y. Kimura, J. Colloid Interface Sci. 343 (2010) 537.
21.W.M. Schwarz, I. Shain, J. Phys. Chem. 69 (1965) 30.
22.M. Hayyan, F.S. Mjalli, M.A. Hashim, I.M. AlNashef, S.M. Al-Zahrani, K.L. Chooi, J. Electroanal. Chem. 664 (2012) 26.
23.A. Erdelyi, Higher Transcendental Functions, McGraw-Hill, New York, 1953. 24.H. Zollinger, Azo and Diazo Chemistry, Interscience Publishers, New York, 1961. 25.R.B. Carlin, R.G. Nelb, R.C. Odioso, J. Am. Chem. Soc. 73 (1951) 1002.
26.E. Biilmann, J.H. Blom, J. Am. Chem. Soc. 125 (1924) 1719. 27.M.J.S. Dewar, J. Chem. Soc. (1946) 777.
28.M. Hayyan, F.S. Mjalli, M.A. Hashim, I.M. AlNashef, S.M. Al-Zahrani, K.L. Chooi, J. Mol. Liq. 167 (2012) 28.
29.I.M. AlNashef, M.A. Hashim, F.S. Mjalli, M.Q.A.-h. Ali, M. Hayyan, Tetrahedron Lett. 51 (2010) 1976.
31.I.M. Ganiev, E.S. Suvorkina, A.V. Igoshina, N.N. Kabal nova, U.B. Imashev, G.A. Tolstikov, Russ. Chem. Bull., Int. Ed. 51 (2002) 982.
![Figure 2. A plot of cathodic current vs. 1/t for oxygen in [bmim][HFP] without the presence of any substrate for different values of ](https://thumb-us.123doks.com/thumbv2/123dok_us/1927607.152138/9.596.156.441.273.712/figure-cathodic-current-oxygen-presence-substrate-different-values.webp)
![Figure 3. A plot of -ia/ic vs. (t-)/ for oxygen in pure [bmim][HFP] for = 1.](https://thumb-us.123doks.com/thumbv2/123dok_us/1927607.152138/10.596.125.449.371.604/figure-plot-ia-ic-oxygen-pure-bmim-hfp.webp)
![Table 2. Kinetic parameters for the reaction of O2- with benzhydrol in [bdmim][HFP].](https://thumb-us.123doks.com/thumbv2/123dok_us/1927607.152138/12.596.120.476.278.542/table-kinetic-parameters-reaction-o-benzhydrol-bdmim-hfp.webp)
![Table 3. Kinetic parameters for the reaction of O2- with benzhydrol in [bmim][HFP].](https://thumb-us.123doks.com/thumbv2/123dok_us/1927607.152138/13.596.117.480.98.161/table-kinetic-parameters-reaction-o-benzhydrol-bmim-hfp.webp)
![Figure 5. A plot of natural logarithm of the diffusion coefficient of O2 in [bmim][HFP] versus 1/T in the presence of 2-hydroxymethyl pyridine](https://thumb-us.123doks.com/thumbv2/123dok_us/1927607.152138/14.596.99.478.151.417/figure-natural-logarithm-diffusion-coefficient-presence-hydroxymethyl-pyridine.webp)
![Figure 6. Isokinetic plot obtained for the energy transfer reaction of triplet benzophenone and naphthalene in five ionic liquids, toluene and acetonitrile reported by Mclean et al.26 where [omim] = octyl methyl imidazolium; [bmmim] = [bdmim]; PF6](https://thumb-us.123doks.com/thumbv2/123dok_us/1927607.152138/16.596.140.456.186.434/isokinetic-obtained-transfer-reaction-benzophenone-naphthalene-acetonitrile-imidazolium.webp)