Working Paper Document
The gas chain : infl uence of its specifi cities
on the liberalisation process
by Carine Swartenbroekx
Editorial Director
Jan Smets, Member of the Board of Directors of the National Bank of Belgium
Statement of purpose:
The purpose of these working papers is to promote the circulation of research results (Research Series) and analytical studies (Documents Series) made within the National Bank of Belgium or presented by external economists in seminars, conferences and conventions organised by the Bank. The aim is therefore to provide a platform for discussion. The opinions expressed are strictly those of the authors and do not necessarily reflect the views of the National Bank of Belgium.
Orders
For orders and information on subscriptions and reductions: National Bank of Belgium, Documentation - Publications service, boulevard de Berlaimont 14, 1000 Brussels
Tel +32 2 221 20 33 - Fax +32 2 21 30 42
The Working Papers are available on the website of the Bank: http://www.nbb.be
© National Bank of Belgium, Brussels
All rights reserved.
Reproduction for educational and non-commercial purposes is permitted provided that the source is acknowledged.
Abstract
Like other network industries, the European gas supply industry has been liberalised, along the lines of what has been done in the United Kingdom and the United States, by opening up to competition the upstream and downstream segments of essential transmission infrastructure.
The aim of this first working paper is to draw attention to some of the stakes in the liberalisation of the gas market whose functioning cannot disregard the network infrastructure required to bring this fuel to the consumer, a feature it shares with the electricity market. However, gas also has the specific feature of being a primary energy source that must be transported from its point of extraction. Consequently, opening the upstream supply segment of the market to competition is not so obvious in the European context, because, contrary to the examples of the North American and British gas markets, these supply channels are largely in the hands of external suppliers and thus fall outside the scope of EU legislation on the liberalisation and organisation of the internal market in gas. Competition on the downstream gas supply segment must also adapt to the constraints imposed by access to the grid infrastructure, which, in the case of gas in Europe, goes hand in hand with the constraint of dependence on external suppliers. Hence the opening to competition of upstream and downstream markets is not "synchronous", a discrepancy which can weaken the impact of liberalisation.
Moreover, the separation of activities necessary for ensuring free competition in some segments of the market is coupled with major changes in the way the gas chain operates, with the appearance of new markets, new price mechanisms and new intermediaries. Starting out from a situation where gas supply was in the hands of vertically-integrated operators, the new regulatory framework that has been set up must, on the one hand, ensure that competitive forces can be given free rein, and, on the other hand, that free and fair competition helps the gas chain to operate coherently, at lower cost and in the interests of consumers, for whom the stakes are high as natural gas is an important input for many industrial manufacturing processes, even a "commodity" almost of basic necessity.
JEL-code : D23, D43, L13, L43, L95, L97.
Keywords: network industries, gas industry, gas utility, liberalisation, regulation, deregulation, market structure, European gas supply, oligopoly, OPEG
Corresponding author:
NBB, Microeconomic Information Department, e-mail: [email protected]
Research results and conclusions expressed are those of the author and do not necessarily reflect the views of the National Bank of Belgium or any other institution to which the author is affiliated. All remaining errors are ours.
TABLE OF CONTENTS
Introduction ... 1
1 Gas supply, just another network industry? ... 2
1.1 General organisation of network industries ... 2
1.2 The gas supply chain and its specific features ... 7
1.2.1 Production of natural gas, a primary energy source... 8
1.2.2 Specific features of a gas transmission network ... 11
1.2.3 The advantage of a storable fuel ... 21
2 Liberalisation of the gas market... 24
2.1 Liberalisation partly inspired by the North American and British examples ... 24
2.2 The suppliers’ oligopoly ... 26
2.2.1 How does the EU gas suppliers’ oligopoly work?... 29
2.2.2 Towards an OPEG for gas?... 32
2.2.3 Implications for the liberalisation process ... 34
2.2.4 The role of LNG transactions... 35
2.3 European legislation ... 35
2.4 The liberalisation process ... 37
2.4.1 The partition of activities or unbundling ... 38
2.4.1.1 Intensity of unbundling ... 38
2.4.1.2 The emergence of new intermediaries... 39
2.4.2 Deregulation or opening to competition ... 40
2.4.2.1 The emergence of new physical and derivative markets... 40
2.4.2.2 New price formation mechanisms... 42
2.4.2.2.1 Price formation on wholesale markets ... 43
2.4.2.2.2 Price formation for transmission and distribution... 44
2.4.2.2.3 Price formation on retail markets ... 45
2.4.2.3 New risks...46
2.4.3 Regulation...47
2.4.4 Monitoring competition... 48
3 Conclusion ... 50
Annex ... 51
LIST OF CHARTS, TABLES AND BOXES
Chart 1: Simplified diagram of the gas chain ...7
Chart 2: Unit cost of transport by tanker and by pipeline...15
Chart 3: Main LNG reception terminals in Western Europe ...17
Chart 4: Main gas transit routes and their technical transport capacity in Bcm/year - 2004 ...18
Chart 5: Functional outline of the gas chain ...38
Chart 6: Principal gas hubs in Western Europe...41
Table 1: The economic role of network industries in the EU25 ...2
Table 2: Breakdown of world reserves, production and exports of natural gas...9
Table 3: Characteristics of gas, electricity and telecommunications networks...12
Table 4: The different types of storage and their features...22
Table 5: Respective importance of the majors and independent producers in the United States....25
Table 6: The ten main natural gas reserve holders and net exporters ...27
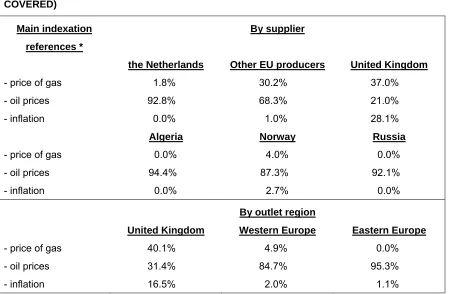
Table 7: Indexation formulas in long-term contracts (% of volumes covered)...44
Table 8: The components of the price of natural gas in Belgium and the United States...46
Box 1: Gas grid calibration criteria...19
INTRODUCTION
Since 1 July 2007, gas and electricity markets have been liberalised for all consumers in the European Union who are now free to choose their gas and power suppliers. Since consumers had previously been faced with a single intermediary for their gas supply, the process of liberalisation has enhanced the roles and responsibilities of the various participants in the gas chain, whose (new) remit does not always appear clear to the novice in an area also characterised by technical complexity.
In Belgium, the gas and electricity markets were fully opened up to competition by 1 January 2007. On a day-to-day basis, this market opening implies a radical overhaul of the way they work, notably when it comes to price-setting mechanisms. For a central bank primarily concerned with pursuing an objective of price stability, understanding correctly how these markets function and the essential features that drive them is a major issue, not least because of the importance of these energy sources as inputs in many industrial processes and the impact that their cost can have on competitiveness and on household budgets.
The aim of this first working paper is to draw the reader’s attention to some of the stakes in the liberalisation of the gas market whose functioning cannot disregard the network infrastructure required to bring this fuel to the consumer, a feature it shares with the electricity market. In the first part, the specific features of the gas sector are put into perspective with those of other network industries, based on the observation that while there are similarities, these network industries have seen their own technological developments, even if they have sometimes been required to evolve in regulatory environments based on common concepts. Several technical terms and concepts specific to the gas industry are also briefly explained for readers who are not so familiar with the subject, when these factors are likely to have an impact on how the gas market operates. The second part tackles the question of gas market liberalisation with reference to the European context, first of all by pointing out the factors that have driven this process, and then by emphasising the consequences of this liberalisation on the way the market operates.
1 GAS SUPPLY, JUST ANOTHER NETWORK INDUSTRY?
1.1 GENERAL ORGANISATION OF NETWORK INDUSTRIES
The specific nature of a network industry lies in the fact that in order to carry its product/service from the producer(s) to a vast number of consumers, the industry requires its own physical or organisational infrastructure providing these connections that is, the network. Furthermore, the necessary infrastructure involves such high installation and maintenance costs that any duplication is economically irrational, investment costs often being irreversible (sunk costs). Some qualify it as bottleneck infrastructure1 with the characteristics of a natural monopoly with increasing returns to
scale (average costs continue to fall as production expands). This infrastructure often benefits from network externalities, i.e. their operational efficiency increases with the number of users (club effect).
Network industries mainly concern carriage of gas, electricity, heat and water and delivery of mail, as well as telecommunications and rail and air transport. They influence economic activity both in terms of production (almost 9% of the value of production in the EU25) and employment (accounting for 4.5% of European employment) and also through the consumer price index (some 7.4%). This economic impact is further reinforced mainly by the fact that the goods and services supplied by these industries are important, even indispensable, inputs for production processes in other economic sectors.
TABLE 1: THE ECONOMIC ROLE OF NETWORK INDUSTRIES IN THE EU25
Percentage share of sectors in HICP* 2005
employment ** 2004
production ** 2004 Electricity 2.1
Gas 1.4 0.9 *** 4.5 ****
Telecommunications 2.7 0.9 2.6
Postal services 0.2 1.5 0.7
Rail and air transport 1.0 1.1 1.2
Total 7.4 4.5 8.9
* HICP = harmonised index of consumer prices.
** As a percentage of the total, excluding financial activities. *** Including supply of heat.
**** Including supply of heat and water.
Source: Eurostat (2007), Structural business statistics (Industry, Construction, Trade and Services).
1 This infrastructure is essential for delivering the goods to the final consumer and, therefore, to induce
On the other hand, network industries mainly provide goods and services that are of general interest, a reason often cited in the past in order to ensure widespread access to them at the same price for all consumers and in all areas (universal service obligation), something that the market does not always guarantee2. And when essential goods are concerned, the question of security of
supply also comes up. All these factors, as well as the need to keep control over any monopolistic activity, have justified the need for regulation and wider intervention by public authorities in the organisation of these industries than in other sectors. For these reasons, the establishment of such networks has traditionally often come under the public remit.
Their organisation has thus shifted towards one of regulated monopolies or State monopolies which have been required to integrate social and collective considerations into the way they operate. In so doing, some economic inefficiencies encountered in a public monopoly are more likely to be corrected than in the case of a private monopoly where the emphasis is on maximising its own profits3. However, this organisation under public control carries no guarantee when it
comes to efficient resource allocation according to the Pareto principle. And, in this respect, allocation resulting from perfect competition is regarded as optimal, because unlike the monopoly situation, it is impossible to improve the situation of one economic agent (seller) without worsening the situation of another economic agent (buyer)4.
The classic setup used in the past for these industries was therefore based on an enterprise that was often state-owned, integrating the four segments of the chain organised around the network, namely production (non-existent in the telecommunications sector), imports (sometimes required for gas), transport, distribution and sale to the final consumer in the form of a telecommunications/transport service or electricity/gas/water supply, this vertical (and to a certain extent horizontal) integration being justified by the existence of economies of scale.
From the end of the 1970s onwards, several network industries have been reformed and their component companies required to operate in a competitive environment, a process that originated in the United States in air transport, telecommunications and natural gas. In the United Kingdom, the accession to the government of the Conservative Party in 1979 was the starting point of a
2 Competition naturally favours the most profitable market activities or segments, at the risk of excluding
some types or groups of consumers. In the case of network-industry services, the universal service obligation is based on two principles: accessibility to the network for all consumers wherever and whenever the service is requested, and non-discrimination via identical prices wherever it is located and, therefore, whatever the cost of connection to the network.
3 In contrast to a private monopoly, a public monopoly can rectify some inefficiency because, in this case,
the wider profit margin of the public monopoly holder (received to the detriment of the consumer’s purchasing power) is recorded in the State accounts. These profits can then be allocated in the general public interest. For an overview of reflections on monopolies and economic efficiency, see van der Linden J. (2005), pp. 14-16.
4 For a brief analysis of the theoretical aspects of liberalisation, see Coppens F. and D. Vivet (2004),
privatisation programme of public enterprises mainly active in network industries, with British Gas being privatised as early as 1986. The rest of the European Community fell into line with this trend by taking on board the Electricity and Gas Directives adopted in 1996 and 1998 respectively. These Directives lay down common rules for the internal market in electricity and gas with a view to making the European market competitive and geared towards the end user, without however deciding on the question whether the concerned companies were public or private property as was the case in the United Kingdom.
According to J. Percebois, various reasons can be put forward to explain the general process of market opening and liberalisation of network industries set in motion in Europe since the beginning of the 1990s (Percebois 1997).
The monopoly has been criticised for its assumed or proven (economic) inefficiency: armed with its natural advantage of being the only supplier, and facing no competition, the behaviour of the monopoly holder can lead to expensive practices, a pricing policy geared more towards appropriation of revenue to the detriment of the community at large, and a weak innovation capacity. Developments in the transaction cost and contestable market theories have in fact fuelled debates on the optimum structure for network industries5.
The transaction cost theory has thrown some light on the effect of transaction costs on the way economic activities are structured: assuming that each transaction can be carried out internally within the enterprise or externally on the market, the most appropriate choice is the one that keeps the transaction cost to a minimum. Vertical integration of activities is sometimes preferable to the market and vice versa, depending on the activity in question and the transaction costs that arise from its structure. Thus, transaction costs on the market include costs related to information research, negotiation, conclusion of contracts, to the uncertainty and the suitable execution of the transactions. A company’s internal transaction costs mainly comprise the costs of monitoring and coordinating its activities. Vertical integration, in particular, is still preferable in terms of transaction costs when it is a "specific" activity that cannot be reassigned to other clients at no extra cost, or when there are activities that require many exchanges of information, a major coordination effort or are marred by uncertainty – all features that tend to push up transaction costs on the market. This vertical integration can nevertheless be called into question when the "specific" nature of the activity decreases as a result of technological progress, for example.
As for the contestable market theory, this has put the usefulness and nature of natural monopoly regulation back into perspective. A market is said to be "contestable" when there are no barriers to market entry and/or exit, whether of a legal (exclusive rights and concessions) or economic (high infrastructure, training and know-how costs, as well as other sunk costs that cannot be recovered)
nature. In the absence of any barriers, potential competition from new entrants has had the effect of bringing the incumbent(s) into line and de facto regulating the market. With barriers to entry in
place, potential competition has no influence on the behaviour of incumbents which are able to take advantage of their position. The public authorities must therefore intervene to restore conditions of market "contestability" and to make the threat of new entrants more likely.
A more optimal organisation structure for network industries therefore seems possible by combining de-integration of the various business "chains" and opening up some of these activities to competition: in the telecommunications industry, both service provision and the infrastructure have been liberalised; but in the gas and electricity sectors, only production and sales are open to competition.
Next, technological change has brought back into question the extent of the economies of scale in one or another network industry segment and thus their "specific" nature, too. The arrival of the new combined cycle gas turbine power plant (CCGT) in the electricity-generating segment has significantly reduced entry costs for new generators. More obviously, new multiplexing techniques have enabled an increase in telecommunication network capacity with limited investment, while new competition has been facilitated by the relatively easy interconnection of the various networks6. And it should be pointed out that advances in the field of information technology have
also proved an undeniable asset in collection, sorting, storage, processing and exchange of the mass of data required to coordinate operations that have become autonomous as a result of liberalisation.
Finally, the liberalisation of the network industries also illustrates the political will for further European integration. The single market that was born out of the 1957 Treaty of Rome is founded on the four freedoms, namely free movement of people, goods, capital and services and its functioning is based on competition. Any barrier to this free movement must be broken down, including monopolies if need be. In fact, Article 90 of the Treaty of Rome (on Community competition law concerning public services), subjects "undertakings entrusted with the operation of services of general economic interest" to competition rules, but only "insofar as the application of such rules does not obstruct the performance, in law or in fact, of the particular tasks assigned to them". At the same time, "the development of trade must not be affected to such an extent as would be contrary to the interests of the Community". The notion of public service is respected, but if this service is not covered by a natural monopoly, it must operate under a regime of free and fair competition. It was in this spirit that the Gas and Electricity Directives were drafted, with the
6 At the same time, the multi-functionality of telecommunications networks, namely their data, image and
objective for the restructured network industries of being able to boost their economic performance through the adoption of competition. It is generally felt that it is indeed possible for these industries to improve the way they operate, since the expected advantage of competition is that it will force companies to make more effort to sharpen their competitive edge, so that they will cut their costs and, hence their prices, which will help maximise consumer welfare. The only segment that constitutes a natural monopoly is that in charge of the infrastructure which requires oversight by a regulator in order to avoid any temptation on the part of its management to abuse a dominant position.
However, as the Commission pointed out in its Communication to the Council of Ministers and the European Parliament on prospects for the internal gas and electricity market (Brussels, 10.1.2007 - COM(2006) 841 final): "As far as gas is concerned, the factors affecting prices, such as the need to move to higher cost sources of supply, for example liquefied natural gas (LNG), and the continued linkage of some gas imports to the price of oil, would have occurred whether or not competition had been introduced. It must be recalled that energy prices cannot be expected to always remain low regardless of external factors. ... Competitive and open markets shall however bring the best prices to end users including to the energy intensive industry." It should be noted that the expectations on prices have been adapted against the 2001 version of the explanatory memorandum on the revision of the Electricity and Gas Directives: "the Community is to create a real and effective internal market for electricity and gas" ... which includes ... "the progressive freeing of all electricity and gas consumers to choose their supplier. There are three reasons for pursuing an ambitious programme in this respect. First, to ensure that all EU companies receive the benefits of competition in terms of increased efficiency and lower prices, leading to increased EU competitiveness...". If it appears that "there is no guarantee that you will save money overnight just by changing energy supplier - prices also vary for other reasons" … "competition in the marketplace will certainly help hold prices down" 7. In its latest Communication on the internal
energy market, "the EU has clearly recognised that the internal energy market is the policy line that ensures fair prices to citizens and industries".8
The liberalisation of the American and British markets effectively set an example: network industries can operate in a different way to the vertically integrated enterprise (monopoly) model, and what’s more, with convincing results as regards price movements. The situation on the US and UK gas markets at the time they were opened up to competition was however quite different from that of the continental Europe gas market – a situation that is analysed in section 2.1.
7 Brochure on the Internal Energy Market: "Your power to choose. The European Union promotes freedom
of energy supplies".
8 In: "European Commission sets out a new impetus for the internal energy market", MEMO/07/9,
1.2 THE GAS SUPPLY CHAIN AND ITS SPECIFIC FEATURES
CHART 1: SIMPLIFIED DIAGRAM OF THE GAS CHAIN
Bulk transport via pipelines
Distribution Transport
Upstream market Downstream market Exploration
Production
LNG storage
Liquefaction Re-gasification
LNG storage
Seasonal storage
Residential consumers,
SMEs, commerce,
etc. Industry Wholesale
market
Wholesale market
Retail market
The supply and marketing chain bringing gas from the producer to the final consumer can be split into several segments:
- production of natural gas through the development of gas deposits both in Europe and beyond; - "bulk" transport of gas within which a distinction must be made between transport from the gas
field to the national grid of the country of destination which can be served by pipelines or LNG tankers, and the national network as such, which ensures the pipeline connections with local distribution networks and large industrial consumers;
- gas storage, used to match variations in supply with changes in demand over different timescales (from peak hourly demand to seasonal fluctuations);
- distribution, which differs from bulk transport on the basis of the pressure of the gas transported to the final consumer. In Belgium, it comprises the low pressure grid where the maximum service pressure admitted may not exceed 98.07 mbar and the medium pressure grid which has a maximum service pressure of between 98.07 mbar and 14.71 bar;
- commercial gas purchasing and sales activities, whether upstream among producers and suppliers on the wholesale market (this includes further resale to traders, suppliers, pipeline and distribution companies) or downstream with final consumers on the retail market.
In comparison to the electricity supply chain, natural gas supply has its own specific features, too, in the field of:
- the gas grid: in view of its intrinsic characteristics, the carriage of gas requires a specific infrastructure from the point of extraction right through to the final consumer;
- its storability.
1.2.1 PRODUCTION OF NATURAL GAS, A PRIMARY ENERGY SOURCE
Natural gas is a primary source of energy, found naturally in the crude state and used as such after being treated for impurities. Its production is dependent on the availability of reserves in the form of conventional non-associated gas, associated gas in oil fields, and even non-conventional gas9.
The distinction between these categories of gas is not so much a question of quality criteria (sulphur or inert gas content – see the end of section 1.2.2) as of differences related to where they come from, and therefore how difficult the gas is to extract, unlike in the case of oil where non-conventional oil is distinguished from non-conventional oil by its "technical" characteristics such as density, viscosity and sulphur content.
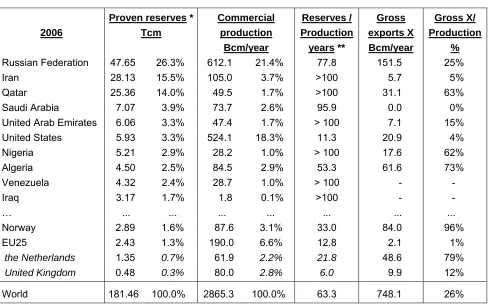
Worldwide proven reserves of natural gas stood at 181 Tcm (trillion cubic metres) at the end of 2006 and at the current rate of production will last for 65 years. Their geographical breakdown is marked by a strong concentration in Russia, Iran and Qatar which together account for more than 55% of these reserves. The rest is shared between the Middle East (10.9%), Asia-Pacific (8.3%), Africa (8.0%), the Americas (8.0%), Eurasia (6.0%) and Western Europe (3.0%).
9 Non-conventional gases include coal gas, shale gas as well as gas trapped in deposits of tight gas sands,
TABLE 2: BREAKDOWN OF WORLD RESERVES, PRODUCTION AND EXPORTS OF
NATURAL GAS
2006
Proven reserves * Tcm
Commercial production
Bcm/year
Reserves / Production years **
Gross exports X Bcm/year
Gross X/ Production
%
Russian Federation 47.65 26.3% 612.1 21.4% 77.8 151.5 25%
Iran 28.13 15.5% 105.0 3.7% >100 5.7 5% Qatar 25.36 14.0% 49.5 1.7% >100 31.1 63%
Saudi Arabia 7.07 3.9% 73.7 2.6% 95.9 0.0 0% United Arab Emirates 6.06 3.3% 47.4 1.7% > 100 7.1 15% United States 5.93 3.3% 524.1 18.3% 11.3 20.9 4% Nigeria 5.21 2.9% 28.2 1.0% > 100 17.6 62% Algeria 4.50 2.5% 84.5 2.9% 53.3 61.6 73% Venezuela 4.32 2.4% 28.7 1.0% > 100 - -
Iraq 3.17 1.7% 1.8 0.1% >100 - -
… ... ... ... ... ... ... ...
Norway 2.89 1.6% 87.6 3.1% 33.0 84.0 96% EU25 2.43 1.3% 190.0 6.6% 12.8 2.1 1%
the Netherlands 1.35 0.7% 61.9 2.2% 21.8 48.6 79%
United Kingdom 0.48 0.3% 80.0 2.8% 6.0 9.9 12%
World 181.46 100.0% 2865.3 100.0% 63.3 748.1 26% Sources: BP (June 2007), "Statistical review of world energy" & IEA (2006), "Natural gas
information 2006" for the Iraqi production figures.
* The proven reserves refer to volumes that can be recovered with reasonable certainty from known reservoirs under existing economic and operating conditions. Data expressed in standard cubic metres (Scm) are measured at 15°C and 1,013 mbar.
** The volume of proven reserves in year t compared to production in year t gives an indication of the life (n years) of these reserves at production levels in t. This is a purely "theoretical" concept since it corresponds to an instantaneous depletion of reserves in t+(n+1).
drilling and flared. Asian LNG producers emerged at the end of the 1970s and were joined by the Middle East producers and Nigeria in the second half of the 1990s.
Production and reserves only make up part of the factors determining gas market supply potential. The gas still has to be brought onto the international markets, and, in this respect, each producing country has its own objectives and will, if needed, give priority to its own domestic market supply (like Saudi Arabia and Iran). But globally speaking, the relative share of gas production sold on the international markets (excluding intra-FSU and intra-CIS trade)10 has risen constantly: from 4.4%
of production in 1970 to 13% in 1980, 15% in 1990 and 26% in 2005. Beside the impact of the rise in oil prices since 1973 which has made gas prices at the burner more competitive and made it more profitable to sell, this expansion can also be explained by the adoption of gas export promotion policies by several producer countries (Algeria, Nigeria, Qatar), by the growing shortage of production in relation to consumption in several gas-consuming countries which has been offset by higher imports (United States and United Kingdom), and more recently, within the last decade, by the development of LNG transport for which costs have fallen considerably and capacities expanded, which has made new outlets on the international markets accessible at a reasonable cost.
Unlike electricity generation, production and supply of natural gas are largely governed by transactions concluded outside the scope of European energy market liberalisation. Therefore, part of the final price of gas is fixed outside this context and in the framework of negotiations between European wholesale market operators and a relatively limited number of producers located beyond Europe’s borders. This situation is not without impact on the way the European gas market works. Opportunities for competition at the production stage effectively depend on the number of (independent) gas producers and the possibilities for gaining access to these resources.
Even today, access to resources is still largely dependent on long-term contracts of 20 to 25 years which specify:
- the volume taken: this can be covered by a "depletion contract" through which the buyer commits to buying up the entire volume of gas available as the (generally small-scale) field is being developed or, more frequently, a "supply contract" in which the annual take is clearly stated along with the minimum seasonal flexibility conditions;
- the price paid: in the majority of ongoing contracts on the gas markets in continental Europe (and also Asia), this price is index-linked to the price of competing fuels in the final consumer’s market where the competition takes place, and follows a "net-back" logic: the price of the gas is negotiated by the importer/buyer on the basis of substitutes (fuel oil and gasoil) on the outlet markets, from which the various costs to be borne up to the point of delivery (cost of distribution, storage, transport and possible re-gasification) are removed. The amount thus
calculated "backwards" represents the maximum price that the importer is prepared to pay for the gas. On the producer/seller’s side, the minimum price he wants to get is one which covers, over and above production costs, transport costs up to the point of delivery (with possible liquefaction) and royalties. The price that is finally agreed falls somewhere between the two. It will depend on the bargaining power of the parties involved and will determine the splitting of revenues between them.
Specific clauses conforming to a logic of risk-sharing are often written into contracts: the "take or pay" clause obliges the buyer to take a minimum volume of gas, which implies a transfer of the risk of putting the quantities under the responsibility of the buyer, while the price indexation clause puts the price risk on the seller who enters into a commitment to supply the gas at a competitive price on the buyer’s end-user market as it is index-linked to the price of competing energy sources. To compensate for any adverse effects of this principle of "net-back pricing" for distant producers, a destination clause has often been included preventing the buyer of the gas from selling it on to a third party without the prior agreement of the producer/supplier. These clauses have been ruled illegal by the European Commission, because they appreciably restrict the scope for competition between operators. Non-EU suppliers have already adapted - at least in part - to this contractual provision being scrapped by carrying the gas directly to the final market (for instance, by delivering the gas on an ex-ship basis, which means that the supplier remains the owner of the LNG cargo
until it is unloaded), or even by getting a foot directly in the European market.
The long-term nature of these contracts has enabled producers to raise the necessary finance for the completion of specific production and transport infrastructure, while at the same time supporting the buyers’ security of supply which has tended to perpetuate trade flows. However, in the context of a liberalised market, these long-term contracts can have an inhibiting effect on the development of price competition by limiting the supply opportunities for new entrants. They sometimes lack flexibility even though the Commission points out that the contracts recorded in its gas sector inquiry offer buyers on average 25% flexibility (i.e. the minimum that could be taken is 75% of the maximum total take). The degree of flexibility varies considerably from one contract to another, but very few contracts offer extreme flexibility. Most of them have some 20% - 40% flexibility with a degree of flexibility which tends to diminish the greater the distance to the place of extraction.
1.2.2 SPECIFIC FEATURES OF A GAS TRANSMISSION NETWORK
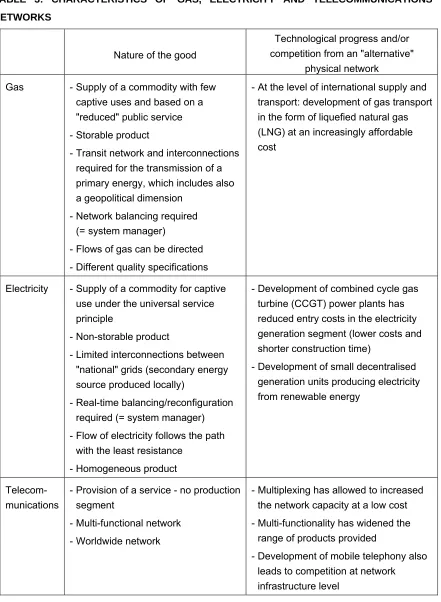
There are still some disparities between network industries related to the very nature of the goods delivered/services provided, to technological development and to the existence of possible physical competition from another network. In Table 3, the specific features of a gas network are compared with those of telecommunications and electricity networks, in line with articles previously published in this series on the liberalisation of electricity markets in Europe11.
TABLE 3: CHARACTERISTICS OF GAS, ELECTRICITY AND TELECOMMUNICATIONS
NETWORKS
Nature of the good
Technological progress and/or competition from an "alternative"
physical network Gas - Supply of a commodity with few
captive uses and based on a "reduced" public service - Storable product
- Transit network and interconnections required for the transmission of a primary energy, which includes also a geopolitical dimension
- Network balancing required (=system manager)
- Flows of gas can be directed - Different quality specifications
- At the level of international supply and transport: development of gas transport in the form of liquefied natural gas (LNG) at an increasingly affordable cost
Electricity - Supply of a commodity for captive use under the universal service principle
- Non-storable product
- Limited interconnections between "national" grids (secondary energy source produced locally)
- Real-time balancing/reconfiguration required (= system manager) - Flow of electricity follows the path
with the least resistance - Homogeneous product
- Development of combined cycle gas turbine (CCGT) power plants has reduced entry costs in the electricity generation segment (lower costs and shorter construction time)
- Development of small decentralised generation units producing electricity from renewable energy
Telecom-munications
- Provision of a service - no production segment
- Multi-functional network - Worldwide network
- Multiplexing has allowed to increased the network capacity at a low cost - Multi-functionality has widened the
range of products provided
- Development of mobile telephony also leads to competition at network infrastructure level
service obligation12. The intervention of the public authorities is also required to obtain construction
permits for the different infrastructure (LNG terminals, storage sites, pipelines). The pipeline paths mainly have to cross public property and frequently go through private property (rights of way, concessions), while storage sites and LNG terminals have to comply with environmental legislations and safety rules, etc. Hence, procedures have to be followed with several different public bodies under many different laws, all of which takes time (3 to 5 years) when construction times are already substantial.
Since it can be stored, gas allows a more flexible adjustment of supply to meet changes in demand than electricity does, which is no small advantage when more than half of all consumption depends on climate conditions13. So, 94.2% of the natural gas in Belgium (97.5% in the EU15) is devoted to
a thermal use as a heating fuel or for generating heat and power (including for steam reforming processes in the chemicals sector), while the rest is used in methane form as a chemical reagent in the chemicals and petrochemicals industries’ own cracking/reforming processes14. However,
storage sites are limited (as they depend on the geological structures available - see section 1.2.3) while flexibility needs are increasing (i.e. greater distance for LNG supplies to travel).
As far as international transport is concerned, carrying gas, whether in gaseous or liquid (LNG) form, is expensive: some 6 to 7 times more costly than transporting oil (based on the same energy content), which is largely explained by the fact that the energy content of a cubic metre of gas is a
12 Unlike electricity, the supply of gas cannot be considered as falling under a universal service: at the
infrastructure access level, it is quite rational to limit the obligation to build and/or operate extra transmission facilities to those that could be built in economically justifiable conditions; for when it comes to energy supply, most users cannot be considered as being totally dependent on gas as it can be replaced by another fuel (unlike electricity, gas has very few captive uses). The public service obligation, on the other hand, comes into play as soon as the customer is connected to the grid, via the obligation for the holders of a supply permit to ensure the continuity of gas supplies to distribution companies for example, and therefore to safeguard their security of supply. For a detailed description of the potential content of these public service obligations, see Percebois J. (2002).
13 A very rough estimate of this dependence is provided by the share in final consumption of gas of the
residential and commercial sectors where it can reasonable be assumed that natural gas consumption is mainly intended for heating.
Share of residential and commercial sectors in final consumption (2004).
EU15 Belgium France Germany Italy the Netherlands UK
61% 51% 62% 66% 56% 65% 77% Source: Eurostat.
14 Because of its composition, methane (CH4) is a source of carbon and hydrogen often used in industrial
thousand times less than that found in an equivalent volume of oil15. It requires the use of specific
techniques designed to reduce the volume of gas transported by lowering its temperature and/or pressure.
Transport via pipelines is based on fairly straightforward technology that has not developed much, apart from the materials used and their resistance to pressure, which enables either the pressure for an identical pipeline diameter to be raised or the diameter itself to be increased and thus reduce frictional losses. The economies of scale are high especially since pipeline capacity increases exponentially with larger diameters. Transport (and distribution) of gas by pipeline involves high fixed investment costs in network infrastructure (pipes and compressor stations) alongside low variable operating costs (labour and the gas needed for compression) and maintenance costs. These fixed costs depend on the length of the network, the required peak output, the optimum number16 of compressor stations required for the chosen diameter of the pipes and the topology of
the land crossed, while the variable costs are directly linked to pressure maintenance and vary according to the length of the network, the distance between compressor stations and losses due to distance and the state of the network. On top of these operational costs transit fees have to be paid in some cases when the pipelines run across transit countries.
Transport costs for liquefied natural gas (LNG) are also high and this can be explained by the fact that leading-edge "cryogenisation" technology is used to carry the gas in liquid state, which reduces its volume by 1/600th, and to keep it like that. Sending LNG overseas requires the use of specific facilities, both at the dispatching terminal and the reception terminal. The gas first goes through a pre-processing stage intended to reduce sources of corrosion to aluminium facilities (demercurisation) and to avoid any obstruction of valves and interchangers caused by cristallisation of "impurities" (deacidification of gas containing CO2 and dehumidification of gas with H2O) at low
temperature, the gas being gradually cooled at a temperature of -161°C, a temperature at which it remains in liquid state at its boiling point at the pressure level of storage and transport. LNG is transported by sea on tankers, isothermal vessels built specially to withstand the mechanical constraints of transporting liquids on the high seas and to meet the thermal constraint of keeping the cargo at a temperature of -161°C while limiting any losses of materials through evaporation. The reception terminals are also specially equipped with flexible pipelines for unloading and carrying the liquefied natural gas to LNG storage facilities, with compressors, regasifiers intended
15 For an average crude oil density of 853 kg/cm and an average higher (or gross) calorific value (GCV - see
annex) of 47.37 MJ/kg, 1 cm of crude oil ≈ 40407 MJ, as compared to the GCV of 1 cm of Algerian (39.19 MJ/cm) or Norwegian (40 MJ/cm) natural gas. In: IEA (2006a) and IEA (2006b).
16 Pipeline economics combines three cost elements: pipelines, compression stations and the energy used
to vaporise compressed LNG as well as reprocessing and odorisation units before putting the gas on the transmission network. The LNG storage units at the dispatching terminal enable large enough quantities of gas to accumulate to fill a cargo, while at the reception terminal, they enable irregular batches of LNG shipments to be modulated into a continuous flow prior to re-gasification and to sending the gas on the grid. In this respect, the recent development of tankers with on-board re-gasification facilities (LNG re-gasification vessel or LNGRV - see below), widens the range of options available to solve the problem of any potential unavailability of storage capacity, while ensuring the gasification of the LNG. Apart from this largely operational function, LNG storage can also provide a reserve function in reception zones to cover seasonal peak releases in the winter if alternative underground storage facilities are not available (as in Japan, for example).
Chart 2 maps the evolution of the unit cost of bulk transport of gas over distance, in both liquid and gaseous state, from facilities with a capacity of 10 and 20 Bcm/year17.
CHART 2: UNIT COST OF TRANSPORT BY TANKER AND BY PIPELINE
0,0 1,0 2,0 3,0 4,0 5,0
1000 km 2000 km 3000 km 4000 km 5000 km 6000 km
0,0 2,0 4,0 6,0 8,0 10,0 12,0 14,0
Offshore - 10 Bcm/y Onshore X-70 - 10 Bcm/y Onshore X-80 - 10 Bcm/y Onshore X-80 - 20 Bcm/y LNG - 10 Bcm/y LNG - 20 Bcm/y
USD/MBtu cEUR/cm
Offshore
Onshore
LNG
Better steel quality Increased
pipeline capacity
Increased terminal capacity
Costs calculated with an internal rate of return of 10%, expressed in USD per million British thermal units and in euro cents per Standard cubic metre (see annex for definitions). The (onshore) X-70 and X-80 refer to differences in steel quality.
Source: Observatoire Méditerranéen de l'Energie.
17 Existing very large volume pipelines have a diameter of 1,400 mm and a transport capacity of
Although there is not always a choice between these two alternatives, it is worthwhile pointing out their specificities:
- the unit cost of transport falls as output increases thanks to the economies of scale that exist in the two chains;
- LNG liquefaction/re-gasification facilities represent a major fixed cost that does not vary with distance while the costs that do vary over distance (i.e. more tankers needed for longer distances) are limited;
- in the case of pipeline transport, the total unit cost rises more in proportion to the distance covered than LNG costs (due to the high fixed costs incurred for the pipes and compression facilities according to distance), while fixed costs that do not depend on distance are almost non-existent. The use of higher-performance steel products enables the pressure to be raised from 70-80 bar (X-70 steel pipe) to 140 bar (X-80 steel pipe) and thus allows larger volumes to be transported for the same diameter, while reducing frictional losses, and hence the number of compressor stations required. Costs of using offshore pipelines are higher for obvious reasons of a more complex implementation and because of the need to use materials that can withstand the pressure of deep-sea depths.
The cost of LNG transport evidently becomes cheaper for distances of more than 3,500 - 4,000 km. However, this "break-even" distance increases with output, as the unit cost of transporting LNG is more proportional to output than pipeline transport, which leads to a more significant reduction in the slope of the cost curve for pipeline transport when volumes are larger.
In view of the shortage of re-gasification terminals experienced at the start of the decade18 and
taking account of the difficulty in getting a licence for constructing and operating this kind of infrastructure in densely populated areas and/or subject to stricter regulations, an alternative to traditional LNG reception terminals has emerged with the development of offshore unloading sites. The LNG gasification vessel (LNGRV) solution, namely to use tankers equipped for on-board re-gasification and unloading via an offshore pipeline linked up to the overland network, is the most advanced19. This approach has several advantages over the conventional LNG terminal:
- the reception infrastructure is slimmer and simply composed of a marker buoy at sea which the LNGRV hooks up to in order to unload the re-gasified gas or it can also dock at a wharf that has been suitably equipped in advance. The gas is then injected into the grid. Infrastructure costs are lower (equivalent to 15 to 20% of the cost of a land-based terminal20) and licences
easier to obtain because of the more limited impact on the neighbouring area;
18 Nowadays, there is a growing concern about the lack of liquefaction capacity, similar to the situation
experienced a few years ago when the LNG market suffered from a deficiency of tankers.
19 For a list of the various possibilities, see: Boussena S., Pauwels J.-P., Locatelli C. and C. Swartenbroekx,
(2006), pp. 298-299.
20 On the other hand, the cost announced for a 145,000 cm LNGRV is $290 million, compared with a cost of
- the flexibility of LNG transport is boosted by wider delivery possibilities, including towards port zones where unloading from large vessels had previously proved to be impossible. Partial unloading of a cargo is also possible and can be rapidly resumed in the event of any interruption owing to unfavourable weather conditions in the unloading zone (e.g. hurricanes).
As the gas is regasified on board, its delivery remains subject to the availability of sufficient downstream transmission capacity to be able to absorb the subsequent quantities carried in this way (150,000 cm of LNG for most of the LNGRV on order) or at least depends on the availability of an appropriate storage site nearby. The duration of unloading is also longer owing to the re-gasification process, rising to 5-6 days compared with 12 to 24 hours for unloading an LNG cargo.
CHART 3: MAIN LNG RECEPTION TERMINALS IN WESTERN EUROPE
WilhelmshavenŚwinoujście Eemshaven Dunkerque ZeebruggeRotterdam Le Havre Antifer Milford
Haven Canvey Island Isle of Grain Teeside East Irish Sea Shannon Estuary Isola di Porto Levante Montoir
Existing terminals in May 2007 Terminals under construction Proposed new terminals Existing terminals being extended
Source: Based on GRTgaz.
Carriage of both gas and electricity hinges on an essential transmission infrastructure. However, since natural gas is a primary energy partly imported from its extraction zones, making it available on the different national markets in Europe has required the installation of transit and interconnection pipes between these markets. This is a less urgent necessity for electricity which is a secondary energy source generated "locally". Even before liberalisation, the need for these gas interconnections had been felt and several countries have emerged as indispensable for the transit
Mugardos El-Ferrol
Revithoussa Fos 1,2 & 3
of gas to markets not bordering production areas. In the eastern part of the EU, these transit countries are mainly Slovakia, the Czech Republic and Poland, while in the west, several major transit pipelines run through Belgium with a total capacity three times the level of its own domestic consumption. In this respect, the real issue at stake in the context of a liberalised market is a non-discriminatory and transparent access to infrastructure with sufficient capacity.
CHART 4: MAIN GAS TRANSIT ROUTES AND THEIR TECHNICAL TRANSPORT CAPACITY IN
BCM/YEAR - 2004
65,9 29,2
24,5
13,1 7,3 20,0
18,4
16,2
14,8
14,6 11,0
10,0 6,5
4,0
3,5
2,5 2,4
0,9
20,8
4,1 14,8
115,3 34,8
Source: European Commission (2007), "DG Competition report on energy sector inquiry".
The gas is then carried to the final consumer (residential and commercial sectors and small industries) via the distribution network which has a lower service pressure, in a similar way to the electric power system with its low-, medium- and high-voltage grids. From a technical point of view, the electricity and gas distribution networks can nevertheless be distinguished from one another: - by the degree of balancing prescribed for the network to operate properly, a power grid
requiring balancing in real time and the intervention of a system manager21; for the gas grid,
intervention of this kind is also necessary, but is less constraining since there is a degree of flexibility for gas pressure in the grid pipelines which can help offset variations between gas inputs and off-takes. The volume of gas present in the grid can vary in response to changes in temperature and/or pressure. It is also possible to store small quantities of gas for short periods by raising the pressure in the pipes. These fluctuations in the volume of gas in the grid
21 Indeed, by the very nature of the physical properties of the electric current and in particular currents
pack fluctuations) contribute to a better management of the network with increases in pressure in off-peak periods in order to boost supply capacity in periods of higher demand22;
- by whether it is possible or not to direct the flows of energy transported: moving an electric current conforms to a physical law whereby the current entering a junction in the grid is split into outgoing currents according to the resistance of the outgoing cables (known as Kirchhoff's loop rule), thus making it impossible to direct the current towards any one particular junction; while in the case of gas, transmission can be directed, subject to a correct calibration of the grid and its component parts (see Box 1).
So, in contrast to an electric current, it is possible to get a good understanding of the physical carriage of gas and any resultant losses in transmission and distribution, and therefore to charge them to the consumer on the basis of a price that is based on distance. In the case of electricity, it is not possible to set such a rate if there is no way of knowing the physical path followed by the electrons. These differences related to the specific physical laws governing the carriage of gas and electricity have a direct impact on the nature of prices to be applied for third party access (TPA) to the grid, for instance: for electricity a (flat rate) "postage stamp" pricing mechanism is required, while for gas, pricing based on distance is possible (see section 2.4.1)23.
BOX 1: GAS GRID CALIBRATION CRITERIA
Apart from the need to guarantee a specific delivery pressure, correct shipment of natural gas also implies maintaining a sufficient flow rate at each junction of the grid so as to be able to direct the movement of the gas among the various pipes in the main system, while taking account of load losses between system entry and exit points. The aim is therefore to see that enough kinetic energy is maintained to ensure that the pressure gradient between any two points and the load loss caused by friction along the pipes between these points remain the same. The components of a gas transmission network are influenced by two other variables which are of direct relevance to the consumer at the end of the gas pipes: the output and calorific value of the gas carried, especially if it is intended for industrial use as in chemicals, for instance (feedstock). Apart from these operational requirements, it is also of utmost importance to keep up a minimum pressure over and above atmospheric pressure in order to avoid any air or oxygen getting into the grid and causing an explosive interaction.
22 This flexibility in gas grid balancing is nevertheless limited by its technical and operational characteristics
with a tolerance threshold that varies considerably with pressure levels and volumes flowing through the pipes.
23 For a detailed description of the different pricing methods on the electricity and gas grids, see
The gas grid hinges on four types of installations:
- main pipelines: these consist of welded steel pipes from one end to the other; those in the transmission system are usually arranged in the form of an arborescent network, that is, there is only one single path between two junctions in the grid. Generally speaking, the distribution network is designed as a meshed network, i.e. there are at least two paths between two grid junctions. However, the gas grid is generally less integrated than the power grid because of its high transmission costs (need for a critical mass of customers to justify building such a network in the first place);
- interconnector stations located at each junction of the grid: this set of valves make it possible to regulate the transit flow between pipelines, taking account of the precise pressure and flow rate needed for each pipeline;
- compressor stations: with the gradual lowering of the pressure of the gas as it is moved, it is necessary to raise pressure levels by installing compressor stations along the grid in order to maintain the pressure level required for the transport of the gas as well as for the final consumer24;
- blending stations: as calorific value can vary from one gas to another, the quality of the gas present in the grid is harmonised by the addition of methane (to raise the calorific value) or an inert gas (to reduce the calorific value) in order to ensure the correct functioning of customers’ equipment.
Lastly, and again unlike electricity which only has to meet tension and frequency criteria, natural gas is not such a homogenous product and its composition can vary considerably depending on its origin. But the quality of the gas injected into the network is important both for the proper functioning of combustion installations and appliances and for its use for chemical purposes by industry. Quality specifications for gas mainly concern its upper calorific value, its Wobbe index25,
the water dew point, the hydrocarbon dew point, and the sulphur, carbon dioxide and oxygen contents. These characteristics do matter for gas buyers and have to be respected both by the supplier and the transporter. Indeed, the gas injected into the network is mixed with the quantities of gas present and each transporter is responsible for the quality of the gas it is carrying on its network, within very precise limits.
24 GRTgaz (2006).
25 The Wobbe index is used to compare the combustion energy output of different composition fuel gases in
These differences in quality also interfere with supply conditions on the Dutch, Belgian, French and German gas markets, where both low calorific value gas (9,769 kWh/cm) and high calorific value gas (11,630 kWh/cm) are sold. Poor gas (L-gas), coming mainly from the huge Slochteren field in the Netherlands, is carried on networks that are physically separate from the networks shipping high gas (H-gas) and also requires separate storage sites26. Moreover, 20% more L-gas has to be
carried in volume for the same amount of energy than with H-gas.
1.2.3 THE ADVANTAGE OF A STORABLE FUEL
Both trade in gas and electricity can only be subject to limited arbitrage between different places, since producers and consumers have to be linked up by a physical infrastructure. Nevertheless, unlike electricity, gas has the advantage of being storable and allowing arbitrage over time, a real asset for meeting the seasonality of demand for gas which varies considerably over the year because it is largely used for heating.
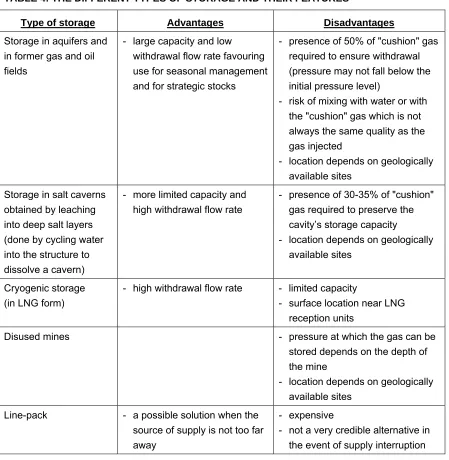
There are several options possible for storing gas:
- various types of storage facilities are used for seasonal demand management either in surface or underground sites. Underground sites are replenished during the off-peak (summer) season so as to have sufficient volumes in periods of high demand – while surface storage of liquid LNG is used to cover peak demand. The 261,000 cm LNG storage capacity available at Zeebrugge makes it possible for gas to be injected into the grid over the equivalent of about 6.6 days at the maximum withdrawal rate of 950,000 cm/h from these storage facilities;
- an indirect form of storage is provided by the network through the "line-pack": pipeline pressure and diameter are calibrated so as to be able to meet day-time fluctuations in consumption, even as far as to meet all peak demand. Although expensive in infrastructure terms, this latter solution is conceivable in the case of shorter distances between points of production and consumption. The Dutch and British networks have therefore been equipped with compressors that can raise the pressure in the grid in order to meet peak demand, since the relative proximity of their gas fields enables them to be used as basic storage sites.
The advantages and drawbacks of these different types of storage are shown in Table 4. The physical characteristics (porosity, presence of water, etc.) of storage sites effectively determine the speed at which the gas is injected and withdrawn, and therefore, its availability.
26 As far as Belgium is concerned, the proximity and the flexibility in the contracts with the Dutch supplier
TABLE 4: THE DIFFERENT TYPES OF STORAGE AND THEIR FEATURES
Type of storage Advantages Disadvantages
Storage in aquifers and in former gas and oil fields
- large capacity and low withdrawal flow rate favouring use for seasonal management and for strategic stocks
- presence of 50% of "cushion" gas required to ensure withdrawal (pressure may not fall below the initial pressure level)
- risk of mixing with water or with the "cushion" gas which is not always the same quality as the gas injected
- location depends on geologically available sites
Storage in salt caverns obtained by leaching into deep salt layers (done by cycling water into the structure to dissolve a cavern)
- more limited capacity and high withdrawal flow rate
- presence of 30-35% of "cushion" gas required to preserve the cavity’s storage capacity
- location depends on geologically available sites
Cryogenic storage (in LNG form)
- high withdrawal flow rate - limited capacity
- surface location near LNG reception units
Disused mines - pressure at which the gas can be stored depends on the depth of the mine
- location depends on geologically available sites
Line-pack - a possible solution when the source of supply is not too far away
- expensive
- not a very credible alternative in the event of supply interruption
In terms of market forces, the possibility of storing gas can have a moderating effect on gas price volatility when prices are determined on a liberalised market, because it constitutes an additional source available to meet fluctuations in demand for gas27. This alternative is not available28 for
electricity and goes some way to explaining the high volatility in the price of electricity in a context of similarly fluctuating demand in the very short term.
27 The purely operational use of storage sites for good technical management of the network should not be
underestimated.
28 There is of course still a small margin of manoeuvre in storing electricity with the use of a pumped-storage
At the same time, it is this very same price volatility that generates incentives for and revenue from new investment in storage infrastructure. Any action taken by the authorities in this area, for instance within a context of a strategic gas storage as it exists for oil, should be entirely transparent. Unlike "commercial" stocks which enable operators to work in normal circumstances, strategic stocks would be intended for use in circumstances where the market alone cannot provide enough gas owing to unusual conditions (extreme weather conditions, pipeline rupture, etc.). However, they may not physically replace existing seasonal storage (due to the scarcity of available sites), neither replace commercial stocks, if only in the minds of the operators themselves: if there was any doubt about the conditions of release on the market of such a strategic storage, it could contribute to under-investment in commercial storage.
The high costs of gas storage have to be weighed up against the advantage brought by its availability in the first place. According to the IEA and on the basis of a survey of investment in commercial storage sites under construction, the initial cost of the capital needed for underground gas storage facilities is 5 to 7 times higher than for underground oil storage (comparison per tonne of oil equivalent stored). And when it comes to LNG storage versus storage in oil tanks, the ratio is
10 to 129. With a view to building up strategic stocks, and assuming that there are sites available,
the capital cost of constructing the infrastructure necessary to cover 90 days of net imports of gas (2015 level) by IEA member countries would be around $54 billion (constant 2005 $ price) to which another $40 billion (constant 2005 $ price) should be added for the purchase of the gas (at 2005 prices) and annual variable costs equivalent to 10% of the capital cost, due to losses incurred through gas leakage (estimated at 2%).
Finally, in exceptional circumstances, storage space can be provided by the tankers themselves, if needed, when market conditions make this immobilisation of floating cargoes economically acceptable. So, in 2006, the fall in gas prices on spot markets to below the price of long-term supply contracts encouraged the appearance of these "floating storage" facilities, as owners of spot cargoes preferred to keep them at sea (at their own cost) awaiting more favourable spot price evolutions (Petrostrategies 2007a).
2 LIBERALISATION OF THE GAS MARKET
Following the examples set by the Americans and the British, the European Union has launched into a process of gas and electricity market liberalisation, with a view to establishing a common, integrated European energy market governed by the same competition conditions in all Member States.
2.1 LIBERALISATION PARTLY INSPIRED BY THE NORTH AMERICAN AND BRITISH EXAMPLES
The American and British gas markets were deregulated for similar motives, against a backdrop of mature markets with practically no dependence on imports, unlike the gas market in continental Europe.
The US gas industry was the first to develop around the middle of the 1920s, first locally and then gradually extending to other US States along with the development of long-distance gas transport technologies. Faced with local producers’ exclusive rights over the transmission networks in exchange for financing them, the need for regulation soon became evident.
In practice, the gas sector is regulated by the individual States and at federal level as soon as the gas is carried beyond a State’s own borders. Up until 1978, the industry was subject to strict price controls, even price freezes, encouraging strong demand but having an inhibiting effect on domestic production. So, after several periods of gas shortages, sales prices at the mouth of the wells (wellhead prices) were gradually raised from 1978 onwards. Nevertheless, this wellhead price regulation system was only to be abandoned from 1985, a move that would contribute to bursting the gas bubble that had appeared at the beginning of the 1980s under the combined effect of a domestic production base that had shifted into over-capacity, under the impetus of higher regulated prices, chasing demand that had effectively flattened out. At the same time as prices were deregulated, open and non-discriminatory access to the transmission network was granted to all suppliers. This approach was later extended to the distribution networks, too. All these measures served to boost competition, including at local producer level, the key being a 50% cut in exploration and discovery costs. The favourable evolution of prices has relaunched demand, boosted grid output and reduced the unit cost of transmission (IEEJ 2003). Today, the American market is similar to a regulated competitive market where market entry is open although subject to compliance with the (strict) regulations in force.
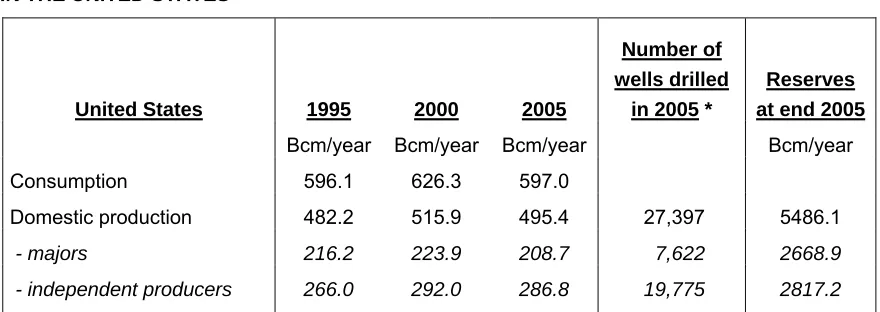
5,000 independent producers exclusively active in hydrocarbons exploration and production coexist, scattered across the 33 States where oil and/or gas deposits are exploited in the United States. Despite often being very small (they employ 12 people on average), in 2005 these independent producers hold 51% of total gas reserves and account for around 58% of production – the equivalent of 48% of US consumption.
TABLE 5: RESPECTIVE IMPORTANCE OF THE MAJORS AND INDEPENDENT PRODUCERS
IN THE UNITED STATES
United States 1995 2000 2005
Number of wells drilled
in 2005 *
Reserves at end 2005
Bcm/year Bcm/year Bcm/year Bcm/year Consumption 596.1 626.3 597.0
Domestic production 482.2 515.9 495.4 27,397 5486.1
- majors 216.2 223.9 208.7 7,622 2668.9
- independent producers 266.0 292.0 286.8 19,775 2817.2
* Exploratory wells and development wells (dry holes excluded).
Source: EIA/DOE (2006), "Performance profiles of major energy producers 2005".
The natural gas industry in the United Kingdom took off a bit later, at the end of the 1950s, but could use the existing town gas distribution infrastructure, and largely rely on the gas sector operators (manufactured gas producers and distributors) when the North Sea gas fields were discovered30. The giant British Gas was to emerge from the closer links between these operators
and soon gain monopoly status, except for production, although it obtained exclusive purchase rights. In a similar way to the American model, the liberalisation of the UK gas market was used to a certain extent to re-launch a production base that had become rather flat as a result of the obligation to sell the gas on to a single intermediary under not very good conditions and that had become indispensable for gaining market access. Under the Oil and Gas Act passed in 1982, the obligation to sell gas exclusively to British Gas was lifted and, in 1986, the company was privatised.
North Sea gas fields on the British continental shelf are developed by 25 different operators who share the 129 gas field exploration licences granted by the British authorities since 1976.
30 At the beginning of the 1950s, the UK gas companies (town gas suppliers) in fact became very interested