Int. J. Electrochem. Sci., 11 (2016) 4300 – 4309, doi: 10.20964/2016.06.87
International Journal of
ELECTROCHEMICAL
SCIENCE
www.electrochemsci.org
Ammonia Oxidation on the Barium Doped Nano Structured
PbO
2Electrode: An Electrochemical Preparation and
Application
Karunakaran Kannan, Govindan Muthuraman, and Moon Il- Shik*
Department of Chemical Engineering, Sunchon National University, #255 Jungangno, Suncheon 540-742, Jeollanam-do, Republic of Korea.
*
E-mail: [email protected]
Received: 8 March 2016 / Accepted: 25 April 2016 / Published: 4 May 2016
In the present investigation, we report a novel nano structured Ba/PbO2 prepared by electrochemical
deposition method has been employed for the effective oxidation of ammonia in aqueous solutions. The electrode deposition was achieved in the boric acid bath solution that yielded a smooth deposition of PbO2 without poisoning the supporting electrolyte. The surface characterization of the deposited
layer was done using Scanning Electron Microscope (SEM), and observed that cauliflower like morphology of undoped PbO2 was completely changed to a sharp edge like flower shape morphology
due to the addition of Barium ions. The XRD characterization showed that nano crystallinity of PbO2
gets altered with the concentration of the Barium (Ba) ion dopant. Cyclic voltammetric investigation indicated that Ba10-5/PbO2 electrode effectively oxidized Ammonia (NH3) in alkaline solution, as
confirmed through FT-IR spectral analyses. The prepared Ba containing electrode layer is quite promising for the oxidization of Ammonia for various industrial applications.
Keywords: Electro-deposition, Nano structure, Barium doped PbO2, Ammonia oxidation.
1. INTRODUCTION
disorders, poor cognition, anxiety, depression and movement disorders [6]. Also, ammonia determination is important in water samples where it indicates organic material decomposition which can be harmful to human health, whilst higher ammonia levels are of analytical interest in industrial operations such as refrigeration or fertilizer manufacture.
Ammonia oxidation is a slow process at low temperatures and efficient methods are required to convert ammonia to nitrogen at reasonable reaction rates. There are different methods for the oxidation of ammonia such as by thermal degradation [7,8,9], electrochemical oxidation [10], photoelectron catalytic oxidation[11], metal catalyst Pt, Pd, Ir, Ru, Ag [12], and metal oxides like Co3O4, MnO2 or
V2O5 [13], main group oxides such as SnO2 [14], and a bimetallic mixed oxides catalyst such as
Fe2O3-Al2O3 [15], ZrO2/Al2O3 [16]. Metal oxides are more effective for ammonia oxidation but need
to be operated at higher temperature. The electro-catalytic oxidation methods provide simple and room temperature destruction of ammonia. The well accepted mechanism of ammonia oxidation in alkaline solutions on Pt electrode was proposed by [17] and involves dehydrogenation of adsorbed ammonia and formation of N2 gas. To over come these problems, we need enough technique for complete
degradation of ammonia to N2 gas. But, adsorption of atomic nitrogen blocks active sites leading to
complete Pt deactivation. In the recent past, many electrodes like BDD [18],SnO2 [19] and IrO2 [20],
have been found more effective oxidation of ammonia. In particular, Lead based alloys and oxide materials on metal substrates like Ti/PbO2 [21], Ti/SnO2+Sb/PbO2 [22],CNT (Carbon nano tube)/PbO2
[23], Ti/Pt/PbO2 [24], and PbO2/CPE [25],electrodes found effective oxidation of NH3 gas. All
above-mentioned works were done using bulk metal or metal oxide electrodes with high precious metal loading, whereas to develop efficient and economically viable electrodes the amount of precious metals must be reduced. This can be achieved by using electrocatalysts in the form of nanoparticles dispersed on high surface area conductive supports. It is well known that ex-situ synthesis of nano-particles ended up less adherence and conductivity problems with the support. Electrochemical in-situ nano particle preparation of bimetallic metal oxides provide not only adherence but also can be control the structure of the nano particles.
In the present work, alkali earth metal barium selected as dopant to nano structured PbO2
electrode. It is known that alkali earth metal oxide such as MgO [26], BaO [27], have been reported be a property of sensing NOX, In specifically BaSO4/PbO2 [28, 29] material have been reported. We
believe that addition of Ba2+ion, the PbO2 catalytic activity and adherence is increased predominantly.
Here, we have synthesized nano structured Ba doped PbO2 by electrochemical method, the optimized
Ba. PbO2 was subjected to oxidized NH3 at NaOH medium. The composition and morphology were
analyzed by the XRD and SEM respectively. Ammonia oxidation property of Ba.PbO2 was
characterized by cyclic voltammetry and FT-IR spectroscopy.
2. MATERIALS AND METHODS
Chemicals and reagents were used for the synthesis of barium doped PbO2 electrode: Pb(NO3)2
(99.9%) Kanto Chemical Co.Ltd , H3BO3(99%) OCI Company Ltd, Ba(Ac)2 (99%), Ammonia solution
(99%) Duksan Pure Chemicals Co.Ltd, NaH2PO4.2H2O (99.9%) Junsei Chemicals Co.Ltd, were used
without further purifications
2.1 Electrode pretreatment
To fabricate the Ba doped PbO2 (Ba/PbO2), Titanium electrode of 1x1 cm2 and Graphite of 1x1
cm2 was used as anode and cathode respectively. The Ti anode was first sandblasted on SiC paper to improve the surface roughness, followed by sonicated in CH3CHO to remove all un dissolved wastes.
Then Ti electrode put into 40 % NaOH and boil at 80°C for 2 h, followed by washed with 15 % hot oxalic acid solution for 1 h until the solution color changed to black brownish, finally the Ti electrode washed in DI water.
2.2 Preparation of Ba doped PbO2 electrode
0.3 M of Pb(NO3)2 mixed with 0.2M of H3BO3 in 50 ml DI water, then Ba(Ac)2 concentration
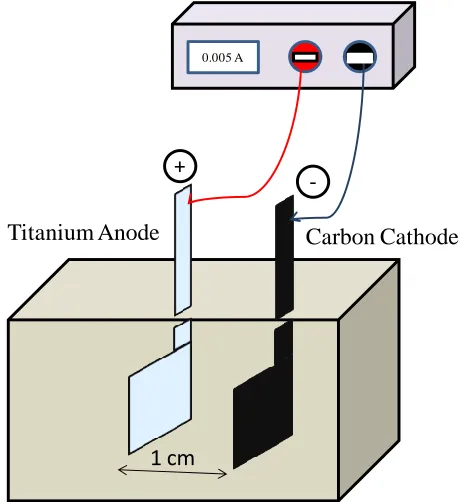
as 2x10⁻¹ M, 2x10⁻³ M, 2x10⁻⁵ M, 2x10⁻⁷ M individually prepared and mixed along with above solution and heat at 65°C to get clear solution. Fig. 1. Depicted The schematic diagram of electrochemical cell, where pretreated Ti electrode was used as anode and carbon as cathode, respectively, and separated by the distance of 1cm, and the electrolysis was carried out by passing current density of 5 mA/cm2 for 10 min. The Thin hard Ba/PbO2 layer was deposited, and washed in DI water and dry at 120°C for 1 h.
Hereafter, Barium ion concentrations will be denoted as Ba10-1/PbO2, Ba10-3/PbO2, Ba10-5/PbO2, Ba 10-7/PbO2.
…...
1 cm
0.005 A
Titanium Anode
+
-Carbon Cathode
[image:3.596.174.406.470.721.2]
2.3 Analysis
The surface composition of as prepared Ba/PbO2 electrode was analyzed by XRD patterns were
obtained from a X’PERT-PRO X-ray diffractometer with Cu Ka radiation (=1.540598 Å). The morphology of the Ba/PbO2 samples was observed by SEM (Zeiss EVO-MA10). Solution phase
ammonia oxidation analysis was performed by FTIR from Thermo scientific Nicolet iS5. The cyclic voltammetry measurements were performed using standard three electrode system connected to the computer control Potentiostat/Galvanostat model Versa STAT 3 from Princeton applied Research. As prepared Ti/Ba/PbO2 was used as working electrode, platinum plate and an Ag/AgCl were used as
counter and reference electrodes, respectively.
3. RESULTS AND DISCUSSION
[image:4.596.123.471.430.681.2]3.1 Surface and interface characterization of Ba/PbO2
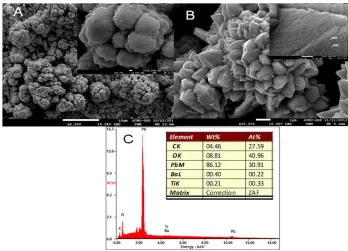
Fig. 2 shows the SEM image of blank PbO2 and the Ba10-1/PbO2 electrode. A cauliflower like
morphology with 13 nm in size (see insert figure), as speculated in Fig. 2a. The uniformity may be due to the use of boric acid medium, which has a tendency to maintain pH that will facilitate to inhibit Pb(OH)2 intermediate formation, which passivate the electrode and inhibit the nucleation and growth
of lead dioxide [30].
Figure 2. SEM images (A) PbO2, (B) Barium doped PbO2, (C) SEM-EDAX data for (B)
Fig. 2b. Shows SEM image of Ba10-1/PbO2 electrode, seems to be sharp edge like flower with
Insert figure shows that tiny particles with 15 nm in size on the each leaf like wings, which may be of Ba nano particles embedded on the PbO2 surface.The presence of barium on the surface was confirmed
by the Fig. 2c. SEM-EDAX with the atomic ratio of 0.22%. In the presence of barium, the PbO2
morphology completely changed from cauliflower to a sharp edge like flower morphology that indicates barium ions influence. Similar, morphological surface is resulted in all ratios of Ba and PbO2.
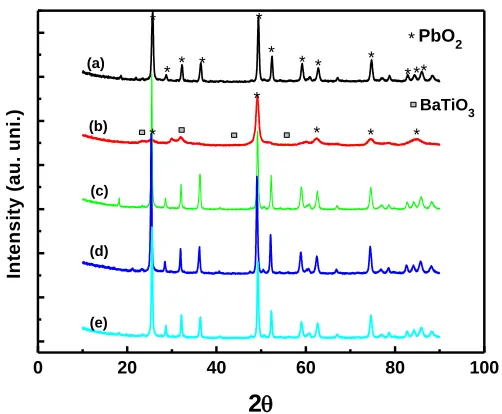
Fig. 3 depicts the XRD of PbO2 and different ratios of Ba/PbO2 electrodes. Fig. 3a.emphasizes
the prepared electrode as β- PbO2 that contains the phases of 110, 101 and 200 clearly correlated with
reported work [31]. When Ba2+ ion introduced into the mixture, the PbO2 phases changes depending
upon the Ba ion concentration. The 0.6:1 concentration ratio of Ba to Pb ion shows BaTiO3 (2 values
at 28, 32 and 55) formation along with PbO2 but its phase intensities have reduced and become
amorphous. Further decreasing concentration of Ba ion the crystalinity of PbO2 increased with absence
of Ba ion in any form (Fig3 c-e). The peak intensity of PbO2 at is maximum at a Ba ion concentration
of 2 x 10⁻⁵ M (Fig. 3d) and the crystalinity retains, but barium peaks at 2 value of 28 (111) [32] shows less intensity. In overall, high concentration of Ba ion makes more BaTiO3 along with PbO2
and lower concentrations makes more crystalline of PbO2 upto 2 x 10⁻⁵ M less concentration of Ba
ion enhanced the PbO2 crystalinity, in other words more nano particles formed.
0 20 40 60 80 100
* * * * * * * * * * * * * * * * * In te n s it y ( a u . u n i. ) 2 (a) (b) (c) (d) (e) * PbO2 BaTiO 3
Figure 3. XRD images of Barium doped PbO2 electrodes at different concentrations: (a) PbO2; (b)
Ba10-1/PbO2; (c) Ba10-3/PbO2; (d) Ba10-5/PbO2; (e) Ba10-7/PbO2.
Fig. 4 delineates the cyclic voltammetry response for the electrodeposited PbO2 and Ba/PbO2
electrodes in 0.1 M PBS (Phosphate buffer solution) solution. A characteristic PbO2 peaks such as Pb2+
to Pb4+ oxidation was observed at 1.8 V in forward scan and the Pb4+ to Pb2+ reduction peak was observed nearly at 0.9 V in the reverse scan (Fig.4 insert). At the same time, the oxidation/reduction peak currents increased, between 400 µA to 14 mA, with decreasing concentration of Ba ion till 2 x 10 -5
[image:5.596.173.424.364.571.2]
crystalinity of PbO2 (Fig. 4d), which is well correlated with XRD results of 2 x 10⁻⁵ M of Ba ion
(Fig.3d), where the phase intensity is higher and more crystalline of PbO2 was observed. Therefore, the
Ba10-5/PbO2 electrode was selected for further application.
Figure 4. Cyclic voltammetry response of PbO2 and Ba/PbO2 electrodes in 0.1M Phosphate buffer
solution: (a) PbO2; (b) Ba10-1/PbO2; (c) Ba10-3/PbO2; (d) Ba10-5/PbO2; (e) Ba10-7/PbO2. Scan
rate= 20 mV/s.
0.0 0.5 1.0 1.5 2.0
0.00 0.04 0.08 0.12 0.16 0.20 0.24 0.28
C
u
rr
e
n
t
(A
)
Potential (V)
(a) (b) (c) (d) (e) (f) (g) (h) (i)
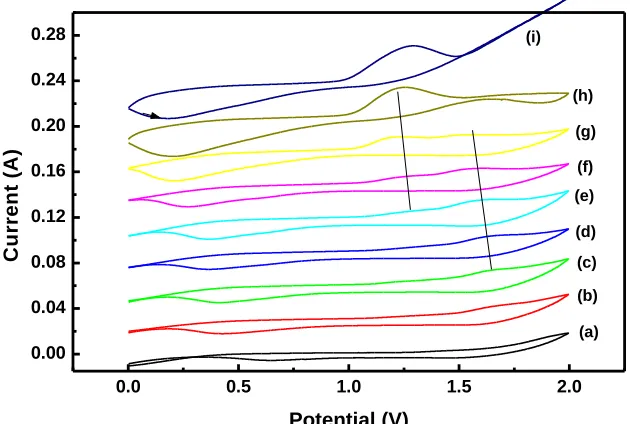
Figure 5. Cyclic voltammntry response of PbO2 and Ba10-5/PbO2 electrodes in different pH adjusted
with NaOH solution: (a) 6.5; (b) 7; (c) 9.4; (d) 10.8; (e) 11.35; (f) 12; (g) 12.35; (h) 12.7. Scan rate is 20 mV/s.
The effect of pH on the Ba10-5/PbO2 electrode was performed in 0.1M Na2SO4 solution at pH of
5.7 in the potential window corresponds to 0.0V to 2.0V (Fig.5 curve a). The pH of electrolyte slowly increased by the addition of the appropriate volume of NaOH and resulted CV are depicted in Fig.5b-i. At pH 5.7 the oxidation peak for Pb2+ to Pb4+ overlaid with oxygen evolution reaction and a reduction peak was existed at 0.66V in reverse scan. The oxidation peak potential is decreasing (move negative) with increasing the pH without an increase in peak current up to the pH of 11.4. There observes an addition hump like peak beyond pH 7, which corresponds to the PbO formation from Pb2+ ion. Similarly the reduction peak just moved towards less positive potential of 0.37 V with increasing the pH. But at pH 11.4 there observed direct oxidation of Pb2+ to Pb4+ (1.2 V) without an PbO intermediate peak and the reduction peak currents increased with shift in negative peak potential. At pH 12.3 there appears a single peak at 1.2 V that is responsible for α-PbO2 with a steep raise in current that is
[image:6.596.140.455.228.440.2]
3.2 Catalytic oxidation of NH3
Fig. 6 depicts the electro catalytic oxidation of NH4OH on the Ba10-5/PbO2 electrode in the
0.01M NaOH solution. There found an oxidation peak at 1.17 V and a reduction peak at 0.27 V in the forward and reverse scan respectively (Fig.6A curve a). The oxidation peak may be related with the PbO32- to PbO2 and vice versa during reduction [25].
0.2 0.4 0.6 0.8 1.0 1.2 1.4 -0.008
-0.004 0.000 0.004 0.008
C
u
rr
e
n
t
(A
)
Potential (V)
(a)
(b) (c) (d) (e)
(f)
(A)
0.4 0.8 1.2 1.6
-0.0008 -0.0004 0.0000
Current (A)
Potential (V)
(a) (b)
(B)
Figure 6 (A). Electrochemical oxidations of NH4OH in 0.01M NaOH solution at Ba10-5/PbO2 electrode
in 0.01 M NaOH solution with different concentration of NH4OH: (a) without NH3; (b) 1 mM;
(c) 2.5 mM; (d) 5 mM; ® 10 mM; (f) 20 mM. Scan rate is 10 mV/s. (B). Electrochemical oxidation of only PbO2 electrode (a) and (b) in presence of 20 mM NH4OH in 0.1 M NaOH
solution at scan rate of 10 mV s-1.
[image:7.596.153.440.181.616.2]
PbO2 oxidation peak at 1.2 V. The pre-peak may be due to the oxidation of NH3 by adsorption on
electrode surface and adduct formation between NH3 and PbO32-, which is typical of CE mechanism
(chemical reaction proceeded electron transfer reaction). The new two reduction peaks at 0.63V and 0.5 V in presence of NH3, which is related to PbO2 to Pb3O4 and PbO2 to Pb2+ [33], concludes
chemical reaction formation and formed Pb2+ during addition of NH3. Note worth here that NH3
oxidation has occurred at similar potential on BDD electrode [34]. But, only PbO2 electrode shows no
such oxidation of NH3 (Fig.6B curve b) confirms the Ba influence in NH3 oxidation. The pre-peak
current increases with increasing concentration of NH3 (Fig. 6A curve c-f) and saturated at 20 mM
NH3, which evidences the oxidation relationship between Pb2+ and NH3 with influence of Ba.
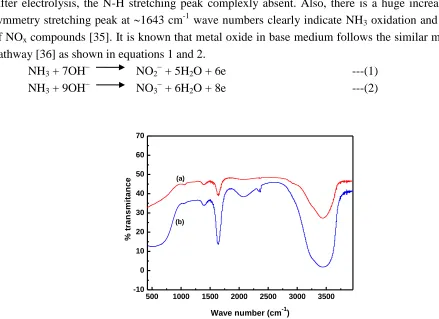
Further, the bulk electrolysis done at Ba10-5/PbO2 electrode in the presence of 20 mM of
NH4OH in 60 Sec and that sample analyzed through FT-IR. The obtained results are presented in Fig.
7. There appears N-H stretching frequency peak at 1043 cm-1 wave numbers in before electrolysis. After electrolysis, the N-H stretching peak complexly absent. Also, there is a huge increase in N-O symmetry stretching peak at 1643 cm-1 wave numbers clearly indicate NH3 oxidation and formation
of NOx compounds [35]. It is known that metal oxide in base medium follows the similar mechanistic
pathway [36] as shown in equations 1 and 2.
NH3 + 7OH NO2 + 5H2O + 6e ---(1)
NH3 + 9OH NO3 + 6H2O + 8e ---(2)
500 1000 1500 2000 2500 3000 3500 -10
0 10 20 30 40 50 60 70
%
t
ra
n
s
m
it
a
n
c
e
Wave number (cm-1)
(a)
[image:8.596.58.497.282.601.2](b)
Figure 7. FT-IR spectra of initial (a) and 60 Sec electrolyzed (b) samples of 20 mM NH4OH in 0.01 M
NaOH solution. Conditions: Fixed potential = 1 V (Ag/AgCl); Electrode = Ba10-5/PbO2 with 1
cm2.
4. CONCLUSIONS
The nano structured Ba doped PbO2 was electrochemically fabricated on Ti electrode with the
5/PbO2) demonstrates nano crystallinity of PbO2, which is confirmed by XRD and cyclic voltammetry.
Further, nano structured Ba10-5/PbO2 electrode effectively oxidizes NH3 at low potential in the NaOH
solution. The results are promising and can be enhanced to real applications. ACKNOWLEDGEMENT
This work was supported by the National Research Foundation of Korea (NRF) funded by the Korea government (MEST) (Grant No. 2014001974).
Reference
1. N. Thuc Phan, K. Hyun Kim, Z. Ho Shon, E. Chan Jeon, K. Jung and N. Jin Kim, Atmos. Environ, 65 (2013) 177-185.
2. M. Vidotti, L.H. Dall, S.I. Cordoba de Torresi, K. Bergamaski and F.C. Nart, Anal. Chim. Acta, 489 (2003) 207-214.
3. B.A. Lopez de Mishima, D. Lescano,T. Molina Holgado and H.T. Mishima, Electrochim. Acta, 43: 395-404.
4. A.C.A. De Vooys, M.T.M. Koper, R.A. Van Santen, and J.A.R. Van Veen, J. Electroanal.Chem., 506 (2001) 127-137.
5. D. Giovanelli, M.C. Buzzeo, N.S. Lawrence, C. Hardacre, K.R. Seddon and R.G. Compton, Talanta, 62 (2004) 904- 911.
6. I. Suárez,G. Bodega and B. Fernández, Neuro.Chem.Int., 41 (2002) 123-142.
7. D. Dirtu, L. Odochian, A. Pui, and I. Humelnicu, Cent. Eur. J. Chem., 4 (2006) 666-673. 8. A.H.White and Wm.Melville, J. Am. Chem. Soc., 27 (1905) 373–386.
9. A.A. Konnov and J. De. Ruyck, Combust.Sci.and Tech., 152 (2000) 23-37.
10.A. Kapałkaa, S. Fierro, Z. Frontistis, A. Katsaounis, S. Neodo, O. Frey, N.de. Rooij, K.M.Udert and C.Comninellis, Electro.Chim.Acta., 56 (2011) 1361–1365.
11.S. Heylen, S. Smet, K.G.M. Laurier, J. Hofkens, M.B.J. Roeffaers and J.A. Martens, Catal. Sci.Technol., 2 (2012) 1802–1805.
12.P.D. Sobczyk, E.J.M. Hensen, A.M.de. Jong and A.S.Van Santen, Top.Catalysis, 23 (2003) 109-117.
13.N.I Il'chenko, Russ.Chem. Rev., 45 (1976) 1119-1134.
14.F. Shao, F.H. Ramirez, J.D. Prades, J.R. Morante and N. Lopez, Proced. Eng, 47 (2012) 293– 297. 15.R.Q. Long and R.T. Yang, Chem.Comm., 17 (2000) 1651-1652.
16.S.J. Juutilainen, P.A. Simell and A.O.I. Krause, Appl. Catal., B, 62 (2006) 86–92.
17.H. Gerischer and A. Mauerer, J. Electroanal. Chem.Interfac.Electrochem., 25 (1970) 421-433. 18.N.L. Michels, A. Kapałka, A.A. Abd-El-Latif , H. Baltruschat and C. Comninellis,
Electro.Commun., 12 (2010) 1199–1202.
19.T.L. Lomocso and E.A. Baranova, Electrochim. Acta, 56 (2011) 8551–8558.
20.Y. Wang, X. Guo, J. Li, Y. Yang, Z. Leiand Zhang, Open J. Appl., 2 (2012) 241-247.
21.R. Cossu, A.M. Polcaro, M.C. Lavagnolo, M. Mascia, S. Palmas and F. Renoldi, Environ. Sci.Technol., 32 (1998) 3570-3573.
22.X. Ma, R. Wang, W. Guo, H. Yang, Z. Liang and C. Fan, Int.J. Electrochem. Sci., 7 (2012)6012-6024.
23.Y.H. Song and L. Jie Ma, Advan.Mater. Res., 743 (2013) 218-222.
24.A. Fernandes, D. Santos, M.J. Pacheco, and L. Ciríaco and A. Lopes, Appl.Catal. B, 148–149 (2014) 288–294.
27.P. Vernoux and X. Li, Appl.Catal. B, 61 (2005) 267–273. 28.H. Karami and A. Yaghoobi, J. Clust.Sci, 21 (2010) 725–737.
29.C. Hamel, T. Brousse, D.B. Elanger and D. Guaya, J. Electrochemical Soc, 159 (2012) A60-A67. 30.K. De Wael, M. De Keersmaecker, M. Dowsett, D. Walker, P.A. Thomas, and A. Adriaens,J.Solid
State Electrochem, 14 (2010) 407-413.
31.Z. Chen, Q.Yu, D. Hui Liao, Z. Cheng Guo and J. Wu , Trans. Nonferrous Met.Soc.China, 23(2013) 1382−1389.
32.V.F. Solovyov, H.J. Wiesmann and M. Suenaga, Supercond. Sci.Technology, 16 (2003) L37-L3. 33.S. He, R. Xu, S. Han, J. Wang, B. Chen, J. Electrochem. Soc., 163 (2016) D265-D270.
34.X. Ji, C.E. Banks and R.G. Compton, Analyst, 130 (2005) 1345–1347.
35.J. Coates. Interpretation of Infrared Spectra, A Practical Approach, R.A. Meyers (Ed.) John Wiley & Sons Ltd, Chichester (2000) 10815–10837.
36.N.J. Bunce and D. Bejan, Electrochim. Acta, 56 (2011) 8085 – 8093.