RESEARCH ARTICLE
Presentation and analysis of a worldwide database for lava dome
collapse events: the Global Archive of Dome Instabilities (GLADIS)
Claire E. Harnett1 &Mark E. Thomas1&Eliza S. Calder2&Susanna K. Ebmeier1&Alison Telford3&William Murphy1& Jurgen Neuberg1
Received: 21 September 2018 / Accepted: 30 January 2019 #The Author(s) 2019
Abstract
Lava dome collapses generate hazardous pyroclastic flows, rockfalls and debris avalanches. Despite advances in understanding lava dome collapses and their resultant products, the conditions that occur prior to collapse are still poorly understood. Here, we introduce the Global Archive of Dome Instabilities (GLADIS), a database that compiles worldwide historical dome collapses and their reported properties, including original dome volume (at the time of collapse), dome morphology, emplacement conditions, precursory activity, dome geometry and deposit characteristics. We determine the collapse magnitude for events where possible, using both absolute deposit volumes and relative collapse volume ratios (this being deposit volume as a proportion of original dome volume). We use statistical analysis to explore whether relationships exist between collapse magnitude and extrusion rate, dome growth style, original dome volume and causal mechanism of collapse. We find that relative collapse magnitude is independent of both the extrusion rate and the original dome volume. Relative collapse volume ratio is dependent on dome growth style, where endogenous growth is found to precede the largest collapses (~ 75% original volume). Collapses that comprise a higher proportion (> 50%) of original dome volume are particularly attributed to both gravitational loading and the development of gas overpressure, whilst collapses comprising a small proportion (< 10%) of original dome volume are associated with the topography surrounding the dome, and variations in extrusion direction. By providing validation and/or source data, we intend these data on various dome growth and collapse events, and their associated mechanisms, to be the focus of future numerical modelling efforts, whilst the identified relationships with relative collapse volume ratios can inform collapse hazard assessment based on observations of a growing dome.
Keywords Lava dome . Collapse . Database . Dome growth . Dome volume . Deposit volume
Introduction
Lava domes and spines form when viscous magma is extruded but is not able to flow far from the volcanic vent (Calder et al. 2015). Instability of lava domes results in pyroclastic flows,
rockfalls and sometimes debris avalanches, all of which can pose a significant hazard to areas surrounding the edifice (Voight2000; Wadge2009). Despite the threat posed by dome collapse, we still know relatively little about the interplay between dome growth conditions and the collapse mecha-nisms of lava domes. A broad variety of mechamecha-nisms, and triggers, have already been identified for individual collapse events. These include gravitational collapse (Ui et al.1999), rainfall (Matthews et al.2002) and gas overpressure (Voight and Elsworth 2000). However, the general conditions that determine which collapse mechanism is dominant are still not clear.
Various modelling strategies have been used to investigate lava dome stability, although many focus on the resultant py-roclastic flows (e.g. Hooper and Mattioli2001; Saucedo et al. 2005; Wadge et al.1998) or initial dome emplacement (e.g. Hale 2008; Hale et al. 2009a,2009b). Perturbation factors Editorial responsibility: J. Dufek
Electronic supplementary materialThe online version of this article (https://doi.org/10.1007/s00445-019-1276-y) contains supplementary material, which is available to authorized users.
* Claire E. Harnett [email protected]
1
School of Earth and Environment, University of Leeds, Leeds, UK 2
School of Geosciences, University of Edinburgh, Edinburgh, UK 3
likely to cause instability have been considered particularly in numerical models, for example calculation of diffusion of gas pressurisation across a dome (Voight and Elsworth2000), limit equilibrium (LE) analysis of slope height/stability rela-tionships (Simmons et al.2005) or a revised LE analysis in-corporating rainfall (Taron et al. 2007). Discrete element models have also been designed to test the impact of external triggers on a dome’s stability, such as development of gas overpressure or variation in extrusion direction (Harnett et al.2018).
Understanding previous dome collapse behaviour is an im-portant tool for helping to develop forecasts for future activity (cf. Ogburn et al.2015; Sheldrake et al.2016; Wolpert et al. 2016). To improve our ability to respond to volcanic crises involving dome extrusion, it is vital for volcanologists, partic-ularly those advising decision makers, to have access to re-cords from previous dome-forming eruptions that have under-gone collapse. If lava dome extrusion begins at a volcano that has not shown dome growth in recorded history, it is important for observatories and the wider volcanological community to have access to a database that details potential trends in be-haviour, by examining historical records from similar volcanic systems. This was the case for Soufrière Hills in Montserrat, where dome growth began in 1995 after ~ 350 years of no extrusion (Branney and Kokelaar2002).
Many previous studies have highlighted the importance of global databases in volcanology (e.g. Crisp1984; Crosweller et al.2012; Donne et al.2010; Ebmeier et al.2018; Geyer and Martí2008; Hédervári1963; Ogburn et al. 2015; Witham 2005; Wright et al.2004). However, only a few studies have focussed particularly on dome-building episodes (DomeHaz) and pyroclastic flows (FlowDat) (Ogburn2012; Ogburn and Calder2017). Of these two databases, theDomeHazdatabase of Ogburn et al. (2012) contains information about dome-forming eruptions and explosions, which has allowed proba-bilistic analysis of eruptions and their link to explosive activity (VEI > 4) (Ogburn et al.2015) as well as analysis of eruption longevity (Wolpert et al.2016). Instead, FlowDat(Ogburn 2012) is a collection of mass flow (e.g., block-and-ash flows, debris avalanches, pumice flows) parameters and mobility metrics, and has been used for probabilistic analysis of metrics such as height/length data and planimetric areas (Ogburn et al. 2016). However, a complete inventory of individual dome collapse events for different volcanoes is not currently incor-porated into existing databases.
From previous literature (Voight2000), it is clear that a single volcano can exhibit various collapse styles associated with different dome growth styles and different eruptive phases, ranging from small-scale persistent rockfalls, to large-scale explosive collapse. This provides the main ratio-nale behind this study, as it is important to assess the nature of each collapse, rather than to attribute a single collapse style to an individual volcano.
In this study we thus collate data about dome collapse events in aGlobalArchive ofDomeInstabilities(GLADIS). Dome collapses present a hazard to surrounding regions (e.g. Genareau et al.2015; Mercado et al.1988; Sato et al.1992) and can influence the behaviour of the remaining dome and future dome growth (Voight and Elsworth2000). We estimate first-order statistics of global trends, focussing primarily on dome growth style, extrusion rate and collapse trigger, with the aim of identifying correlations between these and dome collapse magnitude. We also use one way analysis of variance (ANOVA) to undertake statistical analysis on data currently in GLADIS.We discuss how these results alongside examples of collapse events fromGLADISmay influence our understand-ing of dome collapse processes.
Database design and structure
To analyse the relationships between dome collapse events and their mechanisms, we have compiled an open-access da-tabase that includes 293 individual collapse events from 35 different volcanoes (Table 1). The full flat-file database is accessible by joining the GLADISgroup on VHub (http:// vhub.org/groups/domecollapse). Here, we summarise the
content of GLADIS and report relationships between
collapse properties and pre-collapse conditions. The database was initially designed using the list of dome-forming volca-noes in DomeHaz(Ogburn et al. 2015). Volcanoes that had experienced lava dome collapse were identified and details of those events were compiled. This was achieved using peer-reviewed literature, the Smithsonian Institution Global Volcanism Program (GVP) (Venzke et al.1968to present), the Bulletin of the Global Volcanism Network (https:// volcano.si.edu) andFlowDat. A complete reference list for all entries into the database can be found within GLADIS, and is also provided in Online Resource1.
Dome collapses are included in the database if they (a) have a known source volcano; (b) have a known year of occur-rence; and (c) appear from related literature to be a significant event in the dome growth chronology. The definition of sig-nificant event is relative and largely qualitative due to lack of volume data. Where quantitative data are unavailable, an event is considered significant enough for database inclusion if it is explicitly documented within literature as a collapse, or where there is reference to Merapi-type pyroclastic flows, as these refer specifically to dome collapse products (Bardintzeff 1984).
can be found in Table2, where we also define the way in which observations were parameterised. As shown in Table2, certain database fields are open fields for qualitative or quantitative entries (e.g. human impact, deposit volume), whereas other fields are restricted to the entry of multiple choice and therefore termed closed fields (e.g. dome growth style must have one of the following entries: exogenous, endogenous or combination). These metrics are not exhaus-tive but do allow us to capture the principal characteristics of the well-documented collapses, as well as the fundamental characteristics of those that are more poorly documented. We
note that all data recorded inGLADISare taken directly from
the associated source (Online Resource 1) with no
re-interpretation.
Overview of dome collapse regimes in GLADIS
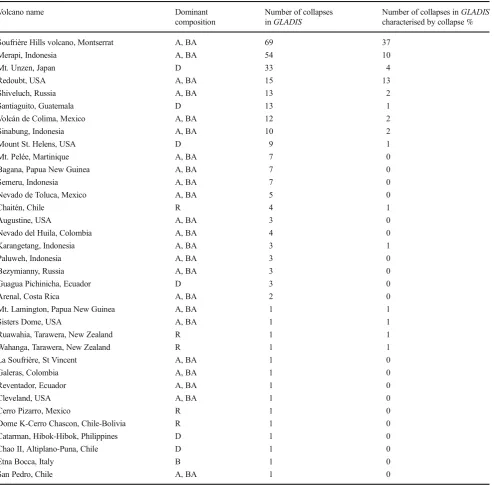
[image:3.595.54.549.78.563.2]The magnitude and frequency of dome collapses, and the longevity of dome growth can vary at a single volcano (Wolpert et al.2016). Previous work has documented phases of dome growth and associated pauses (Ogburn et al.2015; Sheldrake et al.2016). In this study, we add the relationship Table 1 A list of all volcanoes that have domes in the database, alongside their dominant composition (B, basalt; BA, basaltic-andesite; A, andesite; D, dacite; R, rhyolite), the number of collapses and the number of classified collapses inGLADIS
Volcano name Dominant
composition
Number of collapses inGLADIS
Number of collapses inGLADIS characterised by collapse %
Soufrière Hills volcano, Montserrat A, BA 69 37
Merapi, Indonesia A, BA 54 10
Mt. Unzen, Japan D 33 4
Redoubt, USA A, BA 15 13
Shiveluch, Russia A, BA 13 2
Santiaguito, Guatemala D 13 1
Volcán de Colima, Mexico A, BA 12 2
Sinabung, Indonesia A, BA 10 2
Mount St. Helens, USA D 9 1
Mt. Pelée, Martinique A, BA 7 0
Bagana, Papua New Guinea A, BA 7 0
Semeru, Indonesia A, BA 7 0
Nevado de Toluca, Mexico A, BA 5 0
Chaitén, Chile R 4 1
Augustine, USA A, BA 3 0
Nevado del Huila, Colombia A, BA 4 0
Karangetang, Indonesia A, BA 3 1
Paluweh, Indonesia A, BA 3 0
Bezymianny, Russia A, BA 3 0
Guagua Pichinicha, Ecuador D 3 0
Arenal, Costa Rica A, BA 2 0
Mt. Lamington, Papua New Guinea A, BA 1 1
Sisters Dome, USA A, BA 1 1
Ruawahia, Tarawera, New Zealand R 1 1
Wahanga, Tarawera, New Zealand R 1 1
La Soufrière, St Vincent A, BA 1 0
Galeras, Colombia A, BA 1 0
Reventador, Ecuador A, BA 1 0
Cleveland, USA A, BA 1 0
Cerro Pizarro, Mexico R 1 0
Dome K-Cerro Chascon, Chile-Bolivia R 1 0
Catarman, Hibok-Hibok, Philippines D 1 0
Chao II, Altiplano-Puna, Chile D 1 0
Etna Bocca, Italy B 1 0
between periods of dome growth and frequency of dome collapse (Figs.2). Using the behaviour shown in Fig.2, we
[image:4.595.61.538.67.644.2]consider the long-term pattern of collapse activity at dome-building volcanoes.
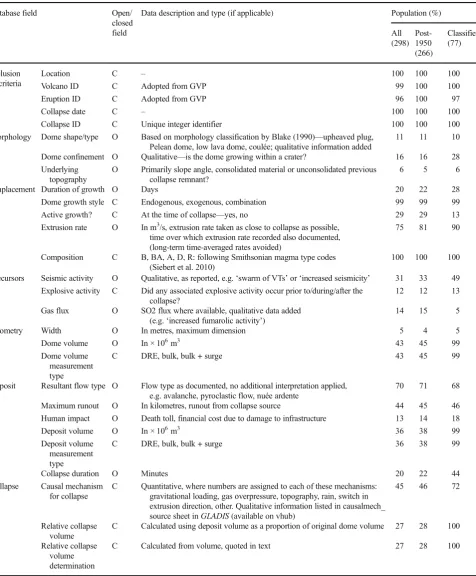
Table 2 Degree of data completeness and description of data type
Database field Open/ closed field
Data description and type (if applicable) Population (%)
All (298)
Post-1950 (266)
Classified (77)
Inclusion criteria
Location C – 100 100 100
Volcano ID C Adopted from GVP 99 100 100
Eruption ID C Adopted from GVP 96 100 97
Collapse date C – 100 100 100
Collapse ID C Unique integer identifier 100 100 100
Morphology Dome shape/type O Based on morphology classification by Blake (1990)—upheaved plug, Pelean dome, low lava dome, coulée; qualitative information added
11 11 10
Dome confinement O Qualitative—is the dome growing within a crater? 16 16 28 Underlying
topography
O Primarily slope angle, consolidated material or unconsolidated previous collapse remnant?
6 5 6
Emplacement Duration of growth O Days 20 22 28
Dome growth style C Endogenous, exogenous, combination 99 99 99 Active growth? C At the time of collapse—yes, no 29 29 13 Extrusion rate O In m3/s, extrusion rate taken as close to collapse as possible,
time over which extrusion rate recorded also documented, (long-term time-averaged rates avoided)
75 81 90
Composition C B, BA, A, D, R: following Smithsonian magma type codes (Siebert et al. 2010)
100 100 100
Precursors Seismic activity O Qualitative, as reported, e.g.‘swarm of VTs’or‘increased seismicity’ 31 33 49 Explosive activity C Did any associated explosive activity occur prior to/during/after the
collapse?
12 12 13
Gas flux O SO2 flux where available, qualitative data added (e.g.‘increased fumarolic activity’)
14 15 5
Geometry Width O In metres, maximum dimension 5 4 5
Dome volume O In × 106m3 43 45 99
Dome volume measurement type
C DRE, bulk, bulk + surge 43 45 99
Deposit Resultant flow type O Flow type as documented, no additional interpretation applied, e.g. avalanche, pyroclastic flow, nuée ardente
70 71 68
Maximum runout O In kilometres, runout from collapse source 44 45 46 Human impact O Death toll, financial cost due to damage to infrastructure 13 14 18
Deposit volume O In × 106m3 36 38 99
Deposit volume measurement type
C DRE, bulk, bulk + surge 36 38 99
Collapse duration O Minutes 20 22 44
Collapse Causal mechanism for collapse
C Quantitative, where numbers are assigned to each of these mechanisms: gravitational loading, gas overpressure, topography, rain, switch in extrusion direction, other. Qualitative information listed in causalmech_ source sheet inGLADIS(available on vhub)
45 46 72
Relative collapse volume
C Calculated using deposit volume as a proportion of original dome volume 27 28 100
Relative collapse volume determination
C Calculated from volume, quoted in text 27 28 100
Sheldrake et al. (2016) identify patterns in volcanic behav-iour, defining two distinct eruptive regimes: (1) episodic ac-tivity, where duration of repose intervals exceeds the eruption duration; and (2) persistent activity, where the duration of the
eruptive phases and reposes are comparable. We examine col-lapse activity in a similar way by showing the colcol-lapses at a volcano, binned in number of collapses per year, alongside periods of extrusion (Fig. 2). We identify three regimes of collapse activity: (1) frequent activity, where collapses are persistently seen during extrusion (for example at Merapi, Indonesia); (2) infrequent activity, where the duration of ex-trusion without collapse exceeds the duration of exex-trusion with collapse (for example at Bezymianny, Russia); and (3) time-declining activity, where the number of collapses per year decreases through time (for example at Soufrière Hills volcano, Montserrat). From this dataset, we are unable to de-termine if these regimes of collapse activity are mutually ex-clusive, and hence suggest that time-declining activity could be considered a possible sub-regime of both frequent and in-frequent collapse styles. We note that small collapses (e.g. constant rockfalls) may not be accurately represented here, due to underreporting and observation bias towards larger events. We therefore expect an underestimation of total vol-ume of material shed.
Data completeness and bias
Investigations of global catalogues of explosive eruptions have demonstrated that under-recording of events becomes more significant with increasing time from present, and de-creasing eruption magnitude (Furlan 2010; Brown et al. 2014). We assume such a bias also exists within our dataset; this bias is also highly location dependent, and depends on the level of monitoring in place at a volcano. There is no cut-off before which collapse events are excluded from the database, Fig. 2 Binary plots following Sheldrake et al. (2016) indicating whether
dome growth was recorded in each year since 1900 using primarily the GVP (Venzke et al.1968to present) at 15 of the most well-documented dome-forming volcanoes inGLADIS. Extrusion periods are overlain with collapse frequency, in terms of number of individual collapse events (identified byGLADIS) per year, where a full bar indicates 10 collapses per year. There are five instances where more than 10 collapses per year occurred: RED 1990 (15), UNZ 1992 (11), SHV 1996 (13), 1997 (19) and 1998 (11). Labels as follows: SIN—Sinabung, Indonesia; BAG— Bagana, Papua New Guinea; CHA—Chaitén, Mexico; AUG— Augustine, USA; RED—Redoubt, USA; BEZ—Bezymianny, Russia; SHI—Shiveluch, Russia; HEL—Mt. St. Helens, USA; PEL—Pelée, Martinique; SAN—Santiaguito, Guatemala; MER—Merapi, Indonesia; COL—Volcán de Colima, Mexico; UNZ—Mt. Unzen, Japan; and SHV—Soufrière Hills volcano, Montserrat
[image:5.595.162.544.51.320.2] [image:5.595.53.289.386.561.2]although we expect there may be a problem of under-recording prior to about 1950. In Fig.2, we plot collapse events since 1900 from volcanoes where dome collapses are common. For example, Merapi exhibits persistent collapse behaviour and if we make the assumption that this is not time dependent, it is likely there are more collapse events before 1950 than those that have been observed and recorded in GLADIS. We note that the 28 events (< 10% of database events) from before 1950 contribute very little to the global event catalogue (< 1% of overall data population).
We define data population here as the number of possible fields that are filled as a proportion of all possible database fields. Overall, for 28 parameters and 293 events, there is a possible 8204 entries; 4514 are populated giving an overall data population of 55%. This is a general degree of population (i.e. this considers all database fields equally) and individual events or parameters (e.g. composition) have a higher degree of population than others (e.g. collapse mechanism). In Table2, population percentage is shown per database field for the whole dataset, the post-1950 dataset and the dataset for which collapse volume as a percentage of dome volume is known, here called the classified dataset. An empty database field does not necessarily mean lack of activity, e.g. if the field <seismic activity> is not recorded in the database, it simply shows that no data are documented inGLADIS, rather than that no seismic activity occurred.
We expect that observatory reporting culture and capacity will influence data availability. For example, Soufrière Hills volcano is one of 35 volcanoes for which we have dome collapse information, but populates 27% of the database, due to quality of recording during the intensely studied 1995– 2010 eruption. Of the 78 events where volume information is available, 37 are from SHV. Our analysis is therefore likely to be skewed towards the events from Montserrat, but as more data are added toGLADISin years to come, the impact of its current dominance is likely to decrease.
Extrusion rate is another parameter affected by recording in the database. Extrusion rates are taken from the original liter-ature, and we do not recalculate rates within this study. This data field is however subject to variations in the time period over which the extrusion rate is recorded (ranging from daily estimates from the day of collapse, to rates averaged over the whole eruptive period). Where possible, daily estimates of extrusion rate are used for the statistical analysis within this study, although often only time-averaged rates are available. All available data are used for the statistical analysis, but this likely introduces bias to the results and alludes to the impor-tance of shorter term flux estimates at growing domes.
Metastable domes
GLADISalso includes data on domes that were emplaced and remain stable at the time of reporting. It is difficult to define
what constitutes a stable dome over time, and so we define these here as metastable domes, as weathering and alteration over time could still result in instabilities (Ball et al.2013). In order to be included in the database, these must be domes that (a) have a citable source of information and (b) have not been completely destroyed by large explosive eruptions or col-lapses. Unlike the portion of the database recording collapse events, the metastable domes are not required to have a known emplacement date to be included in the database. We record available composition data for 90% of the metastable domes (references for which can be found inGLADIS). Of the domes with known composition, 37% (n= 31) are basaltic-andesite to andesite, 35% (n= 29) dacite and 28% (n= 23) rhyolite.
We include these domes inGLADISfor completeness be-cause structures that have remained stable over a long time could eventually collapse and therefore potentially provide insight into dome collapse processes. However, analysis of these domes is not considered further in this study due to the relative paucity of related data in the associated literature. We note also that if a dome has remained stable for a long period of time (on the order of hundreds of years), the documentation of a later collapse may be reported in the context of landsides or debris avalanches, rather than explicitly named as a dome collapse. If we consider all database fields, only 18% of the metastable dome portion of the database is populated, making any in-depth analysis very difficult.
Database terminology
Defining collapse
most common deposit type inGLADIS, ranging in volume from 104m3to 300 × 106m3.
Collapses at Soufrière Hills volcano have been quantified and differentiated using the terms large (1–4 × 10⁶m3) and major (> 4 × 10⁶m3) by Calder et al. (2002). This is a useful classification at an individual volcano, where successive domes and collapses tend to be of similar magnitudes. A def-inition based on an absolute volume for one volcano is how-ever not necessarily effective and does not facilitate compar-ison on a global scale where initial dome volumes range over two orders of magnitude.
Therefore, we present a global dome collapse analysis and examine relationships between observed variables and absolute collapse volume (ΔV) and relative collapse volume ratio (ΔV/V, volume of material shed during a collapse event, expressed as a percentage of original pre-collapse dome vol-ume,V). We consider it likely that collapse mechanisms and processes are related to proportion of dome removal rather than absolute dome or collapse volumes, and so using relative col-lapse volume ratios facilitates comparison of the global dataset. One challenge in this study is that absolute collapse vol-umes are not routinely estimated within the literature. Deposit volumes are more commonly reported and relate directly to the collapse volume (Siebert1984). We therefore use deposit volume as a proxy for collapse volume. Reported volumes are often a combination of both dense rock equivalent (DRE) and bulk volumes. Where available, we record both inGLADIS and specify the measurement type for each volume entry. When calculating relative collapse volume ratio, we use two of the same measurement types (e.g. both deposit and original dome volume are DRE, or both are bulk); the measurement
types in each case are shown in Fig.3. To maximise the sam-ple size for statistical analysis, we assume in this study that these different volume measurements are comparable. Where relative collapse volume ratio is explicitly reported within the associated literature, we directly take this value and do not recalculate a percentage.
Defining attributed collapse mechanisms
One database field we focus on in this study is that of <causal mechanism> (Fig. 1). We define causal mechanisms to be processes that occur to change the equilibrium state of the dome and therefore lead to collapse. Causal mechanisms are defined as processes associated with the growth of the dome, e.g. the generation of gas overpressure within the dome (Voight and Elsworth2000). Instead, we define a triggering mechanism as an external event where the consequence of the event is a change in dome stability, e.g. intense rainfall (Taron et al.2007). Although the nuance of each term is different, both causes and triggers are treated equally as collapse-driving mechanisms in the remainder of this work.
For the purpose of quantitative data analysis,GLADIS cur-rently lists one dominant mechanism for each event based on the conditions and causes for collapse as reported in the asso-ciated literature. We recognise that in the majority of cases, multiple processes may be at work and therefore also list full descriptions of mechanisms attributed to each collapse event as qualitative information withinGLADIS. This information is stored in the <mechanism source> field of the database, where quotations are given from relevant literature to show determi-nation of the dominant collapse mechanism. We also
Fig. 3 aOriginal dome volume versus deposit volume, shown by type of volume measurement (bulk—triangle, DRE—square, combination of both—diamond). All red markers are collapses at Soufrière Hills volcano. See Fig.2for volcano labelling, with the addition of KAR
[image:7.595.232.544.458.710.2]acknowledge that characterisation of only the dominant mech-anism may create bias in analysis of collapse mechmech-anisms, but this limitation comes from the primary literature, rather than re-interpretation in this study.
InterrogatingGLADISallows us to identify the most com-monly cited mechanisms attributed to collapse. We show the number (n) of occurrences in each case, and we find these mechanisms to be:
(i) Gravitational loading(n= 57)—this focuses on addition of material, through continued extrusion, to the dome system. Where possible, volume and height are recorded as quantitative information in the database. High extru-sion rates are not essential for incluextru-sion in this category. We include here over-steepening (i.e. dome flank angle) due to endogenous (Swanson et al.1987) or exogenous (Ui et al.1999) growth.
(ii) Internal gas overpressures(n= 19) have been implicated in collapses after observations of explosive eruptions following major dome collapses (Young et al.1998). Overpressures exist within gas bubbles and lead to dome expansion. Pressurised gas trapped within the dome can weaken the bulk strength of the lava, leading to a de-crease in overall dome stability (Voight and Elsworth 2000). This includes collapses where dome removal is cited in association with explosive activity.
(iii) Topography-controlled(n= 15) collapses, defined here as collapses that occur when the size of a dome exceeds the crater size and overtops the crater walls, likely due to dome and/or crater morphology (Voight et al.2002). This includes perched domes where the dome is emplaced onto a slope and the collapse is attributed to the effect of the slope itself.
(iv) Intense rainfall(n= 14) has been attributed to several collapses as a triggering mechanism, with varying phys-ical models associated. Rainwater can contribute to ero-sion of the slope toe, leading to undercutting and dome destabilisation (Carn et al.2004). Percolation of rainwa-ter into a dome through fracture networks and inrainwa-terac- interac-tion of rainwater with hot gases may create steam that pressurises existing potential failure surfaces (Matthews and Barclay2004; Taron et al.2007). We also consider the influence on local stresses within the dome by rainfall-induced thermal contraction (Simmons et al. 2004; Yamasato et al.1998).
(v) A switch in extrusion direction(n= 5) is commonly ob-served immediately before collapse (e.g. Loughlin et al. 2010; Luckett et al.2008; Stinton et al.2014a). This is most likely attributed to thrust forces associated with emergence of a new lobe on older, cooled dome material where the new material is able to exert a force onto the adjacent older material (Calder et al. 2015), leading to collapse.
We note that some of these collapse mechanisms depend on the same fundamental physical processes. For example, col-lapses defined here as topography-controlled colcol-lapses are ultimately gravitational in nature. To be categorised as topography-controlled in the database, they must be collapse events that are dependent on the topography, e.g. growing within a crater, and therefore would not have collapsed grav-itationally if they had been emplaced onto a horizontal surface.
Less common mechanisms listed in the database include:
(i) seismically induced collapses triggered either by regional earthquakes or by large volcano-tectonic earthquakes (Charbonnier and Gertisser2008; Platz et al.2012);
(ii) slumping/deflation leading to undercutting (Herd et al. 2005);
(iii) weakening caused by weathering, hydrothermal activity or erosion (Ball et al.2013,2015; Boudon et al.1998).
In the following sections, these mechanisms are grouped into a category called‘other’within the field <causal mecha-nism>, as they are cited in only 11% of cases with listed mechanisms.
Statistical analysis of the database
GLADIScontains information about 293 individual collapses from 35 different volcanoes. We find evidence for statistical dependence of absolute collapse volume on collapse mecha-nism, and of relative collapse volume ratio on both dome growth style and collapse mechanism. We show that the larg-est (≥50%) relative collapse volume ratios occur when col-lapses are attributed to gas overpressures or gravitational load-ing. Instead, small (< 10%) relative collapse volume ratios occur in topography-controlled collapses or those attributed to a switch in extrusion direction. We find no correlation or statistical dependence between the following parameters: ab-solute collapse volume and extrusion rate (albeit on varied timescales, as defined within GLADISand discussed later); relative collapse volume ratio and extrusion rate, absolute col-lapse volume and dome growth style, colcol-lapse mechanism and original dome volume.
Overview of data within GLADIS
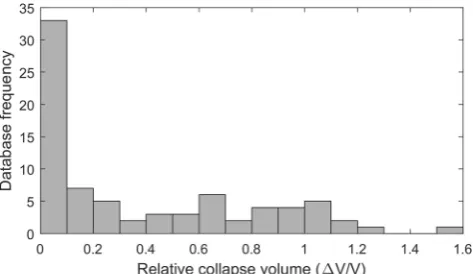
available for 27% of events in the database (n= 78), and we focus on these events in the majority of our analysis as the collapse magnitude (absolute and relative) is one of the pa-rameters that would be most useful to forecast for the purpose of hazard assessment. The overall spread of relative collapse volume ratios withinGLADISare shown in Fig.4.
Of the 78 events inGLADISwhere relative collapse vol-ume ratio can be calculated, 48% (n= 35) of events are col-lapses of < 10% of original dome volume. There are four collapses inGLADISwhere the relative collapse volume ratio exceeds 100%: Merapi (Indonesia), 15 June 1984; Redoubt (USA), 14 March 1990; Soufrière Hills volcano (Montserrat), 20 May 2006; and Volcán de Colima (Mexico), 10 July 2015 (Fig.4).
For the events at Colima and Merapi, it is likely that the percentage falsely exceeds 100% due to the time resolution of the original dome volume calculations. For example, the col-lapse at Colima on 10 July 2015 was after the final dome volume measurement, and so original dome volume is extrap-olated from the data reported in Thiele et al. (2017). We as-sume that both Merapi and Colima collapses removed signif-icant dome portions, and so these are approximated as 100% collapses in all quantitative analysis. The 14 March 1990 Redoubt event had a deposit volume of 3.5 × 10⁶m3, and an original dome volume of 1–5 × 10⁶m3. For the purpose of quantitative analysis, we assume a volume of 3 × 10⁶m3, which results in a relative collapse volume ratio exceeding 100%. The dataset for the Montserrat 2006 event has the highest time resolution, and likely the most reliable volume calculations of these four events due to close monitoring of this eruption. We suggest therefore that the 114% collapse stems from entrainment of material during the pyroclastic flow process so as to bulk up the volume (Siebert1984; Bernard et al. 2014) but truly represents complete dome collapse. Thus, for cases where addition of material to the deposit vol-ume through entrainment of non-dome material can cause the collapse percentage to exceed 100%, we assume that 100% of the original dome volume has contributed to the collapse. Despite the uncertainties, we can thus be confident in each
case that these are large events that involve complete dome removal. Therefore, for all calculations within this study, events for which the collapse percentage exceeds 100% are considered as having a relative collapse volume ratio of one (or 100%).
Method of statistical analysis
We use statistical tests to examine the relationship between collapse magnitude and observed parameters: extrusion rate, collapse mechanism and dome growth style. Collapse magni-tude here refers both to absolute collapse volume (ΔV) and relative collapse volume ratio (ΔV/V). Extrusion rate is an example of a continuous variable (i.e. one where any value is possible) and we analyse this using a regression line, where goodness of fit is expressed as anR2value. Dome growth style and causal mechanism are both categorical variables (i.e. where only certain values are possible), and for these we use one-way analysis of variance (ANOVA) to determine if they are statistically correlated with collapse magnitude.
ANOVA is a technique used to test if there is statistical dependence between groups, by accepting or rejecting a null
hypothesis. By using ANOVA, we determine an F value
which can be summarised as the variation between sample means, divided by variation within the samples. A criticalF value (Fcrit) is identified from the degrees of freedom in the test, and if the calculatedFvalue exceedsFcrit, we conclude a dependent relationship exists between the two variables. A measure of statistical significance (apvalue) is also obtained from an ANOVA test, whereby this value is compared to a given significance level (generallyα= 0.05). The null hypoth-esis is accepted (i.e. statistical independence) if the calculated pvalue falls below the chosenαvalue.
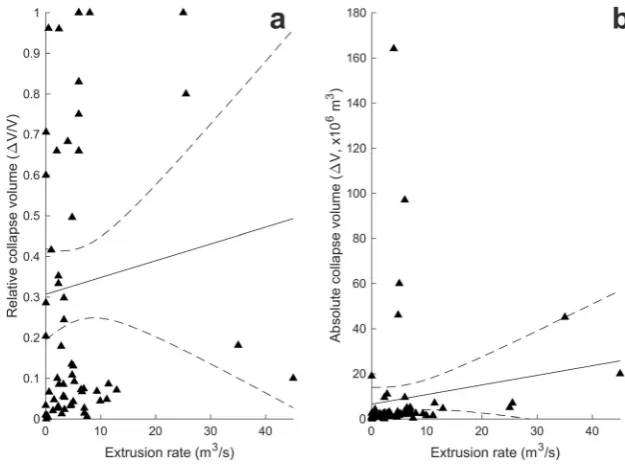
Correlation between extrusion rate and collapse
magnitude
We first test whether collapse size can be associated with extrusion rate prior to collapse. This analysis is carried out using collapse events where values are contained inGLADIS for original dome volume (V), collapse volume (ΔV) and ex-trusion rate. All three data fields are populated for 23% of the database (n= 68).
We examine the relationship first between relative collapse volume ratio (ΔV/V) and extrusion rate (Fig. 5a), and then between absolute collapse volume (ΔV) and extrusion rate (Fig.5b), showing a regression line and 95% confidence in-tervals in both cases. We find very low R2values for the correlation between extrusion rate and relative collapse vol-ume ratio (R2< 0.10) and absolute collapse volume (R2< 0.13). This shows that there is no apparent correlation between extrusion rate and collapse volume; however, we note that this Fig. 4 Histogram showing the distribution of relative collapse volume
[image:9.595.52.289.553.690.2]analysis is significantly affected by the variation in time win-dows, over which the extrusion is recorded.
Correlation between dome growth style and collapse
magnitude
To test the relationship between collapse size and dome growth style, we use the entries inGLADISwhere there are data for original dome volume (V), collapse volume (ΔV) and dome growth style. All three data fields are populated for 25% (n= 72) of database entries (Fig.6).
We first propose a null hypothesis that collapse size is independent of dome growth style. Dome growth is a categor-ical variable withinGLADISand can be (1) exogenous, where
magma can reach the surface and extrude as new lobes or spines; (2) endogenous, where new magma is intruded into the base of the dome causing inflation; or (3) combination, where pulses of both exogenous and endogenous growth are observed. We test whether relative collapse volume ratio (ΔV/V) varies according to dome growth style and find anF value of 14.1, which means we can reject the null hypothesis (Fcrit= 3.1,p= 7.5 × 10⁻⁶). This suggests a significant effect of dome growth style on relative collapse volume ratio at a significance level of α= 0.05. The average relative collapse volume ratio for this dataset (wheren= 72) is 0.34, and the average relative collapse volume ratios for each dome growth group are shown in Table 3. The most significant deviation from this mean is for domes that grow endogenously, where the averageΔV/Vis 0.76. We can confirm this significance with a post hoc analysis using the Bonferroni procedure where we determine that the most statistically significant difference inΔV/V between the groups shown in Table 3 is between exogenous and endogenous growth (withp= 5 × 10⁻⁵). Of the 13 endogenous domes with available volume data, 12 of these are domes from the 1989–90 eruption of Redoubt. It therefore seems likely that our analysis is heavily biased by the data from Redoubt and so the conclusion that relative collapse volume ratio is dependent on dome growth style may not be reliable on a global scale.
We also test the null hypothesis that absolute collapse vol-ume (ΔV) is independent of dome growth style. We find anF value of 1.9 (Fcrit= 3.1,p= 0.16), demonstrating statistical independence. This suggests an insignificant effect of dome growth style on absolute collapse volume, and that growth style has greater effect on proportion of collapse, rather than absolute volume. Average absolute collapse volumes for each dome growth group are given in Table3.
Fig. 5 Extrusion rate anda relative collapse volume ratio, andbabsolute collapse volume. Solid line shows line of best fit, and dashed lines show 95% confidence intervals
[image:10.595.229.542.52.284.2] [image:10.595.52.289.496.672.2]Correlation between collapse mechanism
and collapse magnitude
To test the relationship between collapse magnitude and caus-al mechanism, we use the entries inGLADISwhere we have values for original dome volume (V), collapse volume (ΔV) and causal mechanism. All three of these data fields are pop-ulated in 18% of events (n= 54). We test the null hypothesis that collapse triggers are independent of original dome vol-ume. This test gives anFvalue of 0.4 (Fcrit= 2.4,p= 0.84), so we accept the null hypothesis and conclude that original dome size does not have a major impact on the causal mechanism of collapse.
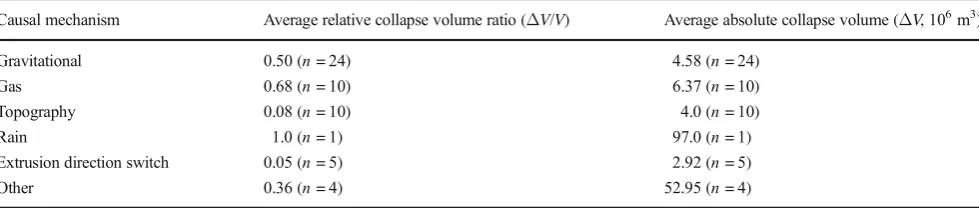
We next propose the null hypothesis that relative collapse volume ratio (ΔV/V) is independent of the causal mechanism for collapse. We find anF value of 5.6 (Fcrit= 2.4, p= 4 × 10⁻⁴), therefore we reject the null hypothesis and show statistical dependence. This indicates a significant effect of causal mechanism on collapse proportion. The average rela-tive collapse volume ratios for each causal mechanism are shown in Table4.
We again use a Bonferroni post hoc analysis to find the most significant statistical difference. To do this, we add the one event with a causal mechanism of rain to the other cate-gory, as the Bonferroni analysis requires more than one event per group. We find the largest statistical significance lies be-tween causal mechanisms of gravitational loading and topog-raphy (p= 9 × 10⁻³). The average relative collapse volume ratio (ΔV/V) for this dataset (n= 54) is 0.41, so we can see that both gravitational loading and topography are outside of this group average. This suggests that collapses caused by
topography or a switch in extrusion direction involve, on av-erage, small (~ 10%) proportions of original dome volume, whereas collapses caused by gravitational loading on average involve more substantial (~ 50%) dome volume fractions. Bonferroni analysis also shows that there is a large statistical significance (p= 4 × 10⁻³) between the resultantΔV/Vvalues for collapses caused by gas pressurisation and those caused by a switch in extrusion direction, with averageΔV/Vvalues at 0.68 and 0.05, respectively. The collapse mechanism that leads to the largest relative volume collapses is gas pressurisation and rainfall interaction, showing that pore fluid pressure plays an important role in dome stability.
We follow up this result by testing the null hypothesis that absolute collapse volume (ΔV) is independent of collapse mechanism. We find anFvalue of 7.8 (Fcrit= 2.4,p= 1.9 × 10⁻⁵), showing statistical dependence. This shows a very sig-nificant effect of causal mechanism on absolute collapse vol-ume, and average absolute volumes for each causal mecha-nism are given in Table4.
[image:11.595.47.546.81.147.2]The 23 cases of gravitational loading as a causal mecha-nism are spread across eight volcanoes (Soufrière Hills, Unzen, Mt. St. Helens, Merapi, Redoubt, Chaitén, Santiaguito and Colima) so we can be confident that these results are not skewed by the prevalence of Soufrière Hills and Redoubt data within the database. However, the data for both switch in extrusion direction and topographic collapse come wholly from Soufrière Hills. This is due to the quality and frequency of observations during this eruption, particular-ly when considering that the definitive parameters can be hard to detect in real time (especially those that can be more subtle such as switch in extrusion direction). Although not
Table 4 Average relative collapse (ΔV/V) and absolute collapse volume (ΔV) for the following causal mechanisms: gravitational, rain, gas overpressures, switch in extrusion direction, topography, other
Causal mechanism Average relative collapse volume ratio (ΔV/V) Average absolute collapse volume (ΔV, 106m3)
Gravitational 0.50 (n= 24) 4.58 (n= 24)
Gas 0.68 (n= 10) 6.37 (n= 10)
Topography 0.08 (n= 10) 4.0 (n= 10)
Rain 1.0 (n= 1) 97.0 (n= 1)
Extrusion direction switch 0.05 (n= 5) 2.92 (n= 5)
Other 0.36 (n= 4) 52.95 (n= 4)
[image:11.595.53.543.597.701.2]Number in brackets is the number (n) of entries considered for each mean calculation
Table 3 Average relative collapse (ΔV/V) and absolute collapse volume (ΔV) for groups of exogenous, endogenous and combination dome growth styles
Dome growth style Average relative collapse volume ratio (ΔV/V) Average absolute collapse volume (ΔV, 106m3)
Exogenous 0.24 (n= 45) 10.60 (n= 45)
Endogenous 0.76 (n= 13) 2.92 (n= 13)
Combination 0.27 (n= 14) 30.36 (n= 14)
considered here due to availability of volume data, these col-lapse mechanisms have been observed elsewhere, for example extrusion direction at Mt. St. Helens (Vallance et al.2008) and topography-controlled collapse at Volcán de Colima (Hutchison et al.2013). Therefore, we suggest this result is still globally applicable.
This analysis does not consider instances when the mech-anism has been observed but hasnotbeen followed by col-lapse, and therefore, these statistics are relevant onlygiventhat a collapse has taken place. This, though, allows us to predict that if gravitational loading and change in extrusion direction were to cause collapses, an event triggered by loading is likely to be larger. From the group average (n= 293,ΔV/V= 0.37), there is some suggestion that the subset for which causal mechanism is known is slightly biased towards higher values of relative collapse volume ratio. This could be a reporting bias as causal mechanisms are more commonly observed/ reported for collapses that remove a more noticeable portion of the dome.
This analysis does not consider collapses with an interpreted causal mechanism but where volume information has not been reported (n= 77). Of these 131 (54 with volume data, 77 without) events with listed causal mechanisms, 43% (n= 56) are gravitational, 11% (n= 14) are rainfall related, 20% (n= 26) are attributed to gas overpressures or explosive behaviour, 4% (n= 5) to a switch in extrusion direction, 12% (n= 16) to topography and 11% (n= 14) to various other causes (e.g. weathering, earthquakes or collapse of a crater wall). This suggests that rainfall is particularly underrepresent-ed in the dataset with available volume data (n= 1 with vol-ume data,n= 14 in whole database).
Discussion and implications
Database uncertainties and reporting bias
We find that relative collapse volume ratio shows a statistical-ly significant dependence on both the reported causal mecha-nisms, and dome growth styles. These parameters are not al-ways routinely recorded and depend largely on independent observatory culture and also the observation opportunity dur-ing an eruption. We suggest therefore that for this type of study looking at forecasting dome collapse, the most impor-tant observations to be recorded during dome-forming erup-tions that would aid further global statistical analysis are (a) original dome volume; (b) collapse volume (calculated from the missing dome volume where possible); (c) dome growth style and (d) cause of collapse.
An ideal analysis would be one where these mechanisms are recorded both when they exist as precursors to collapse andwhen they exist during baseline activity of volcanic unrest at dome-forming volcanoes. This would allow a more
probabilistic analysis of conditions leading to dome collapse, and will be enabled by increases in the frequency of satellite measurements of deformation, topography and dome surface changes (e.g. Arnold et al.2016; Ebmeier et al.2018; Walter et al.2019; Wang et al.2015) as well as technical advances in field methods such as Structure from Motion and terrestrial laser scanning (de Zeeuw-van Dalfsen et al.2017; James and Varley2012; Thiele et al.2017).
The largest data uncertainties inGLADISarise from origi-nal dome volume estimates at Redoubt. Following the de-struction of the February 1990 dome, 11 domes were emplaced and destroyed, all of which have individual volume estimates between 1 and 5 × 10⁶m3(Miller1994). For all analyses so far in this study, we follow the example of Miller (1994) and take an arbitrary average of 3 × 10⁶m3, however this inevitably introduces an uncertainty to collapse volume calculations at Redoubt, and therefore our ANOVA tests throughout.
To test the effect of this uncertainty on our results, we retest independence of collapse volume and causal mechanism/ dome growth style (Table5) using the range of original dome volumes, and present this alongside the original analysis using a dome volume of 3 × 10⁶m3. The reality is likely that some domes at Redoubt were nearer to 1 × 10⁶m3, and some nearer to 5 × 10⁶m3in original volume. We assume each extreme and run ANOVA with all 11 original volumes at 1 × 10⁶m3 and then all 11 original dome volumes at 5 × 10⁶m3.
[image:12.595.306.545.597.682.2]We retest the null hypothesis that causal mechanism and relative collapse volume ratio are independent, using a range of original dome volumes at Redoubt (and maintaining the condition that any event with aΔV/V> 1 is given aΔV/Vof 1). AllFvalues exceedFcritof 2.4 (Table5), showing statis-tical dependence. We also retest the null hypothesis that dome growth style and relative collapse volume ratio are indepen-dent, finding again that allF values exceed theFcritof 3.1 (Table5). It therefore seems that our result that relative col-lapse volume ratio is dependent on both causal mechanism
Table 5 Fvalue from ANOVA test, andpvalue showing significance. Calculated from running ANOVA on causal mechanism and relative collapse volume ratio (ΔV/V), and dome growth style and relative collapse volume ratio (ΔV/V)
Redoubt original volume Causal mechanism Dome growth style
Fvalue pvalue Fvalue pvalue
1 × 10⁶m3 6.1 2 × 10⁻⁴ 20.9 8 × 10⁻⁸ 3 × 10⁶m3 5.6 4 × 10⁻⁴ 14.1 8 × 10⁻⁶ 5 × 10⁶m3 8.2 1 × 10⁻⁷ 3.9 2 × 10⁻³
and dome growth style is valid despite the uncertainty associ-ated with the Redoubt data.
Implications for understanding lava dome collapse
Using ANOVA has allowed us to propose null hypotheses and reject or accept these based on data currently inGLADIS. We discuss how these results alongside examples of collapse
events fromGLADIS may influence our understanding of
dome collapse processes.
It could be expected that high extrusion rates lead to higher collapse magnitudes (Husain et al.2014; Zorn et al.2018). We find that there is no apparent link between extrusion rate and collapse volumes (both absolute and relative). Of the highest recorded extrusion rates inGLADIS, we find a range in col-lapse magnitudes. For example, an extrusion rate of 25 m3/s preceded a 100% collapse at Merapi on 5 November 2010 (Pallister et al.2013b), and a rate of 25.5 m3/s preceded an 80% collapse at Redoubt on 2 January 1990 (Brantley1990). However, we also find that a 10% collapse at Chaitén on 19 February 2009 was preceded by a 45 m3/s extrusion rate (Pallister et al.2013a), and an 18% collapse at Soufrière Hills volcano on 11 February 2010 was preceded by a 35 m3/s extrusion rate (Calder et al. 2002; Stinton et al. 2014b). Both the Merapi and Redoubt events with relative collapse volume ratios > 80% have attributed collapse mech-anisms of gas pressurisation, whereas the smaller relative events at Chaitén and Soufrière Hills volcano are attributed to gravitational loading. We infer from this that collapse mech-anism has a more significant effect on the resultant collapse than extrusion rate. Therefore, qualitative observations de-signed to indicate the processes behind the collapse mecha-nisms listed in this study are extremely important, e.g. ob-served inflation of the dome suggests presence of gas pressure or qualitative description of added material to the dome sur-face in one preferred extrusion direction.
We do however note that our analysis of this correlation is affected by the variations in time period over which the extru-sion rate is recorded (ranging from daily estimates from the day of collapse, to rates averaged over the whole eruptive period), and so a higher time resolution would aid this. We speculate that extrusion rate may be linked to triggering col-lapse in a way that is not currently determinable using this dataset. For example, a faster magma ascent rate limits the timescale over which magma outgassing occurs (Zorn et al. 2018), which can contribute to gas pressurisation of the dome (Sparks1997). Therefore, whilst extrusion rate can be linked to explosivity or conceptually to the other collapse mecha-nisms discussed in this study, we identify no explicit causal link between extrusion rate and collapse magnitude. We sug-gest instead that the effect of extrusion rate on overall dome stability depends on dome conditions prior to collapse, and the time period over which a high extrusion rate occurs.
In this study, we also found that dome growth style (e.g. exogenous, endogenous, combination) influences relative col-lapse volume ratio but not absolute colcol-lapse volume. We sug-gest this may be due to limited mass wastage at a dome which is emplaced endogenously. For example, the seismological record from the endogenously emplaced 1989–1990 dome at Redoubt shows very few minor rockfalls (Cornelius and Voight 1994), whereas the exogenous domes at Mt. Unzen and Soufrière Hills volcano experienced a large number of minor rockfalls and pyroclastic flows due to crumbling of the dome carapace and shedding of material during growth (Calder et al.2002; Sato et al.1992).
Although this proposed mechanism of limited mass wast-age during endogenous growth could explain why endoge-nous domes are more prone to larger relative collapses, we suggest that this dataset is biased by the endogenous domes
at Redoubt. The exogenous domes inGLADIS have a huge
range in relative collapse volume ratios, for example 0.6% at SHV (5 June 1997) (Calder et al.1999; Sparks et al.1998) and 96% at Merapi (11 November 1994) (Voight et al. 2000a, 2000b). The same applies to absolute collapse volumes where we have a range of 104m3at Unzen (25 February 1992) (Ui et al.1999) to 164 × 106m3at Soufrière Hills volcano (12 July 2003) (Herd et al.2005). Therefore, to accept the statis-tical dependence of relative collapse magnitude on growth style, and the independence of absolute collapse volume from growth style, we suggest more data would be required to re-move the Redoubt bias. This analysis particularly benefits from using relative collapse volume ratio. This reinforces the importance of original dome volume measurements in global dome stability analyses, particularly those with high temporal resolution.
We also show that original dome size cannot be used as a predictor of the cause of collapse. For example, two domes emplaced during the 1989–1990 eruption at Redoubt were both clearly linked to explosive collapse (Miller1994), but the 2 January 1990 collapse was of a 25 × 106m3 dome, whereas the 21 April 1990 collapse was of a dome with a volume of 1–5 × 10⁶m3. Miller et al. (Miller1994) suggest that explosive collapse was caused due to circulation of water caused by the ice-filled summit crater at Redoubt. We observe therefore that the explosive fragmentation caused by ground-water vaporisation is scale-insensitive, and suggest that this conclusion of scale independence holds true for the other col-lapse mechanisms listed.
and 9%, respectively. Both occurred due to overspilling after new lobes had filled up previous collapse scars (Calder et al. 2002). At Redoubt however, a series of gravitational failures (Bull and Buurman2013; Miller1994) all exceeded 66% in relative volume.
The processes of collapse due to gravitational loading and topographical constraint were modelled by Harnett et al. (2018), where it was shown that larger relative volumes during gravitational collapse arose from development of a failure plane much deeper within the dome, whereas topography-controlled collapses involved only surface material and devel-opment of small-scale rockfalls, agreeing with the statistical analysis presented here. Resultant relative collapse volume ratios were also shown to be significantly different between collapses caused by gas pressurisation and those caused by a switch in extrusion direction. Similar physical processes are found to be the cause of this difference by Harnett et al. (2018), where a preferred extrusion direction results in much more superficial failures than gas pressurisation, and therefore this leads to a much smaller relative volume loss.
Conclusions
By statistically analysing a global and historical database of individual dome collapse events, we are able to examine rela-tionships between collapse magnitude (both absolute and rel-ative) and extrusion rate, dome growth style and collapse mechanism.
We find that:
1. Short-term extrusion rate does not affect relative collapse volume ratio (ΔV/V) or absolute collapse volume (ΔV).
2. Dome growth style impacts relative collapse volume ratio, but does not influence absolute collapse volume. We see that endogenous dome growth is most likely to precede larger relative collapse volume ratios (averageΔV/V= 0.76), and exogenous dome growth is most likely to pre-cede smaller relative collapse volume ratios (average ΔV/V= 0.24).
3. Dome volume at the time of collapse does not influence the mechanism of collapse.
4. The mechanism attributed to collapse significantly effects both relative collapse volume ratio (ΔV/V) and absolute collapse volume (ΔV). The most significant statistical dif-ference shows particularly that collapses attributed to gravitational loading (average ΔV/V= 0.50) or gas pressurisation (averageΔV/V= 0.68) involve larger dome proportions and topography-controlled collapses (average ΔV/V= 0.08) or those caused by a switch in extrusion direction (average ΔV/V= 0.05) involve smaller dome proportions.
In this study, we identify five key causal mechanisms for collapse: increased gravitational loading associated with dome growth; intense rainfall; increased gas overpressure leading to explosive activity; thrust forces associated with lava lobe ex-trusion and changing exex-trusion direction; and the relative size of the dome compared to the crater in which it sits (or the underlying slope). The strongest statistical link found through the analysis in this study exists between collapse size (both relative and absolute) and causal mechanism. We suggest therefore that these mechanisms should be the focus of future lava dome modelling efforts.
Although theGLADISdatabase is not exhaustive in its data collation, it allows us to examine historical and global trends in dome collapse and determine the parameters needed to inform short-term forecasting and hazard assessment at dome-forming volcanoes. Observatories play a key role in monitoring dome-building eruptions and feeding that infor-mation into the published literature which has been compiled inGLADIS. By adding more detailed recordings of real-time volume estimates of the dome and collapse volumes to GLADIS, an even more detailed picture of dynamic dome processes will emerge.
Acknowledgements This type of database would not be possible without daily efforts from observatory staff. We thank also the efforts of Sarah Ogburn in compiling DomeHaz and all at the Smithsonian for compiling the GVP—both were instrumental in the early creation ofGLADIS. CEH was funded through a NERC studentship as part of the Leeds York Spheres Doctoral Training Partnership (DTP) (grant number NE/ L002574/1). SKE is supported by an Early Career Fellowship from the Leverhulme Trust and by a Living Planet Fellowship from the European Space Agency. We thank Sarah Ogburn and an anonymous reviewer for helpful comments on an earlier version of this manuscript. We also grate-fully acknowledge Lucia Capra and Josef Dufek for editorial handling and additional comments that improved the quality of this manuscript.
Open Access This article is distributed under the terms of the Creative C o m m o n s A t t r i b u t i o n 4 . 0 I n t e r n a t i o n a l L i c e n s e ( h t t p : / / creativecommons.org/licenses/by/4.0/), which permits unrestricted use, distribution, and reproduction in any medium, provided you give appropriate credit to the original author(s) and the source, provide a link to the Creative Commons license, and indicate if changes were made.
References
Arnold DWD, Biggs J, Wadge G, Ebmeier SK, Odbert HM, Poland MP (2016) Dome growth, collapse, and valley fill at Soufrière Hills Volcano, Montserrat, from 1995 to 2013: contributions from satellite radar measurements of topographic change. Geosphere 12:1300– 1315.https://doi.org/10.1130/GES01291.1
Ball JL, Calder ES, Hubbard BE, Bernstein ML (2013) An assessment of hydrothermal alteration in the Santiaguito lava dome complex, Guatemala: implications for dome collapse hazards. Bull Volcanol 75:676–694.https://doi.org/10.1007/s00445-012-0676-z
Bardintzeff JM (1984) Merapi Volcano (Java , Indonesia) and Merapi-Type Nuée Ardente. Bull Volcanol 47:433–446.https://doi.org/10. 1007/bf01961217
Bernard J, Kelfoun K, Le Pennec JL, Vallejo Vargas S (2014) Pyroclastic flow erosion and bulking processes: comparing field-based vs. modeling results at Tungurahua volcano, Ecuador. Bull Volcanol 76:1–16.https://doi.org/10.1007/s00445-014-0858-y
Boudon, G., Villemant, B., Komorowski, J. C., Ildefonse, P., and Semet, M. P. (1998). The hydrothermal system at Soufriere Hills volcano, Montserrat (West Indies): characterization and role in the on-going eruption. 25, 3693–3696.
Branney, M. J., and Kokelaar, P. (2002). Pyroclastic density currents and the sedimentation of ignimbrites.Geol. Soc.London,Mem.27. Brantley, S. R. (1990). The eruption of Redoubt Volcano, Alaska,
December 14, 1989 - August 31, 1990.
Brown S, Crosweller H, Sparks RS, Cottrell E, Deligne N, Guerrero N et al (2014) Characterisation of the quaternary eruption record: analysis of the large magnitude explosive volcanic eruptions (LaMEVE) database. J Appl Volcanol 3:5.https://doi.org/10. 1186/2191-5040-3-5
Bull KF, Buurman H (2013) An overview of the 2009 eruption of Redoubt Volcano, Alaska. J Volcanol Geotherm Res 259:2–15. https://doi.org/10.1016/j.jvolgeores.2012.06.024
Calder ES, Cole PD, Dade WB, Druitt TH, Hoblitt RP, Huppert HE, Ritchie L, Sparks RSJ, Young SR (1999) Mobility of pyroclastic flows and surges at the Soufrière Hills Volcano, Montserrat. Geophys Res Lett 26:537–540
Calder ES, Luckett R, Sparks RSJ, Voight B (2002) Mechanisms of lava dome instability and generation of rockfalls and pyroclastic flows at Soufrière Hills Volcano, Montserrat. Geol Soc Lond Mem 21:173– 190.https://doi.org/10.1144/GSL.MEM.2002.021.01.08
Calder, E. S., Lavallée, Y., Kendrick, J. E., and Bernstein, M. (2015). Chapter 18—lava dome eruptions, in The encyclopedia of volca-noes (Academic Press), 343–362. https://doi.org/10.1016/B978-0-12-385938-9.00018-3.
Carn SA, Watts RB, Thompson G, Norton GE (2004) Anatomy of a lava dome collapse: the 20 March 2000 event at Soufrière Hills Volcano, Montserrat.J Volcanol Geotherm Res100:241–264.https://doi.org/ 10.1016/S0377-0273(03)00364-0.
Charbonnier SJ, Gertisser R (2008) Field observations and surface char-acteristics of pristine block-and-ash flow deposits from the 2006 eruption of Merapi Volcano, Java, Indonesia. J Volcanol Geotherm Res 177:971–982.https://doi.org/10.1016/j.jvolgeores.2008.07.008 Cole PD, Calder ES, Sparks RSJ, Clarke A, Druitt TH, Young SR et al (2002) Deposits from dome-collapse and fountain-collapse pyro-clastic flows at Soufrière Hills Volcano, Montserrat. Geol Soc London, Mem 21:231–262
Cornelius RR, Voight B (1994) Seismological aspects of the 1989-1990 eruption at Redoubt Volcano, Alaska: the materials failure forecast method (FFM) with RSAM and SSAM seismic data. J Volcanol Geotherm Res 62:469–498.https://doi.org/10.1016/0377-0273(94) 90048-5
Crisp JA (1984) Rates of magma emplacement and volcanic output. J Volcanol Geotherm Res 20:177–211. https://doi.org/10.1016/0377-0273(84)90039-8
Crosweller HS, Arora B, Brown SK, Cottrell E, Deligne NI, Guerrero NO, Hobbs L, Kiyosugi K, Loughlin SC, Lowndes J, Nayembil M, Siebert L, Sparks RSJ, Takarada S, Venzke E (2012) Global data-base on large magnitude explosive volcanic eruptions (LaMEVE). J Appl Volcanol 1:1–13.https://doi.org/10.1186/2191-5040-1-4. Donne DD, Harris AJL, Ripepe M, Wright R (2010) Earthquake-induced
thermal anomalies at active volcanoes. Geology 38:771–774. https://doi.org/10.1130/G30984.1
Ebmeier SK, Andrews BJ, Araya MC, Arnold DWD, Biggs J, Cooper C, Cottrell E, Furtney M, Hickey J, Jay J, Lloyd R, Parker AL, Pritchard ME, Robertson E, Venzke E, Williamson JL (2018)
Synthesis of global satellite observations of magmatic and volcanic deformation: implications for volcano monitoring & the lateral ex-tent of magmatic domains. J Appl Volcanol 7:1–26.https://doi.org/ 10.1186/s13617-018-0071-3.
Furlan C (2010) Extreme value methods for modelling historical series of large volcanic magnitudes. Stat Model 10:113–132.https://doi.org/ 10.1177/1471082X0801000201
Genareau K, Cronin SJ, Lube G (2015) Effects of volatile behaviour on dome collapse and resultant pyroclastic surge dynamics: Gunung Merapi 2010 eruption. Geol Soc Lond Spec Publ 410:199–218. https://doi.org/10.1144/SP410.6
Geyer A, Martí J (2008) The new worldwide collapse caldera database (CCDB): a tool for studying and understanding caldera processes. J Volcanol Geotherm Res 175:334–354. https://doi.org/10.1016/j. jvolgeores.2008.03.017
Hale AJ (2008) Lava dome growth and evolution with an independently deformable talus. Geophys J Int 174:391–417.https://doi.org/10. 1111/j.1365-246X.2008.03806.x
Hale AJ, Calder ES, Loughlin SC, Wadge G, Ryan GA (2009a) Modelling the lava dome extruded at Soufrière Hills Volcano, Montserrat, August 2005-May 2006. Part I: dome shape and internal structure. J Volcanol Geotherm Res 187:69–84.https://doi.org/10. 1016/j.jvolgeores.2009.08.014
Hale AJ, Calder ES, Loughlin SC, Wadge G, Ryan GA (2009b) Modelling the lava dome extruded at Soufrière Hills Volcano, Montserrat, August 2005-May 2006. Part II: rockfall activity and talus deformation. J Volcanol Geotherm Res 187:69–84.https://doi. org/10.1016/j.jvolgeores.2009.08.014
Harnett CE, Thomas ME, Purvance MD, Neuberg J (2018) Using a dis-crete element approach to model lava dome emplacement and col-lapse. J Volcanol Geotherm Res 359:68–77.https://doi.org/10.1016/ j.jvolgeores.2018.06.017
Hédervári P (1963) On the energy and magnitude of volcanic eruptions. Bull Volcanol 25:373–385.https://doi.org/10.1007/BF02596568 Herd RA, Edmonds M, Bass V (2005) Catastrophic lava dome failure at
Soufrière Hills Volcano, Montserrat, 12-13 July 2003. J Volcanol Geotherm Res 148:234–252.https://doi.org/10.1016/j.jvolgeores. 2005.05.003
Hooper DM, Mattioli GS (2001) Kinematic modeling of pyroclastic flows produced by gravitational dome collapse at Soufriere Hills volcano, Monstserrat. Nat Hazards 23:65–86.https://doi.org/10. 1023/A:1008130605558.
Hungr O, Leroueil S, Picarelli L (2014) The Varnes classification of landslide types, an update. Landslides 11:167–194.https://doi.org/ 10.1007/s10346-013-0436-y
Husain T, Elsworth D, Voight B, Mattioli GS, Jansma P (2014) Influence of extrusion rate and magma rheology on the growth of lava domes: insights from particle-dynamics modeling. J Volcanol Geotherm Res 285:110–117.https://doi.org/10.1016/j.jvolgeores.2014.08.013. Hutchison W, Varley N, Pyle DM, Mather TA, Stevenson JA (2013)
Airborne thermal remote sensing of the Volcán de Colima (Mexico) lava dome from 2007 to 2010. Geol Soc Lond Spec Publ 380:203–228.https://doi.org/10.1144/SP380.8
James MR, Varley N (2012) Identification of structural controls in an active lava dome with high resolution DEMs: Volcan de Colima, Mexico. Geophys Res Lett 39:1–5.https://doi.org/10.1029/ 2012GL054245
Loughlin SC, Luckett R, Ryan G, Christopher T, Hards V, De Angelis S et al (2010) An overview of lava dome evolution, dome collapse and cyclicity at Soufrière Hills Volcano, Montserrat, 2005-2007. Geophys Res Lett 37.https://doi.org/10.1029/2010GL042547 Luckett R, Loughlin S, De Angelis S, Ryan G (2008) Volcanic seismicity
Matthews AJ, Barclay J (2004) A thermodynamical model for rainfall-triggered volcanic dome collapse. Geophys Res Lett 31.https://doi. org/10.1029/2003GL019310
Matthews AJ, Barclay J, Carn SA, Thompson G, Alexander J, Herd RA et al (2002) Rainfall-induced volcanic activity on Montserrat. Geophys Res Lett 29.https://doi.org/10.1029/2002GL014863 Mercado R, Rose WI, Matias O, Giron J (1988) November 1929 dome
collapse and piroclastic flow at Santiaguito Dome, Guatemala. EOS Trans Am Geophys Union 69:1487
Miller TP (1994) Dome growth and destruction during the 1989–1990 eruption of Redoubt Volcano. J Volcanol Geotherm Res 62:197– 212.https://doi.org/10.1016/0377-0273(94)90034-5
Ogburn, S. E. (2012). FlowDat: Mass flow database v2.2.Vhubhttps:// vhub.org/groups/massflowdatabase.
Ogburn SE, Calder ES (2017) The relative effectiveness of empirical and physical models for simulating the dense undercurrent of pyroclastic flows under different emplacement conditions. Front Earth Sci 5. https://doi.org/10.3389/feart.2017.00083
Ogburn, S. E., Loughlin, S. C., and Calder, E. S. (2012). DomeHaz: dome-forming eruptions database v2.4.
Ogburn SE, Loughlin SC, Calder ES (2015) The association of lava dome growth with major explosive activity (VEI≥4): DomeHaz, a global dataset. Bull Volcanol 77. https://doi.org/10.1007/s00445-015-0919-x
Ogburn S, Berger J, Calder E, Lopes D, Patra A, Pitman EB et al (2016) Pooling strength amongst limited datasets using hierarchical Bayesian analysis, with application to pyroclastic density current mobility metrics. Stat Volcanol 2:1–26.https://doi.org/10.5038/ 2163-338X.2.1
Pallister JS, Diefenbach AK, Burton WC, Munoz J, Griswold JP, Lara L et al (2013a) The Chaitén rhyolite lava dome: eruption sequence, lava dome volumes, rapid effusion rates and source of the rhyolite magma. Andean Geol 40:277–294. https://doi.org/10.5027/ andgeoV40n2-a06
Pallister JS, Schneider DJ, Griswold JP, Keeler RH, Burton WC, Noyles C, Newhall CG, Ratdomopurbo A (2013b) Merapi 2010 eruption-chronology and extrusion rates monitored with satellite radar and used in eruption forecasting. J Volcanol Geotherm Res 261:144– 152.https://doi.org/10.1016/j.jvolgeores.2012.07.012.
Platz T, Cronin SJ, Procter JN, Neall VE, Foley SF (2012) Non-explosive, dome-forming eruptions at Mt. Taranaki, New Zealand. Geomorphology 136:15–30.https://doi.org/10.1016/j.geomorph. 2011.06.016
Sato H, Fujii T, Nakada S (1992) Crumbling of dacite dome lava and generation of pyroclastic flows at Unzen volcano. Lett to Nat 360: 664–666
Saucedo R, Macías JL, Sheridan MF, Bursik MI, Komorowski JC (2005) Modeling of pyroclastic flows of Colima Volcano, Mexico: impli-cations for hazard assessment. J Volcanol Geotherm Res 139:103– 115.https://doi.org/10.1016/j.jvolgeores.2004.06.019
Sheldrake TE, Sparks RSJ, Cashman KV, Wadge G, Aspinall WP (2016) Similarities and differences in the historical records of lava dome-building volcanoes: implications for understanding magmatic pro-cesses and eruption forecasting. Earth-Science Rev 160:240–263. https://doi.org/10.1016/j.earscirev.2016.07.013
Siebert L (1984) Large volcanic debris avalanches: characteristics of source areas, deposits, and associated eruptions. J Volcanol Geotherm Res 22:163–197.https://doi.org/10.1016/0377-0273(84) 90002-7
Simmons J, Elsworth D, Voight B (2004) Instability of exogenous lava lobes during intense rainfall. Bull Volcanol 66:725–734.https://doi. org/10.1007/s00445-004-0353-y
Simmons J, Elsworth D, Voight B (2005) Classification and idealized limit-equilibrium analyses of dome collapses at Soufrière Hills vol-cano, Montserrat, during growth of the first lava dome: November
1995-March 1998. J Volcanol Geotherm Res 139:241–258.https:// doi.org/10.1016/j.jvolgeores.2004.08.009
Sparks RSJ (1997) Causes and consequences of pressurisation in lava dome eruptions. Earth Planet Sci Lett 150:177–189
Sparks RSJ, Young SR, Barclay J, Calder ES, Cole P, Darroux B, Davies MA, Druitt TH, Harford C, Herd R, James M, Lejeune AM, Loughlin S, Norton G, Skerrit G, Stasiuk MV, Stevens NS, Toothill J, Wadge G, Watts R (1998) Magma production and growth of the lava dome of the Soufrière Hills Volcano, Montserrat, West Indies: November 1995 to December 1997. Geophys Res Lett 25: 3421–3424.https://doi.org/10.1029/98GL00639
Stinton AJ, Cole PD, Odbert HM, Christopher T, Avard G, Bernstein M (2014a) Dome growth and valley fill during phase 5 (8 October 2009-11 February 2010) at the Soufrière Hills Volcano, Montserrat.Geol Soc Lond Mem39:113–131.https://doi.org/10. 1144/M39.6
Stinton AJ, Cole PD, Stewart RC, Odbert HM, Smith P (2014b) The 11 February 2010 partial dome collapse at Soufrière Hills Volcano, Montserrat.Geol Soc Lond Mem39:133–152.https://doi.org/10. 1144/M39.7
Swanson, D. A., Dzurisin, D., Holcomb, R. T., Iwatsubo, E. Y., Chadwick, W. W., Casadevall, T. J., et al. (1987). Growth of the lava dome at Mount St. Helens, Washington, (USA), 1981-1983. Geol. Soc. Am.Special Pa.
Taron J, Elsworth D, Thompson G, Voight B (2007) Mechanisms for rainfall-concurrent lava dome collapses at Soufrière Hills Volcano, 2000–2002. J Volcanol Geotherm Res 160:195–209.https://doi.org/ 10.1016/j.jvolgeores.2006.10.003
Thiele ST, Varley N, James MR (2017) Thermal photogrammetric imag-ing: a new technique for monitoring dome eruptions. J Volcanol Geotherm Res 337:140–145.https://doi.org/10.1016/j.jvolgeores. 2017.03.022
Ui T, Matsuwo N, Sumita M, Fujinawa A (1999) Generation of block and ash flows during the 1990-1995 eruption of Unzen Volcano, Japan. J Volcanol Geotherm Res 89:123–137
Vallance JW, Schneider DJ, Schilling SP (2008) Growth of the 2004-2006 lava-dome complex at Mount St. Helens, Washington.A Volcano Rekindled Renewed Erupt. Mt. St. Helens 2004-2006, U.S.Geol Surv Prof Pap 1750:169–208
Venzke, E., Wunderman, R., and McClelland, L. Global volcanism, 1968 to present. Available at:http://www.volcano.si.edu/reports. Voight B (2000) Structural stability of andesite volcanoes and lava
domes. Philos Trans R Soc Lond A 358:1663–1703
Voight B, Elsworth D (2000) Instability and collapse of hazardous gas-pressurized lava domes. Geophys Res Lett 27:1–4.https://doi.org/ 10.1029/1999GL008389.
Voight B, Constantine EK, Siswowidjoyo S, Torley R (2000a) Historical eruptions of Merapi Volcano, Central Java, Indonesia, 1768-1998. J Volcanol Geotherm Res 100:69–138
Voight B, Young KD, Hidayat D, Subandrio Purbawinata MA, Ratdomopurbo A et al (2000b) Deformation and seismic precursors to dome-collapse and fountain-collapse nuées ardentes at Merapi Volcano, Java, Indonesia, 1994-1998. J Volcanol Geotherm Res 100:261–287.https://doi.org/10.1016/s0377-0273(00)00140-2 Voight B, Komorowski J-C, Norton GE, Belousov AB, Belousova M,
Boudon G, Francis PW, Franz W, Heinrich P, Sparks RSJ, Young SR (2002) The 26 December (boxing day) 1997 sector collapse and debris avalanche at Soufrière Hills Volcano, Montserrat. Geol. Soc. London, Mem 21:363–407.https://doi.org/10.1144/GSL. MEM.2002.021.01.17
Wadge, G. (2009). Assessing the pyroclastic flow hazards from dome collapse at Soufrière Hills Volcano, Montserrat.Stud. Volcanol. Leg. Georg. Walker, Specical Publ.IAVCEI 2, 211–224.