doi: 10.1093/alcalc/agx127 Article
Article
Self-Reported Knowledge, Correct Knowledge
and use of UK Drinking Guidelines Among a
Representative Sample of the English
Population
Penny Buykx
1,*, Jessica Li
2,†, Lucy Gavens
1,†, Lucie Hooper
3,
Elena Gomes de Matos
4, and John Holmes
11
ScHARR, University of Shef
fi
eld, Regent Court, 30 Regent Street, Shef
fi
eld, S1 4DA, UK,
2dosomething.org, 19 W 21st
St, New York, NY 10010, USA,
3Policy Research Centre for Cancer Prevention, Cancer Research, Angel Building,
407 St John Street, London EC1V 4AD, UK, and
4Epidemiology and Diagnostics, Institut für Therapieforschung,
Parzivalstra
β
e 25, 80804 München, Germany
*Corresponding author: ScHARR, University of Sheffield, Regent Court, 30 Regent Street, Sheffield S1 4DA, UK. Tel.:+ 44-114-222-5202; E-mail: p.f.buykx@sheffield.ac.uk
†Work conducted when employed at ScHARR, University of Sheffield.
Received 12 July 2017; Revised 20 December 2017; Editorial Decision 23 December 2017; Accepted 2 January 2018
ABSTRACT
Aims:
Promotion of lower risk drinking guidelines is a commonly used public health intervention
with various purposes, including communicating alcohol consumption risks, informing drinkers
’
decision-making and, potentially, changing behaviour. UK drinking guidelines were revised in
2016. To inform potential promotion of the new guidelines, we aimed to examine public
knowl-edge and use of the previous drinking guidelines, including by population subgroup.
Methods:
A demographically representative, cross-sectional online survey of 2100 adults living in
England in July 2015 (i.e. two decades after adoption of previous guidelines and prior to
introduc-tion of new guidelines). Univariate and multivariate logistic regressions examined associaintroduc-tions
between demographic variables, alcohol consumption (AUDIT-C), smoking, and knowledge of
health conditions and
self-reported knowledge
and use of drinking guidelines. Multinomial logistic
regression examined the same set of variables in relation to
accurate knowledge
of drinking
guidelines (underestimation, accurate-estimation, overestimation).
Results:
In total, 37.8% of drinkers self-reported knowing their own-gender drinking guideline, of
whom 66.2% gave an accurate estimate. Compared to accurate estimation, underestimation was
associated with male gender, lower education and AUDIT-C score, while overestimation was
asso-ciated with smoking. Few (20.8%) reported using guidelines to monitor drinking at least
some-times. Drinking guideline use was associated with higher education, overestimating guidelines
and lower AUDIT-C. Correctly endorsing a greater number of health conditions as alcohol-related
was associated with self-reported knowledge of guidelines, but was not consistently associated
with accurate estimation or use to monitor drinking.
Conclusions:
Two decades after their introduction, previous UK drinking guidelines were not well
known or used by current drinkers. Those who reported using them tended to overestimate
recommended daily limits.
SHORT SUMMARY:
We examined public knowledge and use of UK drinking guidelines just before
new guidelines were released (2016). Despite previous guidelines being in place for two decades,
only one in four drinkers accurately estimated these, with even fewer using guidelines to monitor
drinking. Approximately 8% of drinkers overestimated maximum daily limits.
INTRODUCTION
In an effort to curtail the negative health, economic, and social effects associated with alcohol use, governments the world over seek to implement strategies to reduce alcohol consumption. Drinking guidelines are a public health intervention implemented in many countries, including the UK, with the intention of encouraging low to moderate alcohol use and informing the public’s decision-making around alcohol (Heather, 2012). Guidelines typically involve the identification of an amount of alcohol beyond which consumption is seen to pose a significant health risk; although the definition of‘ sig-nificant’is often not explicit. There is variation between countries in how guidelines are set and structured, for example, in the method used for deriving the recommended threshold, the metric used to define a standard drink or unit, whether a daily or weekly threshold is set and whether this differs for men and women (International Center for Alcohol Policies, 2003;Rehm and Patra, 2012; Room and Rehm, 2012;Kalinowski and Humphreys, 2016).
In comparison to other interventions intended to reduce alcohol consumption and related harms, such as increased prices and reduced availability, there is a paucity of evidence regarding the effectiveness of drinking guidelines (Baboret al., 2010). Although a small number of studies have identified increased awareness of guidelines following promotional campaigns (Grøenæket al., 2001; Livingston, 2012), there are few studies which specifically evaluate the impact of publicizing drinking guidelines on consumption. The evidence of effects on alcohol consumption for education campaigns and health warnings more broadly is mixed (Andersonet al., 2009), with the latter being linked to increased awareness, but not actual behaviour change (Wilkinson and Room, 2009). Given the lack of strong supporting evidence for their effectiveness, it has been argued that drinking guidelines are simply a politically expedient diversion from the implementation of better evidenced, but less popular alter-natives (Casswell, 2012). Nonetheless, it may also be argued that in the interests of informed consumer choice, some form of health guidance regarding alcohol use should be available to the general public. It has also been suggested that guidelines‘may shift public discourse on alcohol’(Marteau, 2016) such that prevailing attitudes are more supportive of moderation.
The rationale of‘informed choice’is reflected by the current UK Alcohol Strategy which identifies drinking guidelines as a potential mechanism by which to‘ensure that everyone understands the risks around excessive alcohol consumption to help them make the right choices for themselves and their families’(HM Government, 2012, p. 5). As proposed in the Strategy, the UK drinking guidelines have recently undergone review: initially published in January 2016 and formally adopted in September 2016, new guidelines recommend that both men and women not exceed 14 units of alcohol per week (1 unit=7.9 g/10 ml ethanol) (Department of Health, 2016). This is in contrast to the previous guidelines published in 1995 which recommended not regularly consuming more than 3–4 units a day for men and 2–3 units a day for women (i.e. if, for comparative pur-poses, the previous guidelines if multiplied across the week imply a recommendation not to exceed 21–28 units for men and 14–21 for
women). Additionally, the new drinking guidelines make explicit their health-related purpose by recommending people drink within limits‘to keep health risks from drinking alcohol to a low level’and identifying the increased risk of cancer at any level of consumption (Department of Health, 2016).
The report of a monthly omnibus household survey provided data on guidelines knowledge, awareness and use among the general population of Great Britain from 1997 to 2009 in 10 waves (Office for National Statistics, 2010). In 2009, 74% of respondents had heard of drinking daily limits compared to 54% in 1997, with a greater proportion of heavier drinkers having heard of them than lighter drinkers, but little difference was found between men and women. However, lower proportions were able to correctly identify the guidelines: in 2009 only 44% of respondents were aware of the guideline for men and 52% of the guideline for women (compared to 35% and 39%, respectively, in 1997). Again, those with higher levels of self-reported alcohol consumption were more likely to cor-rectly identify the guidelines. Other UK studies using various mea-sures of awareness and/or knowledge also suggest generally poor understanding of drinking guidelines among adults and school and university students (Webster‐Harrison et al., 2002;Gill and May, 2007;de Visser and Birch, 2012).
Given the recent release of new UK drinking guidelines, it is timely to once more consider levels of public knowledge of the 1995 guidelines (House of Commons Science and Technology Committee, 2012), in order to understand the extent to which and by whom these are understood after more than two decades of stability. We therefore aimed to (1) examine the levels of awareness, knowledge, and use of previous drinking guidelines, (2) identify socio-demographic factors associated with these, and (3) explore the extent to which relevant health behaviours (alcohol use and smok-ing) and health knowledge were associated with knowledge and use of previous guidelines.
METHODS
Recruitment and response rate
Measures
Self-reported guideline knowledge
Knowledge of official drinking guidelines that were in place at the time of the survey was measured via two questions,‘Do you know how many alcohol units it is recommended that menshould not exceed in a day?’and‘Do you know how many alcohol units it is recommended that women should not exceed in a day?’ A new dichotomous (yes/no) variable self-reported guideline knowledge was created to reflect whether men and women knew their own gen-der guidelines.
Accuracy of guideline knowledge
Survey respondents who said ‘yes’ to knowing their own gender guideline were then asked to indicate the respective recommended amount onto a sliding scale (from 0 to 10 units, where each point on the scale was half a unit). To assist in responding, a graphic was shown indicating the alcohol unit content of different types of alco-hol in a variety of measures (e.g. one pint of beer; one single meas-ure of spirits). Based on responses given on this scale, a new variable was created to indicateaccuracy of guideline knowledge: men who reported values between 3 and 4 units inclusive and women who reported values between 2 and 3 units inclusive for their own gender guideline were defined as having‘accurate’guideline knowledge, in contrast to those who provided an inaccurate estimate (‘ underesti-mate’=men<3 units/women<2 units and‘overestimate’=men>4 units/women >3 units). Those who were coded as ‘no’ for self-reported guideline knowledge above were not asked to indicate the recommended number of units and so were coded as‘no estimate’for theaccuracy of guideline knowledgevariable.
Guideline use
Respondents who reported knowing their own gender guideline (i.e. self-reported guideline knowledge) were also asked about the fre-quency of using it to keep track of their drinking (five-point scale ‘always’to ‘never’). Responses were recoded into a new guideline usevariable, dichotomized as‘yes’(‘sometimes’,‘often’or‘always’) and‘no’(‘rarely’or‘never’).
Predictor variables
Respondents were also asked questions regarding their demographic characteristics (age in years, gender, highest level of education [seven categories collapsed into‘no qualifications’,‘below degree level’and ‘degree level or above’] and postcode). Postcode data were used to derive 2015 Index of Multiple Deprivation (IMD) quintiles (UK Government, 2015). The IMD is a measure of deprivation calculated for 32, 844 small areas in England based on seven domains: income; employment; health and disability; education, skills and training; crime; barriers to housing and services; and living environment (Department for Communities and Local Government, 2015). Health behaviour items covered smoking and alcohol consumption, the latter measured using the three-item Alcohol Use Disorders Identification Test (AUDIT-C) score (Bushet al., 1998). Respondents were also asked to indicate which of seven health conditions they thought could result from drinking too much alcohol: cancer, heart dis-ease, diabetes, high cholesterol, liver disdis-ease, being overweight or obese, and arthritis. Thefirst six of these were previously used inBuykxet al. (2015). Arthritis was added in this study to check the discriminant val-idity of questions but excluded from the derived total sum of health conditions used as a predictor variable.
Analysis
Descriptive statistics were generated for demographic variables: fre-quencies for categorical variables and means and standard devia-tions for continuous variables. Given our focus here on the use of drinking guidelines, we excluded non-drinkers (i.e. those with an AUDIT-C score=0,n=250) from all analyses, yielding an analyt-ical sample of 1850 drinkers. This sample was used to examine pre-dictors of two outcome measures:self-reported guideline knowledge (yes/no) and accuracy of guideline knowledge(no estimate, under-estimate, accurate under-estimate, overestimate). A subsample was created comprising respondents who provided an estimate of their own gen-der drinking guideline (n=699) and this was used to examine pre-dictors of a third outcome measure: guideline use (yes/no). Predictors of self-reported guideline knowledge and guideline use were identified via univariate and multivariate logistic regression models while predictors of accurate guideline knowledge were iden-tified via multinomial logistic regression.
Categorical predictor variables were gender, education (no
quali-fications, below degree, degree or above), IMD quintile (five categor-ies from most deprived to least deprived) and smoker status (daily or occasional smoker vs. past or never smoker). Continuous pre-dictor variables were age in years, AUDIT-C score (range 1–12), and the number of health conditions endorsed as resulting from drinking too much alcohol (range 0–6). Accuracy of guideline knowledge (underestimate, accurate estimate, overestimate) was included as an additional variable in predicting guideline use. Predictor variables were entered into logistic regression models using the using the default forced entry (i.e. single step) method in SPSS V.22.0 for Windows. As each of the predictor variables were of intuitive relevance to the outcome measures, all were entered into multivariate analyses (Hosmeret al., 2013). Weighting was used in all analyses to adjust for under sampling of respondents without qualifications relative to quotas based on population data for England and Wales from the 2011 Census (Office for National Statistics, 2014).
RESULTS
Sample characteristics
Half the sample (50.3%) were male and the average age was 48 years (range 18–80, SD=16.62); 13% had no educational qualifi ca-tions, 56% had educational qualifications below university degree level, and 31% were qualified at university degree level or above. The proportions in each population level IMD quintile from most deprived to least deprived were 22.6%, 22.4%, 20.3%, 17.0% and 17.7% (excluding 19 cases for whom postcode data to derive IMD were unavailable). Most respondents were low risk drinkers, the average AUDIT-C score was 4.7 (range 1–12, SD=2.78), and 33% were daily or occasional smokers. The average number of health conditions endorsed as being related to alcohol consumption was 4.1 (out of a possible 6, range 0–6, SD=1.62).
Self-reported guideline knowledge, accuracy
of guideline knowledge and guideline use
those who self-reported knowing their own gender guideline, whether or not they accurately estimated this, reported using the guideline at least sometimes to keep track of their drinking (or 20.8% of all respondents).
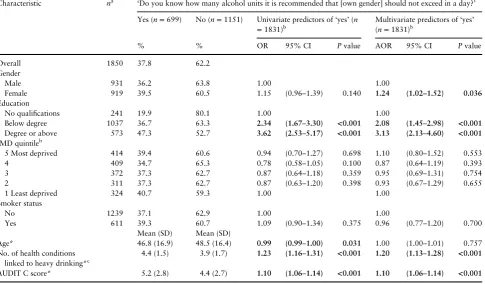
Self-reported knowledge, accurate knowledge and use of drink-ing guidelines by participant characteristics are presented in Tables 1, 2and 5. At the univariate level, those who were more highly educated, younger, reported more health conditions to be associated with heavy drinking, and had higher AUDIT-C scores were more likely to self-report knowing their own gender drinking guideline (Table1). With the exception of age, the adjusted odds for all of these predictors remained significant within multivariate regression. Level of education had the highest adjusted odds, with those with a degree or higher level of education being 3.13 times (95% CI [2.13–4.60]) as likely to indicate knowing their own gen-der guideline compared to those without qualifications. For each additional health condition they endorsed as alcohol-related, respon-dents were 1.20 (95% CI [1.13–1.28]) times as likely to indicate knowing their own gender guideline and 1.10 (95% CI [1.06–1.14]) times as likely for each additional AUDIT-C point scored. Gender also became significant when controlling for all predictors, females were 1.24 (95% CI [1.02–1.52]) times as likely as males to indicate knowing their own gender drinking guideline. An interaction term between gender and AUDIT-C score was included in a separate regression model (data not shown) to test this association as it was thought the emergence of gender as a significant predictor in the multivariate analysis may have been related to known gender
differences in alcohol consumption (with males consuming more on average) (Health and Social Care Information Centre, 2015), how-ever this interaction was not statistically significant.
When accuracy of drinking guideline estimation was considered by each predictor variable separately, males were significantly more likely to provide no estimate or an underestimate than an accurate estimate compare to females, as were those with no educational qua-lifications compared to those with a degree, and those with lower compared to higher AUDIT C scores (Table 3). Identifying fewer health conditions as being related to heavy drinking was signifi -cantly associated with providing no drinking guideline estimate compared to an accurate estimate. Overestimation of drinking guidelines compared to accurate estimation was associated with being in the two most deprived IMD quintiles (compared to least), being a smoker, and having a higher AUDIT C score.
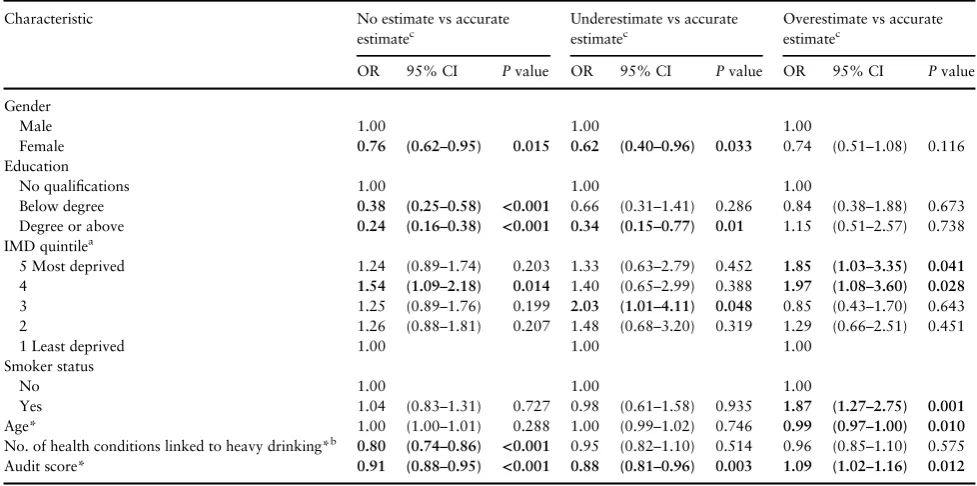
Multinomial logistic regression analysis including all predictor variables showed that compared to those who accurately estimated their own gender drinking guideline, those whodid not provide an estimatewere more likely to be male, to have no educational
[image:4.612.66.552.381.665.2]quali-fications, to report fewer health conditions as being linked to heavy drinking and to have a lower AUDIT C score (Table4). Predictors ofunderestimation of own gender drinking guidelines (compared to accurate estimation) were being male, having a below degree level qualification (compared to no qualification) and having a lower AUDIT C score. The only significant predictor of overesti-mation compared to accurate estimation was being a current smoker.
Table 1.Frequency and predictors of self-reported guideline knowledge (N=1850)
Characteristic na ‘Do you know how many alcohol units it is recommended that [own gender] should not exceed in a day?’
Yes (n=699) No (n=1151) Univariate predictors of‘yes’(n =1831)b
Multivariate predictors of‘yes’ (n=1831)b
% % OR 95% CI Pvalue AOR 95% CI Pvalue
Overall 1850 37.8 62.2
Gender
Male 931 36.2 63.8 1.00 1.00
Female 919 39.5 60.5 1.15 (0.96–1.39) 0.140 1.24 (1.02–1.52) 0.036
Education
No qualifications 241 19.9 80.1 1.00 1.00
Below degree 1037 36.7 63.3 2.34 (1.67–3.30) <0.001 2.08 (1.45–2.98) <0.001
Degree or above 573 47.3 52.7 3.62 (2.53–5.17) <0.001 3.13 (2.13–4.60) <0.001
IMD quintileb
5 Most deprived 414 39.4 60.6 0.94 (0.70–1.27) 0.698 1.10 (0.80–1.52) 0.553
4 409 34.7 65.3 0.78 (0.58–1.05) 0.100 0.87 (0.64–1.19) 0.393
3 372 37.3 62.7 0.87 (0.64–1.18) 0.359 0.95 (0.69–1.31) 0.754
2 311 37.3 62.7 0.87 (0.63–1.20) 0.398 0.93 (0.67–1.29) 0.655
1 Least deprived 324 40.7 59.3 1.00 1.00
Smoker status
No 1239 37.1 62.9 1.00 1.00
Yes 611 39.3 60.7 1.09 (0.90–1.34) 0.375 0.96 (0.77–1.20) 0.700
Mean (SD) Mean (SD)
Age* 46.8 (16.9) 48.5 (16.4) 0.99 (0.99–1.00) 0.031 1.00 (1.00–1.01) 0.757
No. of health conditions linked to heavy drinking*c
4.4 (1.5) 3.9 (1.7) 1.23 (1.16–1.31) <0.001 1.20 (1.13–1.28) <0.001
AUDIT C score* 5.2 (2.8) 4.4 (2.7) 1.10 (1.06–1.14) <0.001 1.10 (1.06–1.14) <0.001
OR=odds-ratios; AOR=adjusted odds-ratios; 95% CI=95% confidence interval; SD=standard deviation. *OR/AOR per year/unit of increase. aCell count totals may vary compared to overall sample size due to rounding.
bMissing IMD cases (n=19) are not presented here and were excluded from logistic regressions.
cTotal number of reported conditions linked to drinking too much out of the following six conditions: cancer, heart disease, diabetes, high cholesterol, liver
dis-ease, being overweight or obese.
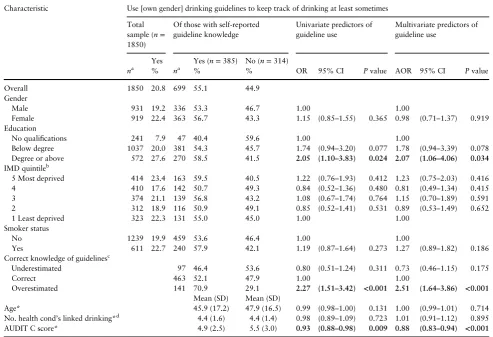
Self-reported use of drinking guidelines was associated with a degree or higher level of education, overestimation of the guidelines and higher AUDIT-C scores at the univariate level (Table 5) and these associations remained significant in the multivariate analysis (Table5). Those with at least a degree level education compared to those with no qualifications were 2.07 times (95% CI [1.06–4.06]) more likely to report using their own-gender guideline to track their own drinking. Those who overestimated their own-gender guideline daily limit were 2.51 (95% CI [1.64–3.86]) times more likely to report using their guideline compared to those who had accurate knowledge. Those with a higher AUDIT-C score were significantly less likely to report using their own-gender guidelines. Unlike self-reported knowledge, the number of health conditions self-reported as alcohol related was not a predictor of actually using the guidelines to monitor drinking.
DISCUSSION
In the context of the publication of new UK lower risk weekly drink-ing guidelines, ourfindings regarding knowledge and use of the pre-vious daily guidelines are relevant to those with an interest in or responsibility for their promotion. Despite the previous UK drinking guidelines being in place for 20 years (House of Commons Science and Technology Committee, 2012) (including promotion through various media including product labelling, TV, radio and print pub-lic information campaigns, health professionals contacts with
patients and point-of-sale advertising), among people who drink (i.e. AUDIT C score >0), only about a quarter of people in our study were able to provide a correct estimate of how many units it was recommended their gender should not exceed in a day. Thisfinding indicates lower levels of awareness than in 2009 (Office for National Statistics, 2010), suggesting previous efforts to raise aware-ness of recommended drinking limits have not had lasting effect.
[image:5.612.68.551.76.355.2]We further identified characteristics significantly associated with those who think they know, actually do know, and use their own-gender drinking guidelines. Being female, better educated, able to identify more alcohol-related health conditions and consuming more alcohol (as measured by AUDIT C) were all significantly and posi-tively associated with not only claiming to know the drinking guidelines, but also in providing an accurate correct gender-specific estimate of the recommended daily maximum number of units (as they were at the time this study was conducted) compared to not providing an estimate. The same variables, excepting identification of alcohol-related health conditions, were also associated with pro-viding a correct guideline estimate compared to an underestimate. However, when those who claimed to know the guidelines were then asked whether or not they used them to self-monitor their own drinking, only having the highest level of education (i.e. degree or above) remained a positive predictor of guideline use, while unsur-prisingly, those who drank at higher levels were significantly less likely to report using guidelines to keep track of their drinking. Unexpectedly, those who overestimated their own-gender guideline Table 2.Accuracy of guideline knowledge: frequencies (N=1850)
Characteristic na Estimated number of alcohol units it is recommended that [own gender] should not
exceed in a day
No estimate (n=1151)
Underestimate (n=96)d
Accurate estimate (n=463)d
Overestimate (n=140)d
% % % %
Overall 1850 62.2 5.2 25.0 7.6
Gender
Male 931 63.8 5.9 22.3 7.9
Female 919 60.5 4.5 27.7 7.3
Education
No qualifications 241 80.1 4.6 11.6 3.7
Below degree 1037 63.3 6.1 24.3 6.4
Degree or above 572 52.8 4.0 31.8 11.4
IMD quintileb
5 Most deprived 414 60.6 4.8 24.4 10.1
4 410 65.1 4.4 21.2 9.3
3 374 62.6 7.5 25.1 4.8
2 312 62.5 5.4 25.0 7.1
1 Least deprived 323 59.4 4.3 29.7 6.5
Smoker status
No 1239 63.0 5.3 25.6 6.1
Yes 611 60.7 4.9 23.7 10.6
Mean (SD) Mean (SD) Mean (SD) Mean (SD)
Age 48.5 (16.4) 48.2 (17.3) 47.6 (16.9) 43.4 (16.5)
No. of health conditions linked to heavy drinkingc 3.9 (1.7) 4.3 (1.5) 4.4 (1.4) 4.4 (1.7)
AUDIT C score 4.4 (2.7) 4.2 (2.7) 5.1 (2.6) 5.9 (3.0)
SD=standard deviation.
aCell count totals vary compared to overall sample size due to rounding. bMissing IMD cases (n
=19) are not presented here.
cTotal number of reported conditions linked to drinking too much out of the following six conditions: cancer, heart disease, diabetes, high cholesterol, liver
dis-ease, being overweight or obese. dUnderestimate
Table 3.Accuracy of guideline knowledge: univariate analysis of predictors of accuracy in estimating own-gender drinking guidelines (N=1850)
Characteristic No estimate vs accurate
estimatec
Underestimate vs accurate estimatec
Overestimate vs accurate estimatec
OR 95% CI Pvalue OR 95% CI Pvalue OR 95% CI Pvalue
Gender
Male 1.00 1.00 1.00
Female 0.76 (0.62–0.95) 0.015 0.62 (0.40–0.96) 0.033 0.74 (0.51–1.08) 0.116
Education
No qualifications 1.00 1.00 1.00
Below degree 0.38 (0.25–0.58) <0.001 0.66 (0.31–1.41) 0.286 0.84 (0.38–1.88) 0.673
Degree or above 0.24 (0.16–0.38) <0.001 0.34 (0.15–0.77) 0.01 1.15 (0.51–2.57) 0.738
IMD quintilea
5 Most deprived 1.24 (0.89–1.74) 0.203 1.33 (0.63–2.79) 0.452 1.85 (1.03–3.35) 0.041
4 1.54 (1.09–2.18) 0.014 1.40 (0.65–2.99) 0.388 1.97 (1.08–3.60) 0.028
3 1.25 (0.89–1.76) 0.199 2.03 (1.01–4.11) 0.048 0.85 (0.43–1.70) 0.643
2 1.26 (0.88–1.81) 0.207 1.48 (0.68–3.20) 0.319 1.29 (0.66–2.51) 0.451
1 Least deprived 1.00 1.00 1.00
Smoker status
No 1.00 1.00 1.00
Yes 1.04 (0.83–1.31) 0.727 0.98 (0.61–1.58) 0.935 1.87 (1.27–2.75) 0.001
Age* 1.00 (1.00–1.01) 0.288 1.00 (0.99–1.02) 0.746 0.99 (0.97–1.00) 0.010
No. of health conditions linked to heavy drinking*b 0.80 (0.74–0.86) <0.001 0.95 (0.82–1.10) 0.514 0.96 (0.85–1.10) 0.575
Audit score* 0.91 (0.88–0.95) <0.001 0.88 (0.81–0.96) 0.003 1.09 (1.02–1.16) 0.012
OR=odds-ratios; 95% CI=95% confidence interval; SD=standard deviation. *OR per year/unit of increase. aMissing IMD cases (n
=19) were excluded from the logistic regression. Analyses were conducted only on valid cases where the outcome variable and all pre-dictor variables are non-missing.
bTotal number of reported conditions linked to drinking too much out of the following six conditions: cancer, heart disease, diabetes, high cholesterol, liver
dis-ease, being overweight or obese.
[image:6.612.66.549.412.654.2]cUnderestimate=men<3 units, women<2 units; accurate estimate=men 3–4 units, women 2–3 units; overestimate=men>4 units, women>3 units. Table results shown in bold are significant (P<0.05).
Table 4.Accuracy of guideline knowledge: multinomial analysis of predictors of accuracy in estimating own-gender drinking guidelines (N=1831a)
Characteristic No estimate vs accurate
estimatec
Underestimate vs accurate estimatec
Overestimated vs accurate estimatec
AOR 95% CI Pvalue AOR 95% CI Pvalue AOR 95% CI Pvalue
Gender
Male 1.00 1.00 1.00
Female 0.70 (0.55–0.88) 0.002 0.51 (0.32–0.82) 0.005 0.79 (0.53–1.18) 0.256
Education
No qualifications 1.00 1.00 1.00
Below degree 0.43 (0.28–0.66) <0.001 0.72 (0.33–1.60) 0.425 0.79 (0.34–1.82) 0.580
Degree or above 0.28 (0.18–0.45) <0.001 0.39 (0.16–0.95) 0.037 1.10 (0.47–2.58) 0.830
IMD quintile
5 Most deprived 1.01 (0.70–1.45) 0.968 1.24 (0.57–2.68) 0.589 1.50 (0.81–2.77) 0.200
4 1.33 (0.93–1.90) 0.122 1.30 (0.60–2.81) 0.509 1.75 (0.94–3.23) 0.076
3 1.12 (0.79–1.60) 0.518 1.90 (0.93–3.88) 0.079 0.79 (0.39–1.59) 0.505
2 1.17 (0.81–1.69) 0.411 1.34 (0.63–2.98) 0.431 1.28 (0.65–2.50) 0.479
1 Least deprived 1.00 1.00 1.00
Smoker status
No 1.00 1.00 1.00
Yes 1.16 (0.89–1.50) 0.274 1.06 (0.63–1.78) 0.837 1.54 (1.01–2.33) 0.045
Age* 1.00 (0.99–1.00) 0.299 1.00 (0.98–1.01) 0.544 0.99 (0.98–1.00) 0.068
No. of health conditions linked to heavy drinking*b 0.82 (0.77–0.89) <0.001 0.98 (0.84–1.14) 0.757 0.96 (0.85–1.09) 0.558
Audit score* 0.90 (0.86–0.94) <0.001 0.86 (0.79–0.94) 0.001 1.05 (0.98–1.13) 0.194
AOR=adjusted odds-ratios; 95% CI=95% confidence interval; SD=standard deviation. *AOR per year/unit of increase.
aMissing IMD cases (n=19) were excluded from the logistic regression. Analyses were conducted only on valid cases where the outcome variable and all
pre-dictor variables are non-missing.
bTotal number of reported conditions linked to drinking too much out of the following six conditions: cancer, heart disease, diabetes, high cholesterol, liver
dis-ease, being overweight or obese.
cUnderestimate=men<3 units, women<2 units; accurate estimate=men 3–4 units, women 2–3 units; overestimate=men>4 units, women>3 units.
were 2.5 times more likely to report using it to keep track of their drinking than those who provided a correct estimate, suggesting there may be a risk that some people drink more than recom-mended, but on the erroneous assumption that they are consuming within the guideline thresholds. It is of interest to understand whether this issue is now even more pronounced for males since the announcement of new guidelines, which lowered the recommended limits for men. There did not appear to be any inequality in knowl-edge or use of guidelines according to social gradient as measured by IMD, age or smoking status.
Our findings have relevance for the targeting of promotional activities around the new guidelines. The variable most strongly positively associated with knowledge and use of guidelines was level of education, which suggests that in promoting the new drinking guidelines, efforts should be made to ensure people with lower edu-cational qualifications are an explicitly identified target audience. The new guidelines may be simpler to remember than the old ones because there are no gender-specific recommendations, a single num-ber and less ambiguity around the meaning of ‘regular’. However, the fact that the recommended limits for men have changed to a greater degree than for women, when considered in conjunction with ourfinding that men were less likely than women to self-report
[image:7.612.59.553.72.409.2]knowing or to actually know the previous guidelines suggests that decisions regarding appropriate promotional avenues for the new guidelines should still take account of gender to ensure reach. That greater awareness of alcohol-related health conditions predicted self-reported knowledge of guidelines but not their use is also an import-antfinding for those designing promotional strategies for the newly released guidelines. Consistent with research regarding the effective-ness of health promotion campaigns (Babor et al., 2010; Dixon et al., 2015), this result suggests that merely understanding the potentially negative health consequences of drinking may be insuffi -cient to change behaviour, whether through reducing consumption or, as measured here, through adoption of guidelines as a self-monitoring strategy. Further, qualitative research suggested that some drinkers perceive daily drinking guidelines to be irrelevant to their drinking patterns (which may involve less frequent but more heavy consumption) and to lack credibility, particularly when their foundation or purpose is unclear to the individual (Lovattet al., 2015). It is not clear whether the new guidance will be perceived as more relevant in recommending a weekly rather than daily max-imum, albeit within reduced overall limits. Alternatively, as might be suggested by ourfinding that those who overestimated the previ-ous guidelines were more likely than those who accurately estimated Table 5.Frequency and predictors of self-reported guideline use to keep track of drinking at least sometimes (N=699)
Characteristic Use [own gender] drinking guidelines to keep track of drinking at least sometimes
Total sample (n= 1850)
Of those with self-reported guideline knowledge
Univariate predictors of guideline use
Multivariate predictors of guideline use
Yes Yes (n=385) No (n=314)
na % na % % OR 95% CI Pvalue AOR 95% CI Pvalue
Overall 1850 20.8 699 55.1 44.9
Gender
Male 931 19.2 336 53.3 46.7 1.00 1.00
Female 919 22.4 363 56.7 43.3 1.15 (0.85–1.55) 0.365 0.98 (0.71–1.37) 0.919
Education
No qualifications 241 7.9 47 40.4 59.6 1.00 1.00
Below degree 1037 20.0 381 54.3 45.7 1.74 (0.94–3.20) 0.077 1.78 (0.94–3.39) 0.078
Degree or above 572 27.6 270 58.5 41.5 2.05 (1.10–3.83) 0.024 2.07 (1.06–4.06) 0.034
IMD quintileb
5 Most deprived 414 23.4 163 59.5 40.5 1.22 (0.76–1.93) 0.412 1.23 (0.75–2.03) 0.416
4 410 17.6 142 50.7 49.3 0.84 (0.52–1.36) 0.480 0.81 (0.49–1.34) 0.415
3 374 21.1 139 56.8 43.2 1.08 (0.67–1.74) 0.764 1.15 (0.70–1.89) 0.591
2 312 18.9 116 50.9 49.1 0.85 (0.52–1.41) 0.531 0.89 (0.53–1.49) 0.652
1 Least deprived 323 22.3 131 55.0 45.0 1.00 1.00
Smoker status
No 1239 19.9 459 53.6 46.4 1.00 1.00
Yes 611 22.7 240 57.9 42.1 1.19 (0.87–1.64) 0.273 1.27 (0.89–1.82) 0.186
Correct knowledge of guidelinesc
Underestimated 97 46.4 53.6 0.80 (0.51–1.24) 0.311 0.73 (0.46–1.15) 0.175
Correct 463 52.1 47.9 1.00 1.00
Overestimated 141 70.9 29.1 2.27 (1.51–3.42) <0.001 2.51 (1.64–3.86) <0.001
Mean (SD) Mean (SD)
Age* 45.9 (17.2) 47.9 (16.5) 0.99 (0.98–1.00) 0.131 1.00 (0.99–1.01) 0.714
No. health cond’s linked drinking*d 4.4 (1.6) 4.4 (1.4) 0.98 (0.89–1.09) 0.723 1.01 (0.91–1.12) 0.895
AUDIT C score* 4.9 (2.5) 5.5 (3.0) 0.93 (0.88–0.98) 0.009 0.88 (0.83–0.94) <0.001
OR=odds-ratios; AOR=adjusted odds-ratios; 95% CI=95% confidence interval; SD=standard deviation. *OR/AOR per unit/year increase. aCell count totals vary due to rounding.
bMissing IMD cases (n=8) excluded from regression analyses.
cUnderestimated (males<3 units; females<2 units); correct (males 3–4 units; females 2-3 units); overestimated (males>4.5 units, females>3 units). dTotal number of reported conditions linked to drinking too much out of: cancer, heart disease, diabetes, high cholesterol, liver disease, being overweight or obese.
them to report using guidelines to keep track of their drinking, the new guidelines might be perceived as less relevant given their more conservative recommendations.
Our study used an online survey methodology and those who opt to participate in such panels may differ from the general population in important ways that we are unable to detect. However, our robust method of quota sampling with additional adjustment through weight-ing to improve representation related to education has ensured a nationally representative sample with respect to core socio-demographic variables. Levels of survey uptake and completion were also positive for this type of study. A commonly faced alcohol research problem is the potential for inaccuracies in self-reported alcohol use, whether by social desirability or incorrect understanding of what is meant by an alcohol‘unit’(Kerr and Stockwell, 2013). To address this potential limitation, which may have also affected estimations of own-gender guidelines, participants were at relevant points in the survey provided with a diagram showing how many alcohol units are in drinks of different size and strength to aid them in their responses.
The low levels of knowledge of previous guidelines found in this study suggest plenty of scope to increase public awareness. Teaching drinkers with unit-marked glasses was found to increase their under-standing of guidelines but not alter their consumption (de Visser et al., 2017). While we are aware of some dissemination channels for the previous UK drinking guidelines, such as health promotion materials, we do not have any quantifiable information regarding their active promotion over time. Current research by some of our team aims to document regional and national level actions to pro-mote the new UK guidelines over time. Future monitoring of guide-line awareness may be able to utilize this information to better understand the population level effect of active promotion.
CONCLUSION
Twenty years after their introduction in 1995, only a minority of people in England could accurately estimate the UK drinking guidelines, and even fewer used them for the purpose of monitoring their own alcohol consumption.
ACKNOWLEDGEMENTS
This research was funded by the Policy Research Centre for Cancer Prevention, Cancer Research UK. We would like to thank the Policy and Information Patient Sounding Board at Cancer Research UK who took part in developing and testing the survey. We would also like to thanks Melanie Lovatt and Petra Meier for their contribution to the development of the survey instrument. The authors are solely responsible for the content of the paper. J.L. and L.G. were employed by University of Sheffield at the time the research was conducted.
CONFLICT OF INTEREST STATEMENT
None to declare.
REFERENCES
Anderson P, Chisholm D, Fuhr DC. (2009) Alcohol and Global Health 2 Effectiveness and cost-effectiveness of policies and programmes to reduce the harm caused by alcohol.Lancet373:2234–46.
Babor TF, Caetano R, Casswell S, et al. (2010) Alcohol: No Ordinary Commodity. Research and Public Policy. Oxford: Oxford University Press.
Bush K, Kivlahan D, McDonnell M,et al. (1998) The AUDIT alcohol con-sumption questions (AUDIT-C): an effective brief screening test for prob-lem drinking.Arch Intern Med158:1789–95.
Buykx P, Gilligan C, Ward B,et al. (2015) Public support for alcohol policies associated with knowledge of cancer risk.Int J Drug Policy26:371–79. Casswell S. (2012) Why have guidelines at all? A critical perspective.Drug
Alcohol Rev31:151–52.
de Visser RO, Birch JD. (2012) My cup runneth over: young people’s lack of knowledge of low-risk drinking guidelines.Drug Alcohol Rev31:206–12. de Visser RO, Brown C, Cooke R,et al. (2017) Using alcohol unit-marked glasses enhances capacity to monitor intake: evidence from a mixed-method intervention trial.Alcohol Alcohol52:206–12.
Department for Communities and Local Government. (2015) The English Indices of Deprivation 2015 - Frequently Asked Questions (FAQs). Department of Health. (2016) UK Chief Medical Officers’Alcohol Guidelines
Review: Summary of the proposed new guidelines.
Dixon H, Pratt I, Scully M,et al. (2015) Using a mass media campaign to raise women’s awareness of the link between alcohol and cancer: cross-sectional pre-intervention and post-pre-intervention evaluation surveys.BMJ Open5:e006511. Gill J, May F. (2007) How‘sensible’is the UK Sensible Drinking message?
Preliminaryfindings amongst newly matriculated female university stu-dents in Scotland.J Public Health (Bangkok)29:13–6.
Grøenæk M, Strøger U, Strunge H,et al. (2001) Impact of a 10-year nation-wide alcohol campaign on knowledge of sensible drinking limits in Denmark.Eur J Epidemiol17:423–7.
Health and Social Care Information Centre. (2015) Statistics on Alcohol: England, 2015.
Heather N. (2012) Drinking guidelines are essential in combating alcohol-related harm: comments on the new Australian and Canadian guidelines.
Drug Alcohol Rev31:153–55.
HM Government. (2012) The Government’s Alcohol Strategy, Report Cm 8336. London: TSO.
Hosmer D, Lemeshow S, Sturdivant R. (2013)Applied Logistic Regression. New York: Wiley.
House of Commons Science and Technology Committee. (2012) Alcohol Guidelines, Eleventh Report of Session 2010–12 (HC 1536). London: The Stationery Office.
International Center for Alcohol Policies. (2003) ICAP Report 14 International Drinking Guidelines: ICAP.
Kalinowski A, Humphreys K. (2016) Governmental standard drink defi ni-tions and low-risk alcohol consumption guidelines in 37 countries.
Addiction111:1293–8.
Kerr WC, Stockwell T. (2013) Understanding standard drinks and drinking guidelines.Drug Alcohol Rev31:200–05.
Livingston M. (2012) Perceptions of low-risk drinking levels among Australians during a period of change in the official drinking guidelines.
Drug Alcohol Rev31:224–30.
Lovatt M, Eadie D, Meier PS,et al. (2015) Lay epidemiology and the inter-pretation of low risk drinking guidelines by adults in the United Kingdom.Addiction110:1912–9.
Marteau TM. (2016) Will the UK’s new alcohol guidelines change hearts, minds—and livers?BMJ352:i704.
Office for National Statistics. (2010) Opinions Survey Report No. 42 Drinking: adults’behaviour and knowledge in 2009.
Office for National Statistics. (2014) Local Area Analysis of Qualifications Across England and Wales.
Rehm J, Patra J. (2012) Different guidelines for different countries? On the scientific basis of low-risk drinking guidelines and their implications.
Drug Alcohol Rev31:156–61.
Room R, Rehm J. (2012) Clear criteria based on absolute risk: reforming the basis of guidelines on low-risk drinking.Drug Alcohol Rev31:135–40. UK Government. (2015) English Indices of Deprivation, Vol. 2016. Webster‐Harrison PJ, Barton AG, Sanders HP,et al. (2002) Alcohol
aware-ness and unit labelling.J Public Health (Bangkok)24:332–33.