Int. J. Electrochem. Sci., 7 (2012) 3306 - 3313
International Journal of
ELECTROCHEMICAL
SCIENCE
www.electrochemsci.org
Characterization of a New Ag
+-Selective Electrode with Lower
Detection Limit
Shenggang Sang, Chunwei Yu, Na Li, Yuxiang Ji, Jun Zhang*
School of Tropical and Laboratory Medicine, Hainan Medical University, Haikou 571101, China
*
E-mail: [email protected]
Received: 8 March 2012 / Accepted: 23 March 2012 / Published: 1 April 2012
An Ag+-selective electrode based on thiaazacrown ether as ionophore with lower detection limit was prepared. The ion flux was decreased by controlling concentration of primary ion in inner solution according to the solubility product constant of AgCl. With the optimal composition of membrane, this electrode has a good Nernst response of 60.0 mV/decate in the linear range of 1.0 × 10⁻⁹ – 1.0 × 10⁻⁵ M with a lower detection limit of 2.9 × 10⁻¹⁰ M Ag+. The electrode can be used as indicator sensor for the potentiometric titration of mixture solution of Cl-, Br- and I-.
Keywords: Ion-selective electrode, Silver ion, Thiaazacrown ether, Lower detection limit
1. INTRODUCTION
Silver is very important for many industrial processes and plays important roles in biology. Despite the importance of this metal in such fields, a major problem is the subsequent pollution of the environment that comes with its frequent use. Silver ion (Ag+) is not known to be a cumulative toxin, but does interact with and displace essential metal ions like Ca2+ and Zn2+ in hydroxyapatite in bone. Excessive Ag+ intake can lead to the long-term accumulation of insoluble precipitates in the skin and eyes [1]. Thus, it’s urgent to develop simple and convenient methods to detect Ag+. Accordingly, the recognition and sensing of Ag+ has also been an especially active research area [2-3].
lack of certified references for extreme trace levels of metals in different materials [4]. Ion-selective electrodes (ISEs) are most frequently used potentiometric sensors for heavy metals due to high selectivity, good precision, low cost and simplicity [5,6]. Recently, there is a rapid development both in theory and in practice since the ion-flux was found to be the decisive factor of the detection limit of ISEs [7], many methods have been proposed to eliminate this effect and ISEs with lower detection limits have been used for the detection of many cations [8-12]. In this work, a new Ag+-ISE with lower detection limit was prepared. The ion-flux across membrane was eliminated by controlling the concentration of Ag+ with Cl- according to the solubility product constant of AgCl.
2. EXPERIMENTAL
2.1. Reagents and Instrumentations
2, 2’-thiodiethanethiol, poly (vinyl chloride) (PVC), tetraethylammonium nitrate (Et4NNO3),
sodium tetrakis [3, 5-bis (trifluoromethyl)phenyl]borate (NaTFPB) and 2-nitrophenyl octyl ether (o-NPOE) were purchased from Sigma-Aldrich. All other reagents used were purchased from Sinopharm Chemical Reagent and of analytical grade purity or better. Deionized water with specific resistance of 18.2 MΩ cm was obtained by a Pall Cascada laboratory water system and was used throughout.
Melting points were measured on an electro-thermal apparatus. IR spectra (KBr) were recorded on a Perkin–Elmer 1430 spectrometer. Nuclear magnetic resonance (NMR) spectra were measured with Brucker AVIII-500 spectrometer and chemical shift were given in ppm from tetramethylsilane (TMS). Mass (MS) spectra were recorded on a Thermo TSQ Quantum Access Agillent 1100. Elemental analysis was measured on Elementar Vario Micro III.
2.2. Synthesis of ionophore 9, 10, 12, 13, 15, 17, 23, 24, 25, 26-decahydrodibenzo[b, q][1, 7, 10, 13, 19, 4, 16]-pentathiadiazacyclotricosine-6, 16 (5H, 7H)-dione L
The synthesis route of L was shown in Scheme 1:
Scheme1. Synthesis route of ionophore L.
Compounds 2 and 3 were synthesized as reported method [8,13].
anhydrous Na2CO3 (4 mmol). The whole process was operated under nitrogen atmosphere with
vigorously stir overnight. The resulting mixture was filtered off and the solvent was poured into cold water (500 mL). The mixture was stirred vigorously and the precipitate so obtained was filtrated. The remaining residue was washed in turn with water, ethanol and diethyl ether, and then dried in vacuum. Yields: 92.3 %. M.P.: 180.3-181.0 oC. MS: m/z 539.1 [M+1]+. IR (KBr tablet, cm-1): 3274.5 (N-H), 2920.7 (Ar-H), 1673.9 (C=O), 1578.4, 1521.6, 1430.0, 1406.8, 769.5. 1H NMR (δ: ppm, CDCl3): 9.81
(s, 2H), 8.37 (d, 2H, J = 8.0), 7.48 (d, 2H, J = 7.6), 7.33 (t, 2H, J = 14.8), 7.08 (t, 2H, J = 14.4), 3.45 (s, 4H), 2.90 (t, 4H, J = 4.0), 2.87 (t, 4H, J = 5.6), 2.84 (t, 4H, J = 7.2), 1.74 (t, 4H, J = 7.2). 13C NMR (δ: ppm, CDCl3): 166.71, 138.79, 134.46, 129.44, 124.62, 123.64, 120.28, 37.95, 35.89, 33.85, 32.04,
28.78.
Found (Calcd.) for C24S5N2O2H30 (538.83): C, 53.47 (53.50); H, 5.62 (5.61); O, 19.00 (18.98);
N, 5.25 (5.20).
2.3. Membrane preparation
The membrane components (totaling 250 mg) were dissolved in 3.0 mL of THF and shaken vigorously for at least 2 h, and then poured into a glass ring (30 mm i.d.) fixed on a glass plate. The solvent was allowed to evaporate overnight at room temperature to give a transparent membrane of 180 µm thickness. For each ISE, a disk of 7 mm diameter was punched from the membranes and glued to a plasticized PVC tube (i.d. 6 mm, o.d. 9 mm) with THF/PVC slurry. Electrodes for the lower detection limit detection were conditioned for 4 days in 1.0 × 10⁻⁵ M AgNO3 with 1.0 × 10⁻⁴ M
NaCl/1.0 × 10−5 M AgNO3 as inner solution. For long-term measurements, the electrodes were
conditioned in 1.0× 10⁻⁷ M AgNO3.
2.4. Potential measurements
Activity coefficients were calculated according to the Debye–Hückel approximation and electromotive force (EMF) values were corrected for liquid-junction potentials with the Henderson equation. The reference electrode Hg/Hg2Cl2 with double junction was used with 1.0 M LiOAc as salt
bridge electrolyte. Membrane potentials were measured with a Model PXSJ-216 digital ion analyzer (Shanghai Instruments) in magnetically stirred solution at room temperature in the galvanic cell:
SCE/1.0 M LiOAc/sample solution/ISE membrane/inner solution/AgCl/Ag
2.5. Selectivity measurements
The electrodes using 1.0 × 10⁻³ M NaCl as inner filling solution were conditioned in 1.0 × 10⁻² M NaNO3 overnight. Measurements were made in the respective nitrate solutions. The sequence of the
were done in triplicate. The selectivity coefficients were calculated from the EMF values according to the separate solution method assuming theoretical slopes.
3. RESULTS AND DISCUSSION
3.1. Influence of membrane composition
The sensitivity, selectivity, working range and stability of an ISE depend on many factors, such as the nature of the ionophore, the addition of ion-exchanger and the polarity of various plasticizers [14,15]. Therefore, membranes with different compositions have been prepared and their potentiometric response characteristics were evaluated. The effect of plasticizers on Ag+-selective electrodes based on different crown ethers is shown in Table 1.
Table 1. EMF responses of ISEs with ionophore L based on different plasticizersa.
Plasticizers EMFb/ mV ⊿EMF / mV
Blank 1.0 × 10⁻⁵ M Ag+
DOP 48.2 ± 0.1
50.1 ± 0.3 59.3 ± 0.4
132.1 ± 0.2 442.1 ± 0.2 438.0 ± 0.5
83.9 392.0 378.7 DBP
DOS
o-NPOE 43.5 ± 0.2 561.9 ± 0.3 518.4
a
Inner filling solution: 1.0 × 10⁻³ M NaCl; conditioning solution: 1.0 × 10⁻² M NaNO3. b
Average value of three determinations ± standard deviation.
It is clear that o-NPOE is more effective plasticizer than others in preparing the Ag+-ISEs, which can be explained by the fact that o-NPOE plasticized PVC membranes have much higher dielectric constants than DOS, DBP and DOP based membranes. In addition, o-NPOE plasticized the membranes dissolve the ion association complexes and adjust both permittivity and ion exchanger sites mobility to give highest possible selectivity and sensitivity.
Table 2. EMF responses of ISEs with ionophore L based on different L-NaTFPB molar ratiosa.
Molar ratio EMFb/ mV ⊿EMF / mV
Blank 1.0 × 10⁻⁵ M Ag+
2:1 59.5 ± 0.3
52.3 ± 0.3 43.5 ± 0.2
136.5 ± 0.4 154.6 ± 0.2 561.8 ± 0.3
77.0 102.3 518.3 3:1
4:1
a
Inner filling solution: 1.0 × 10⁻³ M NaCl; conditioning solution: 1.0 × 10⁻² M NaNO3. b
As we all known, lipophilic anionic additives (NaTFPB) can act as a charge compensating counter ion in the membrane and thus facilitate the process of ion charge transduction [8]. Accordingly, the effects of the amount of NaTFPB in Ag+-selective membranes on the electrode characteristics were also investigated. The amount of NaTFPB was altered while maintaining the same amounts of ionophore, PVC and plasticizer (o-NPOE) in the membranes (Table 2). The results show that the electrode based on ionophore L and NaTFPB in a mole ratio of 4:1 present the best potential responses, which indicates that compound L form complex with Ag+ in a mole ratio of 2:1 in membrane phase.
3.2. Potentiometric selectivity of silver electrodes
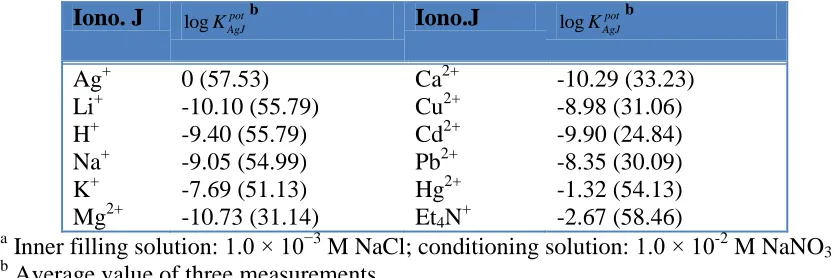
The influence of interfering ions on the response behavior of the ISE is usually described in terms of selectivity coefficients. The selectivity coefficients, log pot
AgJ
K , of Ag+-ISE were determined by
[image:5.596.86.503.438.577.2]using Bakker’s method to eliminate the influence of the inherent sensitivity limit on the response toward discriminated ions [16]. Table 3 shows the selectivity coefficients of Ag+-ISE based on L. It can be seen that the electrode based on L gives the best selectivity and sensitivity toward Ag+ than other cations.
Table 3. Potentiometric selectivity coefficients, log pot AgJ
K , and response slope obtained with the separate
solution method for o-NPOE-PVC (2:1) membranes based on ionophore La Iono. J log pot
AgJ
K b Iono.J log pot
AgJ K b Ag+ Li+ H+ Na+ K+ Mg2+ 0 (57.53) -10.10 (55.79) -9.40 (55.79) -9.05 (54.99) -7.69 (51.13) -10.73 (31.14) Ca2+ Cu2+ Cd2+ Pb2+ Hg2+ Et4N+
-10.29 (33.23) -8.98 (31.06) -9.90 (24.84) -8.35 (30.09) -1.32 (54.13) -2.67 (58.46) a
Inner filling solution: 1.0 × 10⁻³ M NaCl; conditioning solution: 1.0 × 10⁻² M NaNO3. b
Average value of three measurements.
3.4. Characteristics of the L-based Ag+-ISE
[image:6.596.183.412.148.330.2]
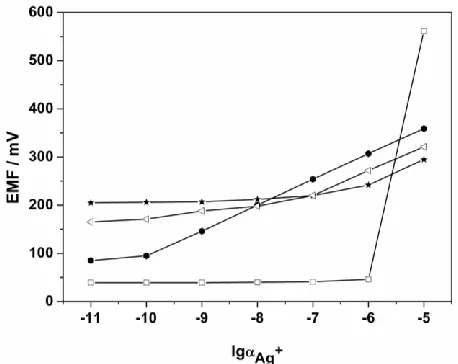
alternative approach using precipitation method according to the solubility product constant (Ksp) of AgCl to control the concentration of free Ag+ in the inner solution. The response curves for ISEs with different inner solutions are shown in Fig. 1.
Figure 1. Electrodes based on ionophore L with different inner solutions: (□) 1.0 × 10⁻³ M NaCl, (★) 1.0 × 10⁻²
M NaCl with 1.0 × 10⁻⁵ M AgNO3, (▽) 1.0 × 10⁻³ M NaCl with 1.0 × 10⁻⁵ M
AgNO3, and (●) 1.0 × 10⁻⁴ M NaCl with 1.0 × 10⁻⁵ M AgNO3.
For traditional ISE with 0.1 M AgNO3 as inner solution, a concentration gradient from the
inner solution toward the sample solution induces an enhanced primary ion concentration at the ISE membrane surface, so that lower detection limit cannot be achieved. On the other hand, the ISE conditioned in NaCl, with a strong flux of primary ions caused by the replacement of the primary ions in the membrane with the interfering ions (i.e., Na+) due to ion exchange, exhibits the apparently super-Nernstian response in the range of 10−5 to 10−6 M, which could also deteriorate the lower detection limit. However, our experiments show that the lower detection limit can be improved when using NaCl/AgNO3 mixture as inner solution. Indeed, the presence of Cl− can lead to the precipitation
of AgCl, thus decreasing the concentration of free Ag+. For instance, the concentration of free Ag+ in the inner solution of 1.0 × 10⁻⁵ M AgNO3 with 1.0 × 10⁻⁴ M NaCl, calculated according to the
solubility product constant (Ksp), is about 10−6 M. By using such precipitation buffer solution as inner solution of ISE, a concentration gradient of primary ions decreasing toward the inner solution can be built up, which could prevent the leaching of primary ions toward the sample solution and thus improve the detection limit. Detailed experiments have shown that the ISEs conditioned for 4 days in 1.0 × 10⁻⁵ M AgNO3 with 1.0 × 10⁻⁴ M NaCl/1.0 × 10-5 M AgNO3 as the inner solution can give the
Figure 2. Potentiometric EMF response of the lower detection limit Ag+-ISE based on L. Insert shows the working range.
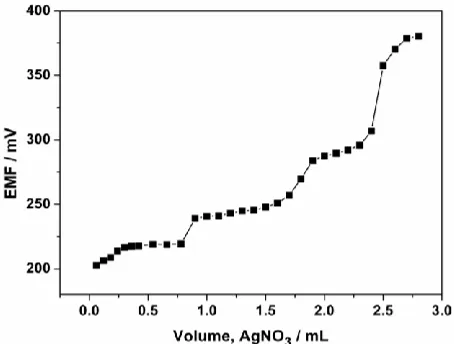
3.4. Titration of the mixture solution of Cl−, Br− and I− ions
Due to the large difference between the Ksp values of AgI, AgBr, and AgCl (8.5 × 10⁻¹⁷, 5.4 × 10⁻¹³ and 1.8 × 10⁻¹⁰, respectively), it is theoretically possible to potentiometrically titrate the mixture of iodide, bromide and chloride ions in one experiment [8]. The proposed electrode was used as an indicator electrode for the titration of the mixture of Cl−, Br− and I− ions.
Figure 3. Titration curve of the 50 mL mixture of Cl-, Br- and I- with 0.1 M AgNO3 as titration reagent
obtained by using Ag+-ISE based on ionophore L. The concentration of each ion was 2.0 × 10⁻³
M.
Titration curve of the mixture of 2.0 × 10⁻³ M KI, KBr and KCl with 0.1 M AgNO3 is
[image:7.596.185.412.430.602.2]
curve for each halogen. Therefore, the end-point and the amount of three halogen ions in a solution can be accurately potentiometrically determined by using this electrode.
4. CONCLUSIONS
A new Ag+-ISE with lower detection limit was prepared. The ion-flux through the membrane was eliminated by the precipitation method, this sensor showed a wide linear range of 1.0 × 10⁻⁹ – 1.0 × 10⁻⁵
M with a detection limit of 2.9 × 10⁻¹⁰ M Ag+.
ACKNOWLEDGEMENTS
This work was financially supported by the Research and Training Fundation of Hainan Medical University (No. HY2010-004) and the National Natural Science Foundation of China (No. 21007087).
References
1. A. Ceresa, A. Radu, S. Peper, E. Bakker, E. Pretsch, Anal. Chem., 74 (2002) 4027. 2. C.W. Yu, J. Zhang, M.Y. Ding and L.X. Chen, Anal. Methods, 4 (2012) 342.
3. J. Zhang, C.W. Yu, G. Lu, Q.Y. Fu, N. Li and Y.X. Ji, New J. Chem., 36 (2012) 819.
4. S.J. Wu, J. Zhang, W.J.Lu, H.Y. Zhang, D.Z. Shen, D.W. Pan, Int. J. Electrochem. Sci., 7 (2012) xx.
5. E. Bakker and E. Pretsch, Angew. Chem. Int. Ed. Engl., 46 (2007) 5660.
6. M. Zhang, X. Wu, Y.Q. Chai, R. Yuan and G.R. Ye, J. Chin. Chem. Soc., 55 (2008) 1345. 7. T. Sokalski, A. Ceresa, T. Zwickl and E. Pretsch, J. Am. Chem. Soc., 119 (1997) 11347. 8. J. Zhang, J. W. Ding, T. J. Yin, X. F. Hu, S. Y. Yu, W. Qin, Talanta, 81 (2010) 1056.
9. Z. Szigeti, A. Malon, T. Vigassy, V. Csokai, A. Grün, K. Wygladacz, N. Ye, C. Xu, V.J. Chebny, I. Bitter, R. Rathore, E. Bakker, E. Pretsch, Anal. Chim. Acta, 572 (2006), 1.
10.E. Bakker and E. Pretsch, Trends Anal. Chem., 24 (2005) 199.
11.L. Höfler, I. Bedlechowicz, T. Vigassy, R. Gyurcsányi, E. Bakker, E. Pretsch, Anal. Chem., 81 (2009) 3592.
12.A. Malon, T. Vigassy, E. Bakker, E. Pretsch, J. Am. Chem. Soc., 128 (2006), 8154. 13.J. Zhang, S.Y. Yu, T.J. Yin, X.F. Hu and W. Qin, Chin. Chem. Lett., 21 (2010) 464. 14.J. Zhang, J.W. Ding and W. Qin, J. Chil. Chem. Soc., 56 (2011) 580.
15.R. Eugster, T. Rosatzin, B. Rusterholz, B. Aebersold, U. Pedrazza, D. Rüegg, A. Schmid, U.E. Spichiger, W. Simon, Anal. Chim. Acta, 289 (1994) 1.
16.E. Bakker, J. Electrochem. Soc., 143 (1996) L83.
17.A. Radu, S. Peper, E. Bakker and D. Diamond, Electroanalysis, 19 (2007) 144.
18.Z. Szigeti, I. Bitter, K. Toth, C. Latkoczy, D.J. Fliegel, D. Gunther and E. Pretcsh, Anal. Chim. Acta, 532 (2005) 129.