Int. J. Electrochem. Sci., 8 (2013) 7753 - 7767
International Journal of
ELECTROCHEMICAL
SCIENCE
www.electrochemsci.org
EIS Investigation and Structural Characterization of Different
Hot-Dipped Zinc-Based Coatings in 3.5% NaCl Solution
Yang Liu1,2, Hongying Li1,* and Zhenguo Li1 1
School of Materials Science and Engineering, Central South University, Changsha 410083, China 2
School of Mechanical Engineering, Xiangtan University, Xiangtan 411105, China *
E-mail: [email protected]
Received: 22 April 2013 / Accepted: 18 May 2013 / Published: 1 June 2013
Corrosion behavior of hot-dipped zinc-based coatings (pure zinc, Zn–0.25%Al and Zn–5%Al) was studied through potentiodynamic polarization test and electrochemical impedance spectroscopy in 3.5% NaCl solution. Corrosion products were analysed by means of SEM, EDS and XRD. The results reveal that Zn–5%Al coating exhibited the highest corrosion resistance. The corrosion product layer formed on Zn–5%Al coating is more compact than the other two coatings. The β phase has two different influences on the corrosion behavior: the β phase can act as a galvanic cathode to accelerate corrosion and act as a corrosion barrier to hinder corrosion.
Keywords: Zinc coating; EIS; Corrosion resistance; Microstructure
1. INTRODUCTION
The usage of zinc-based coatings for the corrosion protection of steel substrates is very widespread [1]. Firstly, the coating protects the substrate against wet corrosion by providing a layer between the steel and the corrosive elements of the environment. Secondly, the coating reacts with corrosive medium, forming a dense and adherent corrosion products film which isolates the coating from the aggressive environment. Additionally, zinc is anodic to steel on the galvanic series, as a result, zinc becomes the anode, while the steel substrate becomes the cathode and does not corrode [2-3].
zinc and a certain amounts of aluminium or other element for improving paintability and the capacity to supply galvanic protection to the steel [7].
Long term atmosphere exposures or accelerated corrosion tests are widespread used to assess the corrosion resistance of zinc coatings [8-10]. Compared with accelerated corrosion tests, long term atmosphere exposures are time consuming and region dependent, which is unfavorable for the application and promotion of new coatings. Electrochemical methods, and in particular the electrochemical impedance spectroscopy (EIS) technique, is an efficient and convincing tool for analyzing the corrosion behavior of metals [11-14]. Electrochemical methods can simulate the progress of corrosion, with instantaneous corrosion rate measurements. Furthermore, electrochemical methods can provide information on the reactions and mechanisms of electrochemical deterioration.
Up to now, a comprehensive study on corrosion behavior of zinc-based coating has been done by electrochemical methods [7, 15, 16, 19]. However, there are little studies on exploring mechanisms of electrochemical deterioration by structural characterization in scientific literature. So it is of vital importance to understand the structure evolution of corrosion products for the determination of the corrosion progress, which directly affect the electrochemical corrosion properties of zinc-based coating.
The aim of this work was to study the corrosion behavior of three zinc-based coatings in 3.5% NaCl solution, without stirring and in contact with the air. The effect of immersion time and Al concentration on corrosion resistance was monitored by potentiodynamic polarization test and electrochemical impedance spectroscopy. Furthermore, the surface and cross-section morphological characteristic of zinc-based coatings after immersion tests were investigated by scanning electron microscopy (SEM). The corrosion products of different zinc-based coatings were characterized by X-ray diffraction (XRD) and energy dispersive spectroscopy (EDS).
2. EXPERIMENTAL
2.1. Sample preparation and coatings
Mild steel specimens containing 0.11% C, 0.012% Si, 0.45% Mn, 0.016% P have been galvanized in a graphite crucible inside a laboratory electric furnace. The temperature of the galvanizing bath was set at 460±5 ℃ while the dipping time was set at 90s. Before their dipping in the galvanizing bath, the specimens of dimension 100×50×3mm were degreased in an aqueous solution containing 5% NaOH, the solution temperature was at 50 ℃, and then etched in 12% HCl solution for 20 min at room temperature. The specimens were then dipped in an aqueous solution containing 50% ZnCl2·2NH4Cl. Three types of zinc-based coating (pure zinc coating, Zn–0.25%Al coating and Zn– 5%Al coating) were investigated in this study.
2.2. Corrosion tests and experimental set-up
set-up was composed of a classic three electrode system. A platinum sheet as counter electrode was positioned parallel to the coated steel as working electrode surface, and a saturated calomel electrode (SCE) was employed as reference electrode. The medium selected for the corrosion tests was 3.5 % NaCl solution (20±1℃) in direct contact with the laboratory atmosphere.
The measurements were conducted on a ZAHNER Im6ex electrochemical workstation (Germany). The tests were normally repeated two or three times. The polarization curves were acquired in potentiodynamic regime, with a potential scanning rate of 1.5 mV/s. The measurements were carried out ranging from −500 to +700mV versus to the open-circuit potential (OCP). In order to investigate the corrosion performance of the three coatings, electrochemical impedance spectroscopy (EIS) data for various immersion times in 3.5 % NaCl solution have been obtained. All impedance data were obtained at open circuit potential (OCP) in the frequency range from 100 kHz down to 50 mHz with signal amplitude of 10 mV. The equivalent circuit simulation program (ZView2) was used for data analysis and synthesis of the equivalent circuit.
2.3. Coating microstructure analysis
Before the electrochemical tests, the microstructural characterization of the coatings was carried out by means of FEI Quanta 200 Environmental Scanning Electron Microscope (SEM) after polishing. The surface and cross-section morphological of the coatings after immersion tests was also observed using SEM. The chemical composition of the corrosion products was determined by energy dispersive spectroscopy (EDS). The phase composition of the corrosion products was analyzed using SIMENSD 500 type analyzer (XRD) operated at 40kV and 45mA. Characteristic XRD patterns were obtained within a range of diffraction angle (2θ) from 10° to 80°.
3. RESULTS AND DISCUSSION
3.1. Microstructure analysis
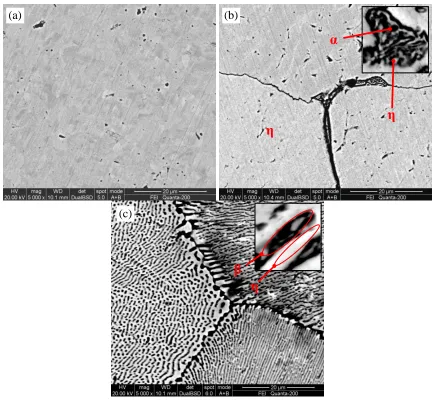
dendritic (Zn) primary crystals in a fine pearlitic eutectic matrix[15-16]. The different morphology is probably a consequence of different cooling rate after melting.
[image:4.596.81.514.128.529.2]
Figure 1. SEM micrographs of zinc-based coatings: (a) pure zinc coating; (b) Zn-0.25%Al coating; (c) Zn-5%Al coating.
3.2. Potentiodynamic polarization tests
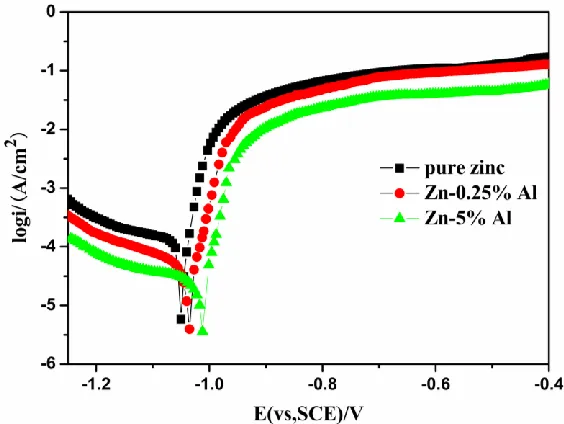
Fig. 2 illustrates the polarization curves obtained from potentiodynamic polarization tests in 3.5% NaCl solution for pure zinc, Zn–0.25%Al and Zn–5%Al coatings. The polarisation data are converted into instantaneous corrosion rate values (icorr) by means of the well known Stern–Geary equation [17], according to Eq.(1)
p c a
c a corr
R b b
b b
i 1
) (
3 .
2
(1)
where Rp is the polarisation resistance, which is defined by Eq.(2) (c)
(a) (b)
α
η
η
0 E p i E
R (2)
ba and bc are the Tafel slopes for the partial anodic and cathodic processes, respectively.
From the polarisation data, the corresponding Tafel slopes have been obtained by the use of a numerical calculation program.
Figure 2. Potentiodynamic polarization curves for pure zinc, Zn-0.25%Al and Zn-5%Al coatings measured in 3.5% NaCl solution.
Table 1. Open circuit potential (OCP) and corrosion current density (icorr) values. Coating
specimen
OCP (V vs. SCE)
icorr (μA/cm2 )
Pure zinc -1.050 8.75
Zn-0.25%Al -1.035 6.42
Zn-5%Al -1.008 2.61
Table 1 displays the average values of these determinations. It is exhibited that the addition of Al has a remarkable influence on the electrochemical properties of pure zinc coating. The corrosion potentials measured with pure zinc and Zn–0.25%Al coatings in 3.5% NaCl solution are -1.050 and - 1.035 V (SCE), respectively. On the other hand, the corrosion potential of Zn–5%Al coating, with values of -1.008 V, (SCE), is much nobler than that of pure zinc coating. Furthermore, the Zn–5%Al coating shows a relatively low corrosion current density (icorr=2.61 μA/cm2) compared to that of pure zinc (icorr=8.75 μA/cm2) and Zn–0.25%Al coatings (icorr=6.42 μA/cm2), which indicates a relatively low dissolution rate under the conditions investigated.
[image:5.596.157.439.186.398.2]
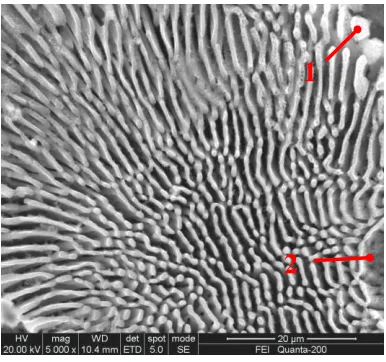
adjacent lamellar β phase. The EDS elemental analysis of different zone is shown in Table 2. The result indicates that zone 1# has a higher Al content and a lower Zn content than zone 2#, which is consistent with the selective η-Zn dissolution observed in Fig. 3.
Figure 3. SEM morphologies of Zn–5%Al coating after potentiodynamic polarization tests.
[image:6.596.202.395.147.328.2]The free corrosion potential of the β-Al phase is more positive than the free corrosion potential of the η-Zn in sodium chloride solutions [1]. The η-Zn phase corrodes due to its lower negative free corrosion potential, and as a result the corrosion rate of η-zinc phase accelerates by micro-galvanic coupling between the η phase and the β phase.
Table 2. EDS elemental analysis of surface in Fig. 3. (wt %)
Zone Zn Al O
1 15.16 76.61 8.23
2 78.37 20.55 1.08
In contrast, the β phase which has a relatively lower corrosion rate, is a more efficient site for the cathodic reaction and may act as a barrier against corrosion propagation. Thus, the β phase has two different influences on the corrosion behavior, i.e. the β phase can act as a galvanic cathode to accelerate corrosion and the β phase can act as a corrosion barrier to hinder corrosion. Moreover, the corroded areas between β laminar can storage the corrosion products, and thus delay the corrosion process of underlying zinc-based coating.
3.3. EIS evaluation for long time immersion
The results of the polarisation curves cannot predict the long-term corrosion behaviors of the zinc-based coatings. Fortunately, EIS technique has been used extensively to study the corrosion
1
behavior of surface coatings in a semi-quantitative way [18-20]. In this study, the impedance characteristic for different immersion time has been obtained to illustrate the corrosion behavior of the zinc-based coatings in 3.5% NaCl corrosion solution.
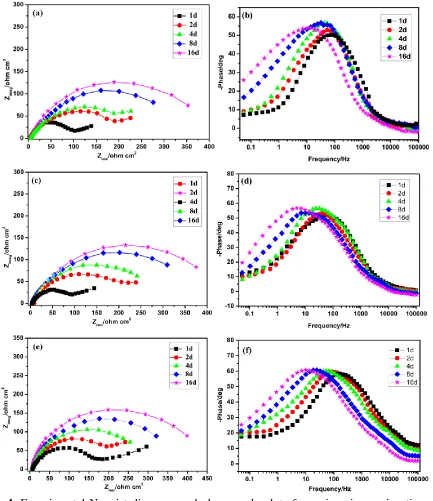
Figure 4. Experimental Nyquist diagrams and phase angle plots for various immersion times to the 3.5% NaCl solution: (a), (b) pure zinc coating; (c), (d) Zn-0.25%Al coating; (e), (f) Zn-5%Al coating.
[image:7.596.82.515.153.654.2][image:8.596.159.430.359.495.2]
the values of charge transfer resistance. After immersion of 2 days for pure zinc coating and 4 days for Zn-0.25%Al and Zn-5%Al coating, the Nyquist plot shows two semicircle curves, an arc appears at high frequency range, followed by an ill-defined tail at low frequency range. Meanwhile the phase angle plot exhibits two time constants. It is likely that a complex mass transport mechanism intervenes in the system formed by the corrosive medium/corrosion products/metal. The first arc at high frequency range is attributed to charge transfer, associated with the effect of electric double layer capacitance of the corrosive medium/corrosion products surface interface, while the second one at low frequency range may indicate a finite thickness layer diffusion process, related mainly with fact that compact corrosion products of zinc formed and blocked the micro-defects of the outer coarse layer, which shows a shielding effect on mass transport of reactants and products [12]. As the immersion time increases (e.g. after 2-4 days), the diagrams differ from the above and they apparently present one single arc. The second arc shrinks in the corresponding Nyquist diagram, possibly resulting from the complete blockage of the pores in the outer coarse layer by the accumulation of corrosion products. In addition, the maximum phase angle at high frequency range increases as the immersion time increases, meaning that the corrosion product layer becomes more compact.
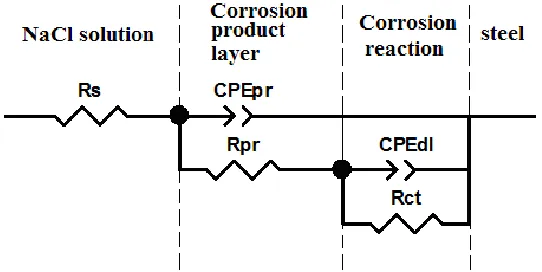
Figure 5. Equivalent circuit models used to fit EIS diagrams.
Fig. 5 represents an equivalent circuit that is widely used in electrochemical studies of corrosive medium/corrosion products/metal systems. The electrical equivalent elements used in the models are the solution resistance (Rs), the charge transfer resistance (Rct) and the corrosive medium/corrosion products interface capacitor (CPEdl), the resistance of corrosion products (Rpr) in parallel with CPEpr. The charge transfer resistance (Rct) is an important parameter, and is inversely proportional to the corrosion rate for each type of coating [21].
[image:9.596.158.438.133.346.2]
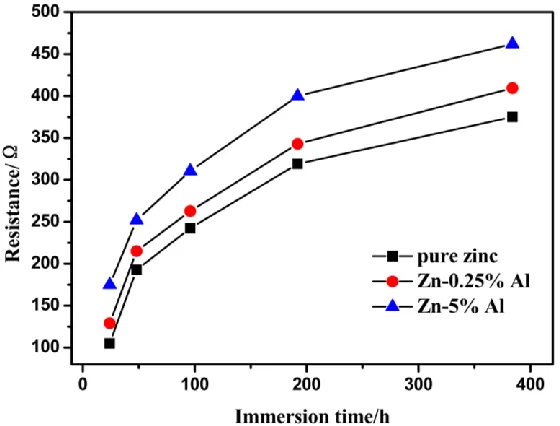
immersion in 3.5% NaCl solution for the same time, which indicating that Zn-5%Al coating has the highest corrosion resistance.
Figure 6. The fitting values (Rct) of the circuit elements as a function of immersion time.
3.4. Corrosion product characterization
Actually, the corrosion damage is due to the attack of aggressive electrolyte, whereas the protection occurs at the same time on the surface of the coatings due to the formation of the corrosion products. Fig. 7 shows the cross section morphologies of Zn-0.25%Al coating at various immersion times. The attack begins at the surface defects and a small quantity of corrosion products form after 1 day of immersion.
Resin Coating Substrate
(a) (b)
Int. J. Electrochem. Sci., Vol. 8, 2013
7762
[image:10.596.86.513.71.268.2]Figure 7. Cross section morphologies of Zn-0.25%Al coating after immersion in 3.5% NaCl solution for: (a) 1 day;(b) 4 days;(c) 8 days;(d) 16 days.
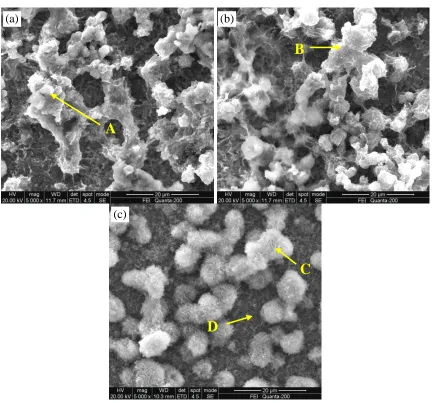
Figure 8. SEM micrographs of corrosion layers after immersion in 3.5% NaCl solution for 8 days: (a) pure zinc coating; (b) Zn-0.25%Al coating; (c) Zn-5%Al coating.
Corrosion products
A
B
C
D
(a) (b)
(c)
[image:10.596.83.516.316.719.2]
The coating thickness is about 120μm, as shown in Fig.7a. As immersion kept on, the corrosive medium is in a constant penetration, diffusion and invasion into the internal coating, resulting in the increasing of the corrosion products and reducing of the thickness of coating (80-90μm), as shown in Fig.7b-c. However, the corrosion product layer is not compact and appears porous. After 16 days of immersion, no obvious change is observed in the coating thickness. The corrosion product layer accumulates and becomes thicker and more compact. As shown in Fig.7d, a corrosion product layer about 20 μm can be observed in the cross section morphology. It can be concluded that the lower corrosion rate during long-term immersion is mainly due to the corrosion product layer, which blocked the transfer of corrosive electrolyte between the coating and solution. As a result, the corrosion process of underlying zinc-based coating was delayed.
[image:11.596.157.440.483.560.2]Fig. 8 shows SEM morphologies of corrosion layer on the three different zinc-based coatings after immersion for 8 days. It can be observed that the surface is covered with porous corrosion products in pure zinc and Zn-0.25%Al coatings (Fig.8a-b). The existing pores on the corrosion layer are the main causes of the lower values of Rct, which is associated with the dissolution of zinc-rich phases. It is also noticed that the corrosion layer of Zn-5%Al coating is covered with a layer of uniform and dense corrosion products that can stop the invasion of corrosive medium effectively (Fig.8c). In this case, higher Rct values are observed compared with pure zinc and Zn-0.25%Al coatings after immersion for the same time. These results clearly show that the corrosion resistance of these coatings is predominantly dependent on the percentage of Al present in their chemical compositions. The relative grading of these coatings on the basis of their corrosion resistance is: Zn–5%Al coating > Zn–0.25%Al coating > pure zinc coating.
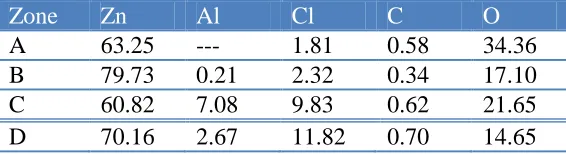
Table 3. Average composition of the EDS microanalysis in Fig.7 (wt %).
Zone Zn Al Cl C O
A 63.25 --- 1.81 0.58 34.36
B 79.73 0.21 2.32 0.34 17.10
C 60.82 7.08 9.83 0.62 21.65
D 70.16 2.67 11.82 0.70 14.65
The composition of each corrosion product is determined using EDS and is listed in Table 3. The results indicate the presence of zinc, aluminum, chlorine, carbon and oxygen within the corrosion layer. From these data, it can be clearly seen that the corrosion products of A and B is mainly composed of zinc and oxygen and A has the highest oxygen of all corrosion products. As for Zn-5%Al coating, the corrosion products of C and D has a higher content of aluminum and chlorine, which indicates the formation of aluminum hydroxide chloride(Al2(OH)5Cl·2H2O) or zinc hydroxide chloride (Zn5(OH)6Cl2·H2O) after immersion in 3.5% NaCl solution for 8 days.
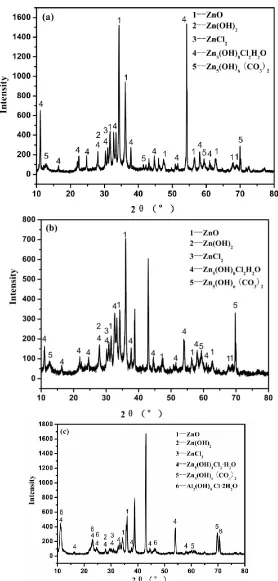
[image:12.596.159.437.140.721.2]
and zinc hydroxide carbonate (Zn5(OH)6(CO3)2) on the corrosion layer of pure Zinc and Zn-0.25%Al coating. As seen from Fig. 9c, the diffraction peak of aluminum hydroxide chloride (Al2(OH)5Cl·2H2O) was observed on Zn-5%Al coating.
When Zinc-based coating is corroded, zinc begins to dissolve preferentially according to Eqs. (3) - (5) [22].
Zn(s)→Zn2+
+ 2e- (3)
O2(d)+2H2O+4 e-→4OH-(aq) (4)
Zn2++2OH-→Zn(OH)2(s)→ZnO(s)+H2O (5)
Chloride ions migrate to anodic sites in the presence of sodium chloride, which resulting in the formation of zinc hydroxide chloride (Zn5(OH)6Cl2·2H2O) according to Eq. (6) [23-24].
5Zn(OH)2+H2O+2Cl-→Zn5(OH)8Cl2·H2O(s)+2OH- (6)
Zinc hydroxide carbonate was detected by XRD after 8 days of immersion (Fig. 8a). Its formation depends on the absorption of atmospheric carbon dioxide into the surface electrolyte and the formation of carbonate and bicarbonate, according to Eqs. (7) - (9)
CO2+2OH-→CO32- +H2O (7) CO2+ CO32-+H2O→2HCO32- (8)
5Zn(OH)2(s)+2HCO32-+2H+→Zn5(OH)6(CO3)2+4H2O (9)
All of these compounds (Zn5(OH)8Cl2·H2O, Zn5(OH)6(CO3)2) consist of Zn(OH)2 sheet structure with different species (HCO32-, Cl-). These species are not always strongly bonded to Zn(OH)2 due to the ion-exchange mechanisms between the sheets structure [25].
The dissolution of Al (in Zn matrix) occurs according to Eqs. (10) - (11) Al(s)→Al3+ + 3e- (10)
2Al3+ + 3H2O→Al2O3(s)+ 6H+ (11)
The Al2O3 film is not stable in water. It is commonly transformed into AlOOH or Al(OH)3 which has higher stability than Al2O3 film, as shown in Fig. 9c. The growth of the film in water occurs in two stages by hydration reaction according to Eqs. (12) - (13). A pseudoboehmite film (AlOOH) is produced initially and then covered by a layer of nordstrandite (Al(OH)3) at intermediate to high pH values.
Al2O3 + H2O→2AlOOH (12) AlOOH + H2O→Al(OH)3 (13)
In the presence of sodium chloride, Al(OH)3 will transform to aluminum hydroxide chloride (Al2(OH)5Cl·2H2O) according to Eq. (14)
2Al(OH)3+2H2O+Cl-→Al2(OH)5Cl·2H2O(s)+OH- (14)
result of the solubility of the precipitated zinc oxides. It is reported that zinc oxide hydroxide precipitation occurs when the interfacial pH is at about 10[27]. This lower pH will of course lead to a decreased solubility of the Al passive film and a decreased dissolution rate.
4. CONCLUSIONS
The corrosion behavior of three different zinc-based coatings (pure Zn, Zn–0.25%Al and Zn– 5%Al) has been studied through potentiodynamic polarization curves and the modelling of EIS spectra at different days of immersion in 3.5% NaCl solution. The obtained parameters for circuit elements were interpreted. The main conclusions of this study can be summarized as follows.
1. The microstructure of Zn–0.25%Al coating has typically a primary η-Zn phase and a eutectic β phase distributed along the η phase grain boundaries. The microstructure of Zn–5%Al coating is mainly composed of laminar and fiber eutectic structures (β+η).
2. The Zn-5%Al coating has better corrosion resistance than the pure zinc coating such as the corrosion potential (Ecorr) have increased by a value about 42 mV, and the corrosion current density (icorr) had decreased approximately three times in 3.5% NaCl solution.
3. The results of this investigation show an appreciable increase in Rct values of the three different coatings as the immersion time increases. It can be seen that the compact corrosion products play a significant role in the protective efficiency of the system.
4. The relatively low Rct values of pure Zn and Zn–0.25%Al coatings which are deduced from the high frequency arc suggest a very porous corrosion film, which leave a considerable fraction of substrate exposed to the corrosive medium. By comparing the corrosion behavior of the three different zinc-based coatings, the corrosion layer formed on Zn–5%Al coating is more compact than the other two coating after immersing in 3.5%NaCl solution for the same time.
5. As for Zn–5%Al coating, the β phase has double effects on the corrosion behavior: (a) the β-Al phase may act as a galvanic cathode to accelerate corrosion; (b) the β-Al phase may act as a barrier against corrosion propagation.
6. SEM micrographs and XRD analysis shows that zinc oxide (ZnO), zinc hydroxide chloride (Zn5(OH)6Cl2·H2O), zinc hydroxide carbonate (Zn5(OH)6(CO3)2) and aluminum hydroxide chloride (Al2(OH)5Cl·2H2O) are the dominant corrosion products of zinc-based coatings.
ACKNOWLEDGEMENTS
The authors are grateful to Nonferrous Metals Science Foundation of HNG-CSU for financial support (Project Z2011-01-002).
References
1. X.G. Zhang,Corrosion and Electrochemistry of Zinc, Plenum Press, NewYork, 1996.
3. G. Vourlias, N. Pistofidis, D. Chaliampalias, E. Pavlidou, G. Stergioudis, E.K.Polychroniadis and D.Tsipas, J. Alloys. Compd. 416, (2006), 125.
4. R. Zandi Zand, K. Verbeken and A. Adriaens, Int. J. Electrochem. Sci, 8 (2013) 548. 5. R. Zandi Zand, K. Verbeken and A. Adriaens, Int. J. Electrochem. Sci, 7 (2012) 9592. 6. Z. Pu, Q.F. Wang, M.B. Shuai and D.M. Lang, Int. J. Electrochem. Sci, 8 (2013) 991.
7. C.Cachet, F.Ganne, S.Joiret, G.Maurin, J.Petitjean, V.Vivier and R.Wiart, Electrochim. Acta. 47, (2002), 3409.
8. N. Birbilis and R. G. Buchheit, J. Electrochem. Soc., 152, (2005), B140. 9. N. Birbilis and R. G. Buchheit, J. Electrochem. Soc., 155, (2008), C117. 10. F.Bigdeli and S.R.Allahkaram ,Mater. Des. 30, (2009), 4450.
11. J. Xu, C. Sun, M.C. Yan and F.H. Wang, Int. J. Electrochem. Sci. 7 (2012) 11281. 12. J. Xu, C. Sun, M.C. Yan and F.H. Wang, Int. J. Electrochem. Sci. 7 (2012) 11297. 13. X. Zhao, S. K. Seo, U. J. Lee, and K. H. Lee, J. Elec. Chem. Soc. , 154, (2007), 553. 14. J. Xu, C. Sun, M.C. Yan and F.H. Wang, Int. J. Electrochem. Sci. 8 (2013) 821.
15. F. Rosalbino, E. Angelini, D. Macciò, A. Saccone and S. Delfino, Electrochim. Acta. 54, (2009) ,1204.
16. F. Rosalbino, E. Angelini, D. Macciò, A. Saccone and S. Delfino, Electrochim. Acta. 52, (2007) ,7107.
17. M.Stern and A.L.Geary, J. Electrochem. Soc. 104, (1957), 56.
18. E.Akbarinezhad, H.R. Faridi and A.Ghanbarzadeh, Surf. Eng. 25, (2009), 163. 19. H.P. Duan, K.Q.Du, C.W.Yan and F.H.Wang, Electrochim. Acta. 51, (2006), 2898. 20. T.Tüken, B.Yazıc and M. Erbil, Mater. Des. 28, (2007), 208.
21. M.A.Chen, X.B. Lu, Z.H.Guo and R.Huang, Corros. Sci. 53, (2011), 2793.
22. N.C. Hosking, M.A.Ström, P.H.Shipway and C.D.Rudd, Corros. Sci. 49, (2007), 3669. 23. Q. Qu, C.Yan, Y.Wan and C.Cao, Corros. Sci. 44, (2002) 2789.
24. T.Falk, J.E.Svensson and L.G.Johansson, J. Electrochem. Soc. 145, (1998) 2993. 25. I. Odnevall and C. Leygraf , Corros. Sci. 34, (1993) 1213.
26. P.D.L.Neto, A.N.Correia, R.P.Colares and W.S.Araujo, J. Braz. Chem. Soc. 18, (2007) 1164. 27. P. Volovitch, C. Allely and K. Ogle, Corros. Sci. 51, (2009) 1251