Int. J. Electrochem. Sci., 8 (2013) 9030 - 9040
International Journal of
ELECTROCHEMICAL
SCIENCE
www.electrochemsci.orgAmperometric Enzyme Carbon Paste-Based Biosensor for
Quantification of Hydroquinone and Polyphenolic Antioxidant
Capacity
Milan Sýs1
,Bruna Pekec2, Kurt Kalcher2, Karel Vytřas1,*
1
Department of Analytical Chemistry, Faculty of Chemical Technology, University of Pardubice, Studentská 573, CZ-53210 Pardubice, Czech Republic
2
Institute of Chemistry – Analytical Chemistry, Karl-Franzens University Graz, Universitätsplatz 1, A-8010 Graz, Austria
*
E-mail: [email protected]
Received: 3 May 2013 / Accepted: 7 June 2013 / Published: 1 July 2013
An amperometric biosensor for the determination of hydroquinone and other polyphenolic antioxidants is presented, based on a carbon paste electrode on which tyrosinase is immobilized in a Nafion® film. In a 0.1 M phosphate buffer (pH 7.0 and 25 1 °C), the antioxidant capacity can be expressed as the concentration equivalent of p-hydroquinone (HQ), according to an amperometric response of polyphenolic antioxidants with the carbon paste sensor at –0.24 V vs. Ag/AgCl/3 M KCl. In the range of low HQ concentrations (up to 120 μmol L-1
), the corresponding calibration curve follows the equation I [μA] = – 0.0426 – 0.0113 c(HQ) [μmol L-1
] with a correlation coefficient R = 0.999. The limit of detection (LOD for S/N = 3) was estimated as 1.6 μmol L-1
, the repeatability was 1.2 % RSD (c = 90 µM, n = 5 measurements). The biosensor can be applied to determine the phenolic antioxidant capacity in plants and food samples in the absence of higher concentrations of ascorbic acid.
Keywords: carbon paste electrode, amperometry, biosensor, tyrosinase, antioxidant capacity, hydroquinone, red wine analysis
1. INTRODUCTION
liquid chromatography (HPLC) was also successfully used for determination of TAC when individual concentrations of phenolic analytes were determined as equivalent concentration of Trolox (6-hydroxy-2,5,7,8-tetramethylchroman-2-carboxylic acid) which is frequently used as a standard polyphenolic compound for determination of antioxidant capacity in plants and food samples [2, 3].
Similarly, amperometric biosensors can be used [4] as they provide a current signal generated by electrochemical reactions at a constant voltage applied to the working electrode; this is proportional to the concentration of analyte in the sample. Biosensors incorporating a biological entity in the receptor of the sensor usually exhibit high selectivity which is controlled by specificity of the biocomponent to bind or react with the substrate [5].
Polyphenolic compounds as secondary plant metabolites have gained a lot of medical and nutritional attention owing to their antioxidant properties [6], reducing the negative effects of free radicals, reactive oxygen species (ROS) and metals [7]. Their beneficial implications in human health are expected to be helpful in the prevention of cancer, cardiovascular disease, and other pathologies. In addition, they are believed to slow down the aging process and to increase the immunity of the human organism [8]. Polyphenolic compounds have also great importance in food technology and cosmetics due to their ability to maintain flavor and color of the products and of food because of their ability to prevent oxidative damages due to oxygen [9].
Polyphenols make up to 65 % of all antioxidants usually present in plants [10, 11] and often consist of several phenolic units linked to each other. They can be divided into four basic groups, i. e., hydrolyzed tannins, condensed tannins, phenylpropanoids and flavonoids [12]. Furthermore, they represent one of the most important groups of chemical compounds having antioxidant effects which explain their high scientific interest.
[image:2.596.221.382.565.738.2]An application of the biosensor based on tyrosinase offers an economically convenient alternative for determination of the polyphenol antioxidant capacity. The active site of the enzyme consists of a dinuclear copper centre in which the metal is bound by six or seven histidine residues and a single cysteine residue [13]. The copper is probably Cu(I), which may assist redox reactions via oxidation to Cu(II) [14]. The structure of the tyrosinase active site is like shown in Fig. 1 [15].
It should be mentioned that tyrosinase catalyzes the oxidation of polyphenols [16] including catechols, but also of monophenols such as cresols [17]. As presented here, a new biosensor based on carbon paste [18] and HQ was used as a simple model for the determination of polyphenolic compounds. In the presence of oxygen, the enzyme catalyzes the oxidation of HQ in contact with a biosensing membrane thus generating p-quinone, which is subsequently reduced at the electrode back to HQ. The resultant current signal corresponds to the electrochemical reduction of the analyte in the sample.
2. EXPERIMENTAL
2.1. Chemicals, reagents and solutions
Hydroquinone, Nafion and mushroom tyrosinase (E.C. 1.14.18.1; 4276 U mg-1 solid) were purchased from Sigma. Carbon powder CR-2 (with average particle size of 2 µm) was obtained from Maziva (Týn nad Vltavou, Czech Republic) and paraffin oil for spectrometry (Nujol) was from Merck. All other chemicals were of the analytical grade purity. Ultrapure water ( = 18.3 M cm; Milli-Q system, Millipore) was used for preparing all the solutions. A 0.1 M phosphate buffer solution (pH 7.0) was used as the supporting electrolyte.
2.2. Instrumentation
The three electrode system consisted of the working carbon paste electrode with immobilized tyrosinase on its surface entrapped in a Nafion film (CPE-Tyrosinase-Nafion), an Ag/AgCl/3 M KCl as the reference, and a platinum wire as the counter electrode. The cell (20 mL volume) was connected to the potentiostat (PalmSens, Ivium Technologies, The Netherlands) which was used for electrochemical measurement. A magnetic stirrer and a stirring bar (13 mm) provided the convective transport when necessary. All potentials mentioned in the paper are referred to the Ag/AgCl electrode. Spectrophotometric measurements were realized using a Helios Delta UV-VIS spectrometer (Thermo Fisher Scientific, USA).
2.3. Electrode preparation
The solution for casting the enzyme-entrapping membrane was prepared in small vials by mixing the following components: Nafion solution (5 % m:m in lower alcohols) neutralized with ammonia solution (5 % m:m, 40 µL), 0.5 mg mL-1
, the aqueous solution of enzyme (0.5 mg mL-1; 140 µL) and ethanol (50 % v:v, 60 µL).
-2.3
-1.8
-1.3
-0.8
0.5 1 1.5 2 2.5 3 3.5
m (tyrosinase) / µg
I
/ µ
A
the CPE was polished using a wet paper. After casting the enzyme solution (10 µL) onto the electrode surface, it was dried for 30 min at room temperature. The resulting biosensor was stored at ambient laboratory conditions.
2.4. Procedures
All electrochemical experiments were performed at room temperature with 0.1 M phosphate buffer as a supporting electrolyte. Batch hydrodynamic amperometric measurements were carried out in a glass cell containing a buffer solution (10 mL) with constant stirring (400 rpm). If not stated otherwise, the working potential was –0.24 V.
Wine samples were subjected to the standard addition method. An aliquot (100 µL) was injected to 0.1 M pH 7.0 phosphate buffer solution (10 mL) and four additions of the standard hydroquinone solution (500 mg L-1; 100 µL) were applied.
3. RESULTS AND DISCUSSION
[image:4.596.164.400.444.663.2]3.1. Optimization of the working conditions 3.1.1. Effect of the amount of enzyme
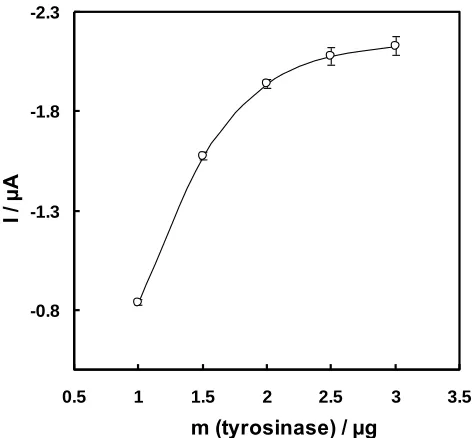
Figure 2. Dependence of the amperometric response on the amount of the enzyme immobilized at the carbon paste electrode surface (solution, 180 µM hydroquinone in 0.1 M pH 7.0 phosphate buffer; potential, –0.20 V vs. Ag/AgCl/3.0M KCl,; speed of stirring, 400 rpm; temperature, 25 °C); electrode surface, 7.1 mm2
-2.5
-2.0
-1.5
-1.0
-0.5
0.0
-0.4 -0.35 -0.3 -0.25 -0.2 -0.15 -0.1 -0.05 0
E / V (vs Ag|AgCl|3.0 M KCl)
I / µ
A
b
a
The amperometric response depends on the enzyme amount in the membrane which is connected with the membrane properties as well (porosity, enzyme retention capacity, polymer adhesion to the electrode). The influence of the amount of enzyme on the current response was investigated (see Fig. 2). As expected, current signals increased with increasing amount of tyrosinase in the polymer layer up to 2 µg, but no significant grow was observed at higher additions of the enzyme. Thus, the amount of 2.5 µg was chosen as a proper addition to obtain sufficiently high signals.
3.1.2. Effect of the electrode potential
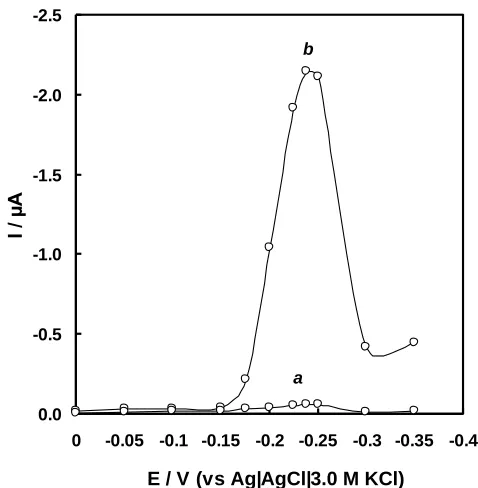
The working potential plays the most important role in the biosensor application. In Fig. 3, the hydrodynamic amperometric responses of the biosensor are compared with those observed with an unmodified CPE. The graph shows a maximum current at –0.24 V significantly decreasing at more negative potentials; the effect is probably caused by a potential-dependent adsorption of the enzymatic oxidation product, i.e., p-quinone, which decreases the active surface area of the electrode. The bare electrode practically did not show any response to HQ in the negative potential window.
Figure 3. Dependence of the amperometric response on the applied electrode potential of the CPE-Tyrosinase/Nafion biosensor (curve b) compared with a bare CPE (curve a); analyte 90 µM hydroquinone; supporting electrolyte 0.1 M pH 7.0 phosphate buffer; speed of stirring, 400 rpm; temperature 25 °C).
3.1.3 Effect of pH on the biosensor response
[image:5.596.176.415.359.603.2]
-1.2
-1.1
-1.0
-0.9
-0.8
-0.7
-0.6
4 5 6 7 8 9
pH
I /
µ
A
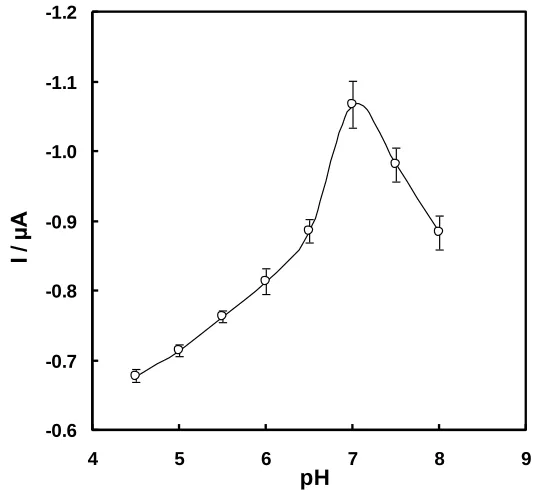
(Fig.4). The best response was found at pH 7.0 which corresponded to the optimum pH found earlier for mushroom tyrosinase activity [20].
3.1.4. Effect of stirring on the biosensor response
[image:6.596.129.396.269.514.2]The speed of stirring affects the rate of transport of the analyte to the membrane biosensor and therefore, it may influence significantly the response in a closed dynamic system. The experiments were carried out at 100, 200, 300, 400 and 500 rpm, from which the stirring speed of 400 rpm was found as an optimum. At higher speeds, no significant increase of the response was observed (not shown).
Figure 4. Effect of pH on the cathodic current of the CPE-Tyrosinase-Nafion in 90 µM hydroquinone solution. Potential, –0.24 V vs. Ag/AgCl/3.0M KCl; speed of stirring, 400 rpm; temperature, 25 °C.
3.2. Calibration and repeatability
Fig. 5 shows a typical hydrodynamic amperogram recorded under optimized conditions. The calibration of the CPE-tyrosinase sensor gave a linear response to HQ concentrations in the range of 20 to 120 µM (Fig. 6) with a detection limit of 1.610-6
-8
-7
-6
-5
-4
-3
-2
-1
0
0 200 400 600 800
t / s
I /
µ
[image:7.596.181.405.86.308.2]A
Figure 5. Typical amperometric responses of the CPE-Tyrosinase-Nafion to individual additions of 90 µM hydroquinone. Measured in 0.1 M pH 7.0 phosphate buffer; potential, –0.24 V; temperature, 25°C; speed of stirring, 400 rpm.
Figure 6. Calibration curve for hydroquinone obtained with a carbon paste electrode coated by Nafion film containing 2.5 µg tyrosinase (volume additions, 20 µL; pH 7.0 phosphate buffer; potential, –0.24 V; speed of stirring, 400 rpm; temperature, 25 °C).
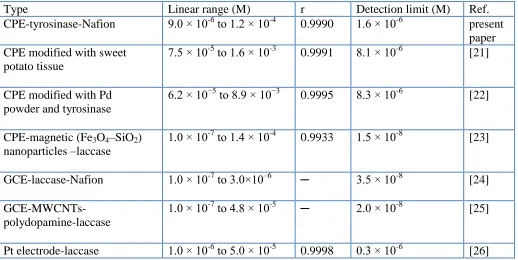
In Table 1, characteristics of the tyrosinase-modified CPE are compared with other biosensors found in the literature [21-26]. Compared to tyrosinase-modified electrodes, the biosensor described in
-7
-6
-5
-4
-3
-2
-1
0
0 300 600 900 1200
c (hydroquinone) / µM
I / µ
A
-1.2 -1.0 -0.8 -0.6 -0.4 -0.2 0.0
0 20 40 60 80 100
c (hydroquinone) / µM
I
/
µ
[image:7.596.174.413.389.629.2][image:8.596.42.560.162.422.2]
this paper showed the lowest detection limit. Anyway, lower LODs could probably be achieved when laccase-modified sensors are applied.
Table 1. Performance of various sensors based on different electrode materials with enzyme
Type Linear range (M) r Detection limit (M) Ref.
CPE-tyrosinase-Nafion 9.0 × 10⁻⁶ to 1.2 × 10⁻⁴ 0.9990 1.6 × 10⁻⁶ present paper CPE modified with sweet
potato tissue
7.5 × 10⁻⁵
to 1.6 × 10⁻³ 0.9991 8.1 × 10⁻⁶ [21]
CPE modified with Pd powder and tyrosinase
6.2 × 10⁻⁵ to 8.9 × 10⁻³ 0.9995 8.3 × 10⁻⁶ [22]
CPE-magnetic (Fe3O4–SiO2)
nanoparticles –laccase
1.0 × 10⁻⁷
to 1.4 × 10⁻⁴ 0.9933 1.5 × 10⁻⁸ [23]
GCE-laccase-Nafion 1.0 × 10⁻⁷ to 3.0×10⁻⁶ ─ 3.5 × 10⁻⁸ [24] GCE-MWCNTs-
polydopamine-laccase
1.0 × 10⁻⁷
to 4.8 × 10⁻⁵ ─ 2.0 × 10⁻⁸ [25]
Pt electrode-laccase 1.0 × 10⁻⁶ to 5.0 × 10⁻⁵ 0.9998 0.3 × 10⁻⁶ [26]
3.3. Interferences
Ascorbic acid (AA, vitamin C) belongs to the main interfering substances because in higher concentrations, it reduces quinone generated by enzymatic reaction. This chemical reaction is a concurring process to the electrochemical one resulting in a diminution of the reduction current. With increasing AA:HQ ratio, an almost linear decrease of the current response up to 80 % was observed. At higher ratios, the decrease remained somehow constant. In equimolar mixtures, a current decrease of 3 % was found which is not significant and corresponds somehow to the experimental error. Thus, it may be concluded that in samples analyzed with the tyrosinase-modified CPE, the AA:HQ molar concentration ratio should not exceed 1.
3.4. Substrate specificity
In the substrate specificity experiments, hydroquinone, catechol, resorcinol, phenol and Trolox were used. Measurements were realized at the electrode potential of -0.24 V. As follows from the results (averages of 5 measurements) shown in Table 2, the highest response was obtained with catechol. To that, when accepted as 100%, responses of other substrates could be compared.
[image:9.596.51.547.187.313.2]
group in ortho position whereas compounds with this group in meta or para positions need longer time of oxidation. Thus, the biosensor can be utilized for determination of TEAC because a very small electrochemical response was observed for this concentration (according to Ref. [27], TEAC values are given as 1.0 mM Trolox concentrations).
Table 2. Substrate specificity of the biosensor was set to 100 % relative value.
Substrate Concentration (µM) Response time (s) Relative response (%)*
Catechol 90.82 8 100
Phenol 106.26 17 68
Hydroquinone 90.82 32 4.7
Resorcinol 90.82 14 3.2
Trolox 1000 15 0.03
*) Averages of five measurements.
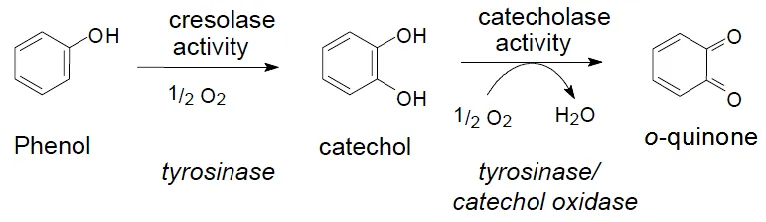
The enzyme tyrosinase is capable to oxidize phenol to catechol due to its cresolase activity [28]. Here in a first step the monophenol is hydroxylated, and the resulting diphenol is further oxidized to the corresponding quinone (Fig. 7).
Figure 7. Cresolase activity and catecholase activity of tyrosinase and catechol oxidase
3.5. Analytical application
[image:9.596.111.494.433.544.2][image:10.596.49.549.190.290.2]
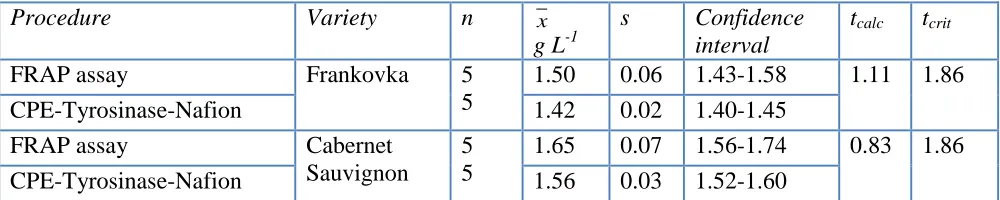
are summarized in Table 3. Evidently, results obtained with the biosensor described here are in a good agreement with those obtained with the reference method. As documented, the differences between the two methods are statistically insignificant.
Table 3. Determination of hydroquinone equivalent antioxidant capacity in red wines.
Procedure Variety n x
g L-1
s Confidence interval
tcalc tcrit
FRAP assay Frankovka 5
5
1.50 0.06 1.43-1.58 1.11 1.86
CPE-Tyrosinase-Nafion 1.42 0.02 1.40-1.45
FRAP assay Cabernet
Sauvignon 5 5
1.65 0.07 1.56-1.74 0.83 1.86
CPE-Tyrosinase-Nafion 1.56 0.03 1.52-1.60
n, number of replications; x, arithmetic mean; s, standard deviation; tcalc, calculated and tcrit, critical
value of the Student distribution (95% probability).
4. CONCLUSION
As shown in this study, the immobilization of tyrosinase on carbon paste electrodes was successfully utilized to construct biosensors for the amperometric determination of hydroquinone. Especially, they could find their practical applications, e.g., for the determination of the TAC in samples in which the TAC is mainly caused by phenolic compounds (absence of higher amounts of ascorbic acid). Preliminary results obtained in this study can serve to subsequent development of biosensors based on carbon materials. Possible signal enhancement due to nanoparticles offers a way how to increase the sensitivity of the biosensor towards polyphenolic compounds such as Trolox, which is commonly used as a standard substance for the determination of TEAC. The transition from carbon paste electrode to a screen-printed one as a transducer with the application in flow systems is currently in progress.
ACKNOWLEDGEMENT
Financial supports of the CEEPUS CIII-CZ-0212/05/1112 network, and the Antiflavo 827334 (FFG Austria) and the SGFChT06/2013 (Faculty of Chemical Technology, University of Pardubice) projects are gratefully acknowledged.
References
1. N. Pellegrini, M. Serafini, B. Colombi, D. Del Rio, S. Salvatore, M. Bianchi, F. Brighenti, J. Nutr. 133 (2003) 2812
2. Y. Yilmaz, T. T. Toledo, J. Agric. Food Chem. 52 (2004) 255
5. E. Akyilmaz, O. Kozgus, H. Türkmen, B. Cetinkaya, Bioelectrochemistry 78 (2010) 135 6. M. Heinonen, Mol. Nutr. Food Res. 51 (2007) 684
7. M. Valko, C. J. Rhodes, J. Moncol, M. Izakovic, M. Mazur, Chem. Biol. Interact. 160 (2006) 1 8. J. Wollgast, E. Anklam, Food Res. Int. 33 (2000) 449
9. L. H. Yao, Y. M. Jiang, J. Shi, F. A. Tomas-Barberant, N. Datta, R. Singanusong, S. S. Chen, Plant Foods Hum. Nutr. 59 (2004) 113
10.L. Bravo, Nutr. Rev. 56 (1998) 317
11.C. Manach, A. Adalbert, Ch. Morand, Ch. Rémésy, L. Jiménez, Am. J. Clin. Nutr. 79 (2004) 727 12.C. W. Beninger, G. L. Hosfield, J. Agric. Food Chem. 51 (2003) 7879
13.A. M. Mayer, Phytochemistry 67 (2006) 2318
14.L. Pourcel, J. M. Routaboul, V. Cheynier, L. Lepiniec, I. Debeaujon, Trends Plant Sci. 12 (2006) 29
15.M. Rolff, J. Schottenheim, F. Tuczek, J. Coord. Chem. 63 (2010) 2382 16.M. L. Pedano, G. A. Rival, Talanta 53 (2000) 489
17.S. Q. Li, Y. Y. Tan, P. Wang P., J. Q. Kan,Sens. Actuators, B 144 (2010) 18 18.L. Gorton, Electroanalysis 7 (1995) 23
19.I. Švancara, K. Vytřas, R. Metelka, Czech Patent CZ 301714 B6 (applied 2 Dec 2002, administered 22 Apr 2010)
20.H.W. Duckman, J.E. Coleman, J. Biol. Chem. 245 (1970) 1613 21.I. C. Vieira, O. F. Filho, Talanta 52 (2000) 681
22.I. C. Vieira, O. F. Filho, L. Angnes, Anal. Chim. Acta 398 (1999) 145
23.Y. Zhang, G. M. Zeng, L. Tang, D. L. Huang, Y. X. Jiang, N. Y. Chen, Biosens. Bioelectron. 22 (2007) 2121
24.I. A. Yaropolov, V. S. Shleev, O. V. Morozova, E. A. Zaitseva, M. G. Varga, J. Emneus., L. Gorton, J. Anal. Chem. 60 (2005) 553
25.D. Quan, W. Shin, Bull. Korean Chem. Soc. 25 (2004) 833
26.Y. M. Tan, W. F. Deng, Y. Y. Li, Z. Huang, Y. Meng, Q. J. Xie, M. Ma, S. Z. Yao, J. Phys. Chem., B 114 (2010) 5016
27.J. V. Verhagen, G. R. Haenen, A. Bast, J. Agric. Food Chem. 44 (1996) 3733 28.B. Krebs, M. Merkel, A. Domlel, J. Argent. Chem. Soc. 92 (2004) 1
29.R. Tsao, R. Yang, S. Xie, E. Sockovie, E. Khanizadeh, J. Agric. Food Chem. 53 (2005) 4989