A STUDY OF RADIATING
ARGON FLOWS AT HIGH OPACITIES
Thesis submitted for the Degree of Doctor of Philosophy
by
Peter Frederick Logan
Department of Physics School of General Studies Australian National University Canberra A.C.T.
CANDIDATE Peter Frederick Logan M.Sc.(Syd)
SUPERVISOR R. J. Stalker B.Sc., M.Eng.Sc., Ph.D.
The contents of this thesis except where indicated in the acknowledgements or a reference is entirely my own work.
(P. Jr.
<Xo
ABSTRACT
The aim of this project was to investigate the effect of radiation loss on the various flows associated with a free piston reflected shock tunnel assembly.
Experiments have been performed using argon as a test gas because the radiation loss with argon is quite considerable under the thermodynamic conditions experienced in this study. The nature of the experiments was mainly spectroscopic.
This investigation has shown that?using a careful analysis^the behaviour of a high performance shock tunnel?which experiences substantial radiation losses.can be explained during the first one hundred
microseconds of test section flow. An appropriate model is developed to account for the emitted and absorbed radiation from the test gas, both behind the incident shock and the reflected shock, during this period. At later times a quantitative description could not be obtained since
interaction between the reflected shock and the boundary layer introduced contamination into the reflected shock region. From the theoretical analysis of the radiative behaviour of the gas flows associated with free piston reflected shock tunnels, a limiting value for their operation can be obtained.
A further study proceeded from this investigation. The gas in the stationary slug at the end of the shock tube is optically opaque towards all visible and near visible radiation. Whereas the gas at the exit of the nozzle is optically thin. Hence the radiation field
observed looking up the centre of the nozzle is similar to that of a stellar atmosphere?and a Fraunhofer type spectrum was observed. A preliminary investigation of both the mechanism by which the spectral lines are formed#and their application^is reported.
I would like to thank the following people for their assistance towards the preparation of this thesis; to Dr. R. J. Stalker for his helpful advice, constructive criticisms and general guidance in all aspects of my work; to Drs. H. G. Hornung and R.J.Sandeman for their continual advice and cooperation; to Dr. D.J.Faulkner of Mount Stromlo Observatory for discussions on Chapter 8; to Mr. R.French and Mr.F.Buckley for their excellent contributions and technical knowledge relating to the Shock Tube Facility; to Mr.K.Smith for all his help concerning photography; to G.Yanow, G.Allen, J.Rayner and M.McIntosh for their constructive
comments and many discussions; to all members of the Physics Department both academic and technical staff who were always willing to assist me where necessary; M r .C.M.Reekie of the Papua New Guinea Institute of Technology for his helpful advice and constructive comments; to the
Australian National University who gave both monetary and academic support to enable me to complete my research project; to the Papua New Guinea Institute of Technology for allowing me to complete the thesis while employed by them; to my wife Colleen for her moral support during the past few years and to Mrs.Jolliffe and my wife who typed this thesis.
LIST OF CONTENTS
Abstract iii
Acknowledgements iv
List of Contents v
Tables x
Figure Captions xii
CHAPTER 1 INTRODUCTION 1
1.1 Shock Tunnel Flows 1
1.2 High Performance Shock Tunnels 3
1.3 Radiation Cooling 4
1.4 Scope of the Thesis 6
1.5 Layout of the Thesis 8
1.6 Summary 9
CHAPTER 2 SHOCK TUNNEL SPECTROSCOPY 11
2.1 Description of A.N.U. Shock Tunnel Assemblies 11 2.2 Radiation from Shock Heated Argon 12 2.3 Physical Concepts and Measurements 15
2.3.1 Temperature 15
2.3.2 Electron Density 16
2.4 Summary 17
CHAPTER 3 EXPERIMENTAL MEASUREMENT TECHNIQUES AND ANALYSIS 19
3.1 The Spectrometer 19
3.1.1 Wavelength Determination 20
3.1.2 Recording of the Emitted Light 21
3.1.3 Time Resolved Spectra 21
3.1.4 Line Broadening 23
3.1.6 Relative Line Intensities 24 3.1.7 Line to Continuum Intensity Ratio 25
3.1.8 Additional Analyses 26
3.2 Monochromator 27
3.3 Photographic Emulsion 28
3.3.1 Microdensitometer 28
3.3.2 Photographic Analysis 28
3.4 Image Converter Camera 29
3.5 Luminosity Photography 30
3.6 Pressure Transducer 31
3.7 Mach Zehnder Interferometer 31
3.8 Summary 32
CHAPTER 4 INCIDENT SHOCK ANALYSIS 34
4.1 Shock Structure 36
4.1.1 Effect of Radiation on Shock Structure 36 4.1.2 Energy Loss within the Shock Structure 37
4.1.3 Experimental Results 37
4.1.4 Conclusion 38
4.2 Propagation of Shock Front 38
4.2.1 Expansion of Driver Gas 38
4.2.2 Mathematical Analysis 39
4.2.3 Experimental Results 41
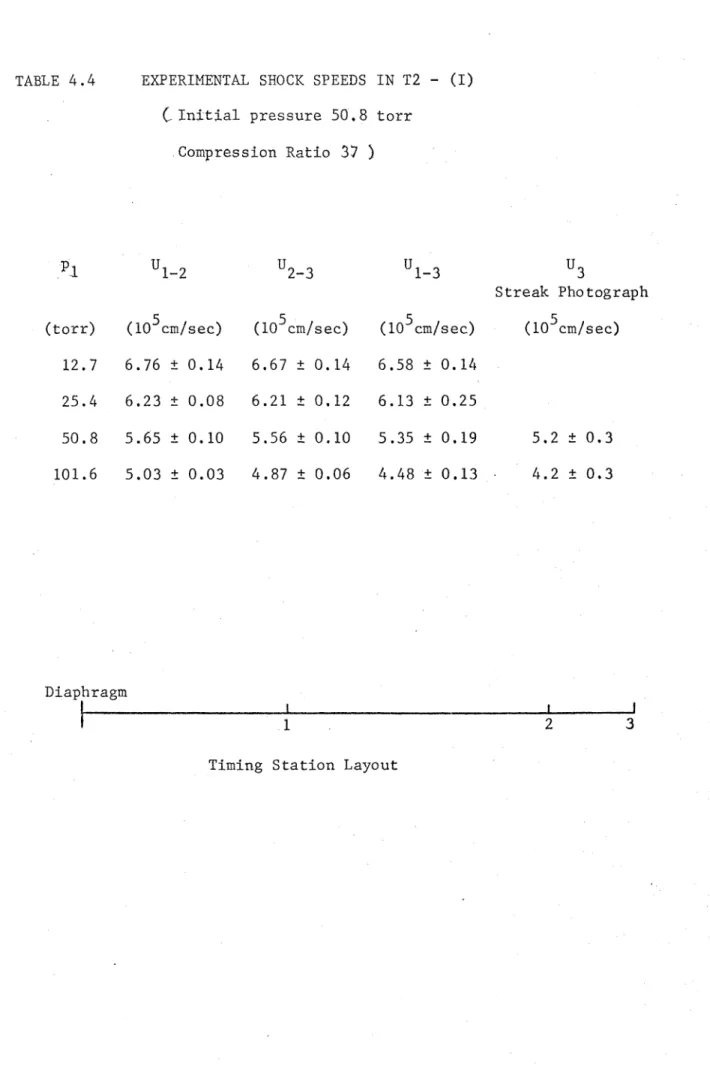
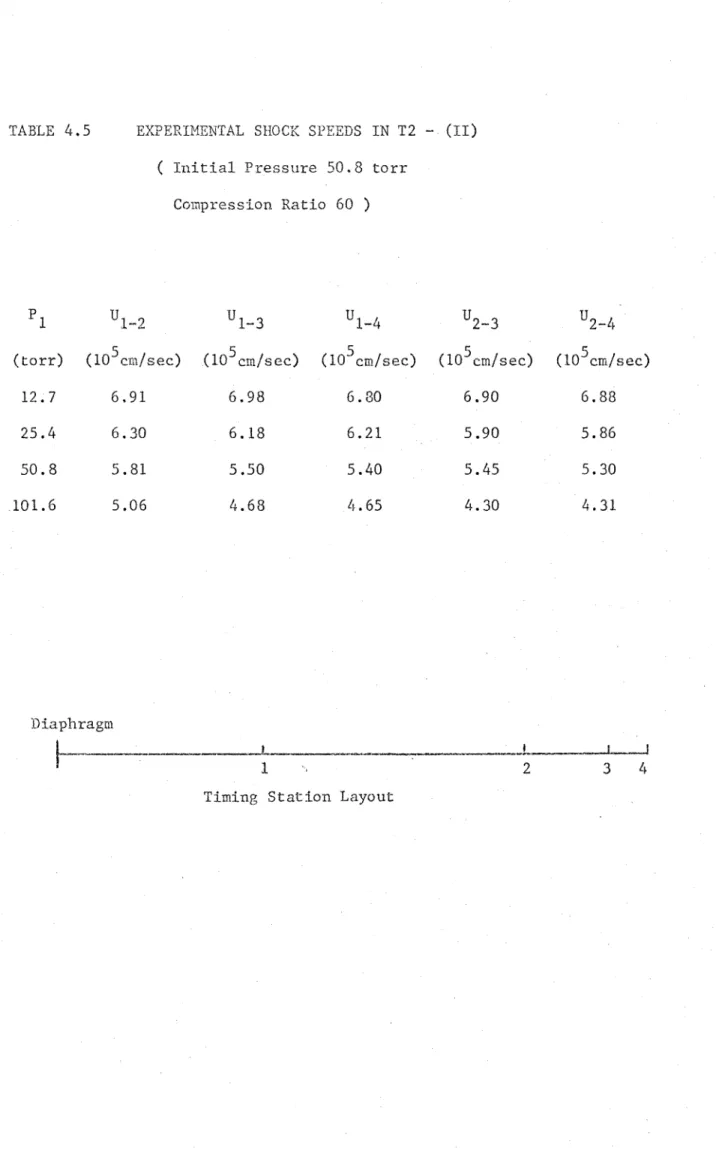
4.2.4 Shock Speed Measurements 42
4.2.5 Shock Speed Attenuation 44
4.3 Energy Loss from Shock Heated Test Gas 45 4.4 Shock - Contact Surface System 48
4.5 Conclusion 50
CHAPTER 5 REFRACTED SHOCK 52
5.1 Mathematical Analysis 54
5.1.1 Ideal Pefracted Shock Theory 54 5.1.2 Refracted Shock Theory for a Real Gas 55 5.2 Discussion of Theoretical and Experimental Results 56
5.3 Conclusion 59
CHAPTER 6 REFLECTED SHOCK 62
6.1 Interaction of the Reflected Shock with the Test Slug 63 6.1.1 Ideal Reflected Shock Theory 64
6.1.2 Stratified Model 64
6.1.3 Energy Loss behind the Reflected Shock 65 6.2 Interaction of the Reflected Shock with the Boundary
Layer 66
6.3 Interaction of the Reflected Shock with the Contact
Surface 67
6.3.1 Reflected Disturbance through the Test Gas 67
6.3.2 Transmitted Shock 69
6.4 Subsequent Decay of the Test Slug 70 6.4.1 A Simplified Treatment of the Test Slug 71 6.4.2 Radiative Decay of the Gas Slug 72
6.4.3 Test Slug and Nozzle Flow 77
6.5 Contamination of the Test Slug 78
6.6 Conclusion 81
CHAPTER 7 HYPERSONIC NOZZLE FLOW 83
7.1 Starting Process 84
7.2 Theoretical Nozzle Flow 85
7.2.1 Equilibrium Nozzle Flow 86
7.2.2 Nonequilibrium Nozzle Flow 87
7.2.3 Helium Flow in the Nozzle 89
7.4 Theoretical Test Section Flows 90
7.4.1 Normal Shock Analysis 91
7.4.2 Flow over Flat Faced Models 91
7.4.3 Conclusions 92
7.5 Experimental Analysis and Discussion 93
7.5.1 Starting Process 93
7.5.2 Test Gas Flow 94
7.5.3 Contaminated Flow 98
7.6 Contaminated Flow 100
7.7 Conclusion 102
CHAPTER 8 ABSORPTION SPECTRA IN THE NOZZLE FLOW 103 8.1 Stellar Atmospheres and Nozzle Flows 104
8.2 Continuum Analysis 106
8.3 Absorption Line Theory 108
8.3.1 Stellar Absorption Line Theory 108 8.3.2 Absorption Line Profiles for a Hypersonic
Nozzle 110
8.4 Experimental and Theoretical Analysis 113
8.4.1 Experimental Apparatus 113
8.4.2 Continuum Analysis 113
8.4'.3 Line Radiation Analysis 115
8.5 Experimental and Theoretical Results 117
8.5.1 Continuum Results 117
8.5.2 Spectral Line Analysis 117
8.6 A Laboratory Star ? 120
8.7 Conclusion 122
CHAPTER 9 CONCLUSION 123
APPENDICES
Appendix A Appendix B
Symbols used in the Thesis -fundamental Concepts
3.1 Wavelength Determination
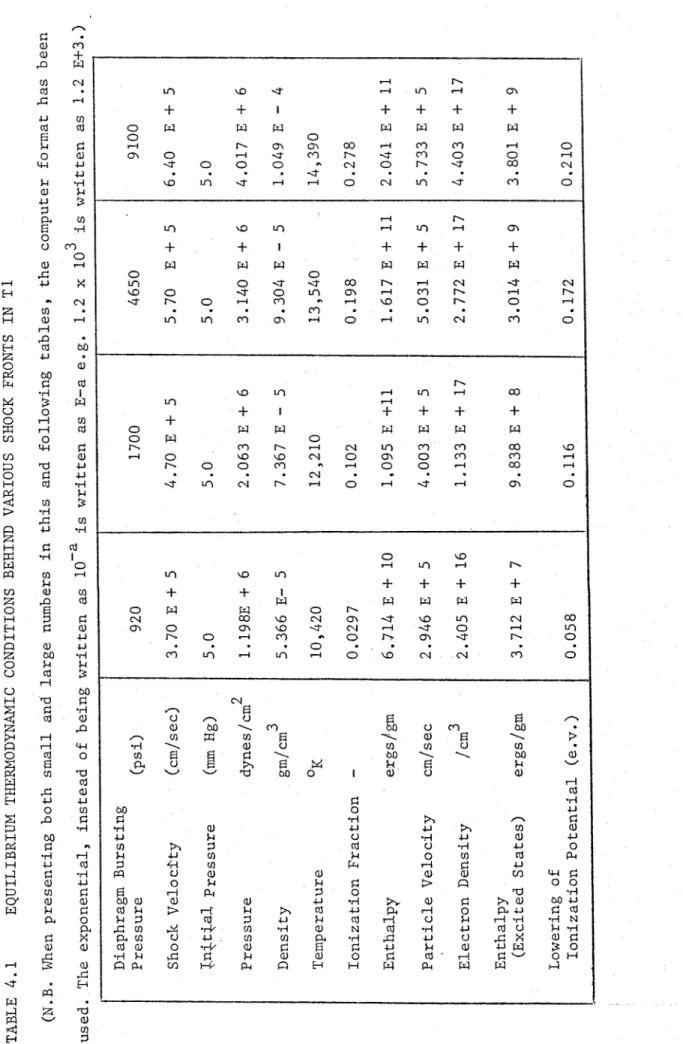
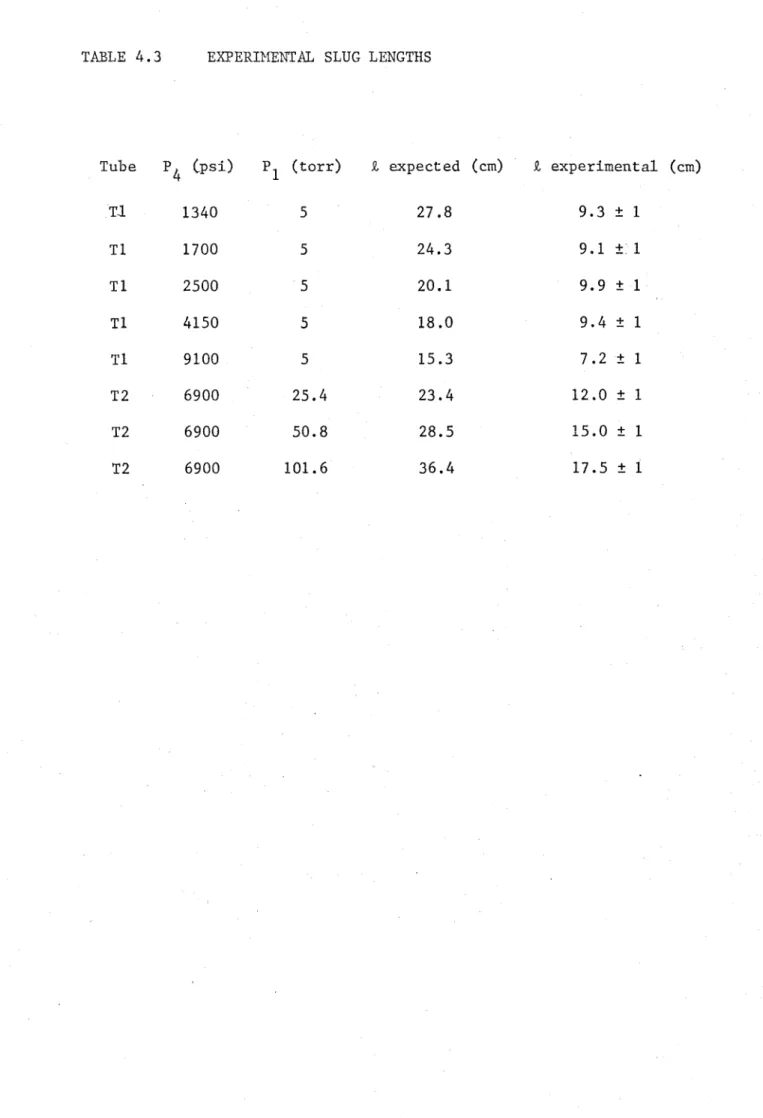
4.1 Equilibrium Thermodynamic Conditions behind Incident Shock in T1 4.2 Equilibrium Thermodynamic Conditions behind Incident Shock in T2 4.3 Experimental Slug Lengths
4.4 Experimental Shock Speeds in T2 - (I) 4.5 Experimental Shock Speeds in T2 - (II)
4.6 Reynold's Numbers of various Flows in T1 and T2
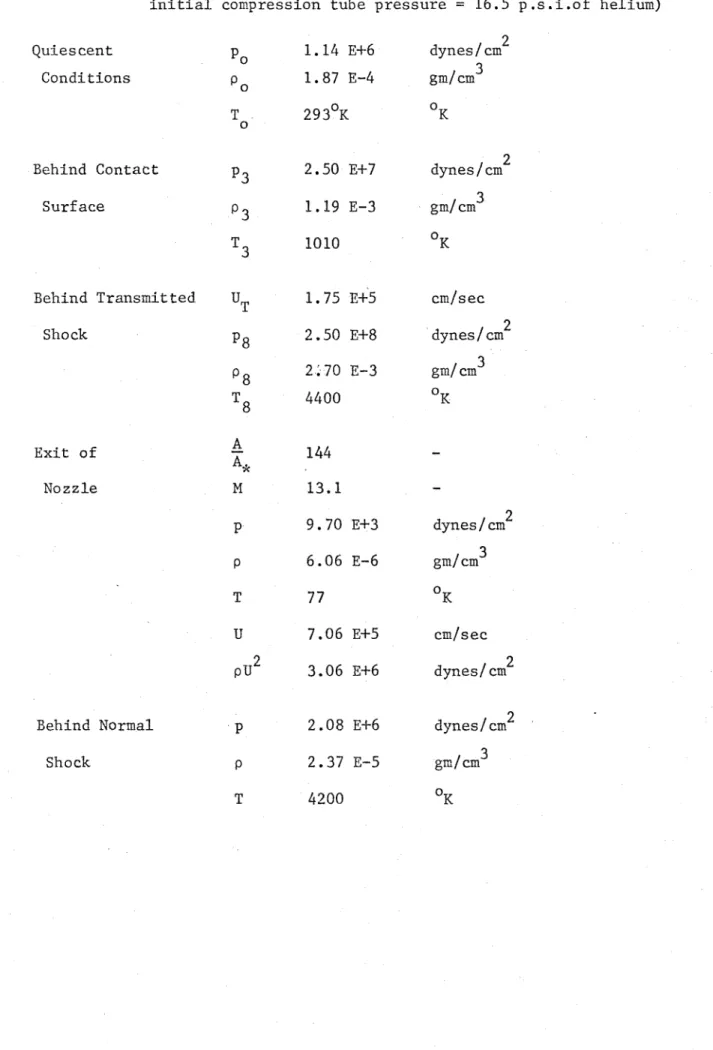
4.7 Thermodynamic Conditions at various Positions behind the Shock Front 4.8 Theoretical and Experimental Temperatures
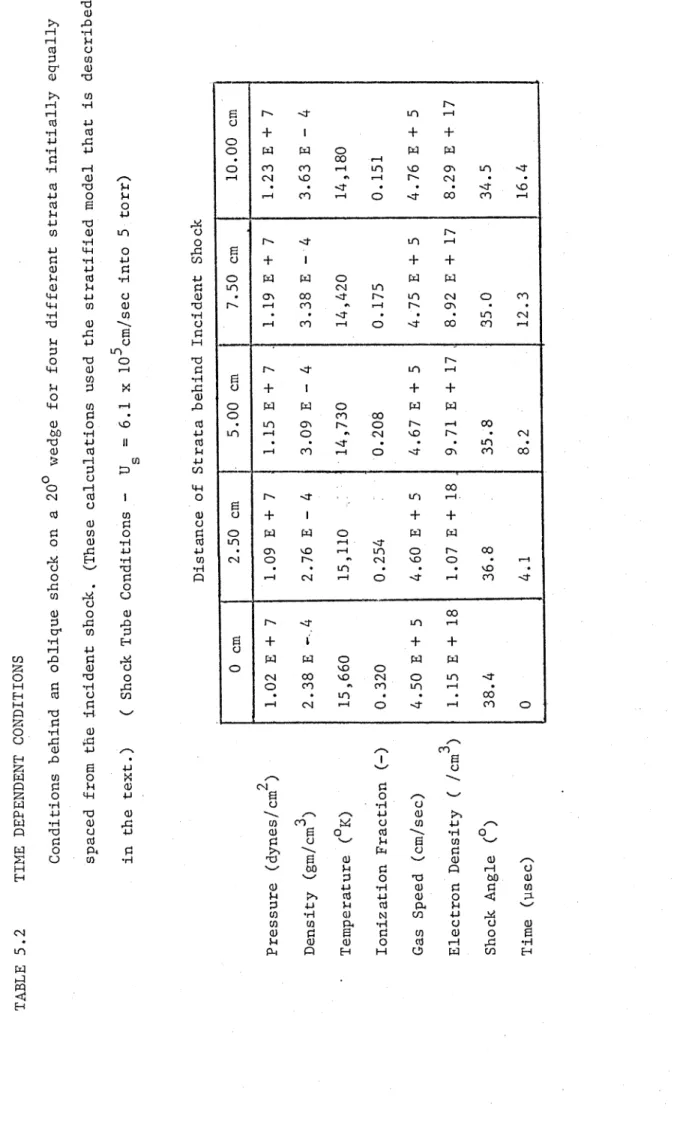
5.1 Thermodynamic Conditions behind the Oblique Shock 5.2 Time Dependent Conditions
5.3 Experimental and Theoretical Results behind an Oblique Shock
6.1 Thermodynamic Conditions behind the Reflected Shock 6.2 Decay of Gas Slug
6.3 Spectroscopic Results from Reservoir Region
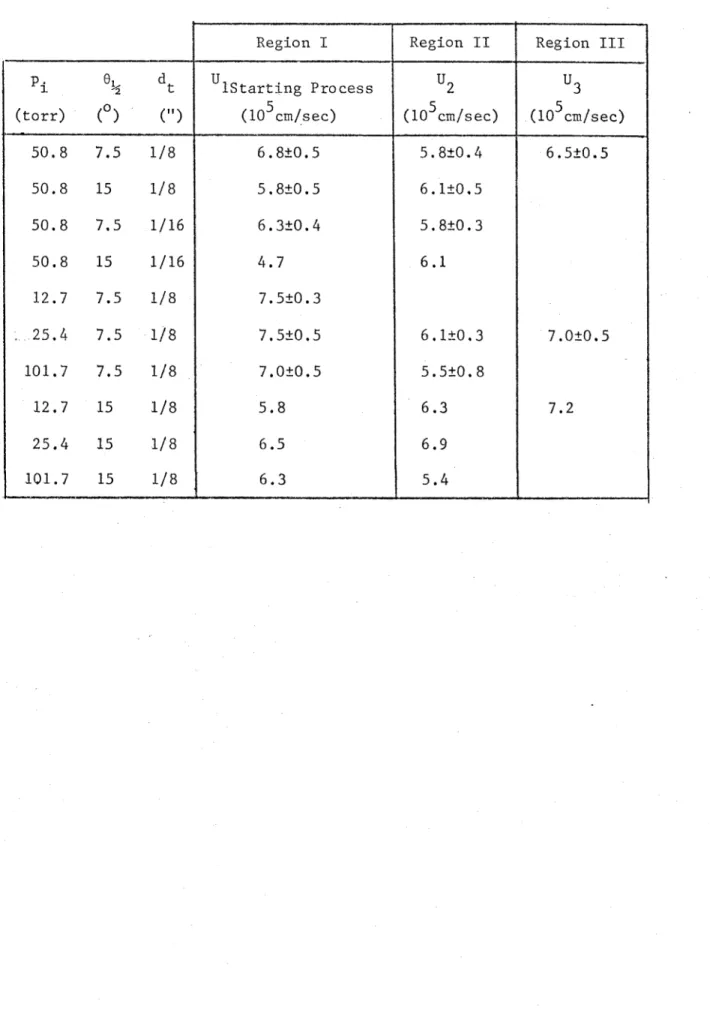
7.1 Starting Process Parameters
7.2 Thermodynamic Conditions down a Nozzle - (I) 7.3 Thermodynamic Conditions down a Nozzle - (II) 7.4 Thermodynamic Conditions down a Nozzle - (III) 7.5 Conditions of Driver Gas
7.6 Thermodynamic Conditions behind Normal Shock 7.7 Experimental Velocity Measurements
8.1 Volume Absorption Coefficient
8.2 Determination of Total Optical Depth of Spectral Line 8.3 Concentration of Impurities
8.4 Characteristics of Absorption Lines 8.5 Radial Dependence of Continuum Radiation
8.6 Theoretical and Experimental Colour and Brightness Temperature
1.1 Shock Tunnel
2.1 Schematic Diagram of T2
3.1 Shock Tunnel Measurements 3.2 Time Resolved Spectroscopy 3.3 Convolution
3.4 Addition of Stark Profiles 3.5 Relative Line Intensities
3.6 Line to Continuum Intensity Ratio 3.7 'Microdensitometer Trace
4.1 Continuum Radiation
4.2 Unsteady Expansion of Driver Gas
4.3 Theoretical Electron Densities and Temperatures (Tl) 4.4 Theoretical Electron Densities and Temperatures (T2) 4.5 Boundary Layer in Shock Tube
4.6 x-t Diagram
4.7 Effect of Radiation Loss behind the Incident Shock 4.8 Time Resolved Spectrum (I)
4.9 Continuum Radiation Intensity
4.10 Streak Photograph of Shock Heated Gas Slug 4.11 Time Resolved Spectrum (II)
5.1 Oblique Shock
5.2 Geometry of Oblique Shock 5.3 Electron Temperature 5.4 Electron Density 5.5 Shock Angle
5.6 Stratified Shock Tube Flow
5.7 Decay of Electron Density 5.8 Spectrum from Oblique Shock 5.9 Shock Angles
5.10 Theoretical Continuum Radiation 5.11 Monochromator Traces
6.1 Reflected Shock - Boundary Layer Interaction 6.2 Overtailored Operation
6.3 Undertailored Operation 6.4 Tailored Operation
6.5 Streak Photograph of the Reflected Shock 6.6 Spectrum of Test Gas
6.7 Radial Radiative Energy Loss
6.8 Radial Distribution of Temperature 6.9 Time Dependence of Stagnation Enthalpy
7.1 Wave Diagram of the Starting Process 7.2 Flow Velocity, Density and Pitot Pressure 7.3 Nonequilibrium behind Test Section Shocks 7.4 Thermodynamic Conditions behind a Normal Shock 7.5 Theoretical Stand-off Distances
7.6 Photomultiplier Traces
7.7 Streak Photographs at the Nozzle Exit 7.8 Time Resolved Spectrum
7.9 Pitot Pressure
7.10 Streak Photograph of Stand-off 7.11 Experimental Stand-off Distances 7.12 Experimental Oblique Shock Angles 7.13 Boundary Layer Dump
8.1 Absorption Spectrum 8.2 Stratification of Nozzle
8.4 Colour Temperature 8.5 Microdensitometer Trace
8.6 Wavelength Dependence of Continuum Pvadiation 8.7 Absorption Line Profiles Cal - A
8.8 Absorption Line Profiles Cal - B 8.9 Absorption Line Profiles Nal 8.10 Absorption Line Profile Fel 8.11 Absorption Spectra
8.12 Experimental Absorption Profile Cal 8.13 Biberman's Values for £(v)
1
The o b j e c t o f t h i s i n v e s t i g a t i o n i s t o s t u d y r a d i a t i o n l o s s e s
e n c o u n t e r e d i n t h e p r o d u c t i o n o f v e r y h i g h e n t h a l p y h y p e r s o n i c f l o w .
The w o rk i s p a r t o f a n e x t e n s i v e t h e o r e t i c a l and e x p e r i m e n t a l s t u d y
on t h e b e h a v i o u r o f s h o c k t u b e s and s h o c k t u n n e l s b e i n g c a r r i e d o u t
i n t h e P h y s i c s D e p a r t m e n t , A u s t r a l i a n N a t i o n a l U n i v e r s i t y ( A .N .U .)
1 .1 SHOCK TUNNEL FLOWS
The r e f l e c t e d s h o c k t u n n e l i s w i d e l y u s e d f o r l a b o r a t o r y
i n v e s t i g a t i o n s o f h i g h e n t h a l p y h y p e r s o n i c f l o w s . As shown i n
f i g u r e 1 .1 i t c o n s i s t s e s s e n t i a l l y o f a s h o c k t u b e f o l l o w e d by a
h y p e r s o n i c n o z z l e . I n o p e r a t i o n , t h e d i a p h r a g m a t A b u r s t s a t
a p r e d e t e r m i n e d p r e s s u r e a n d t h e h i g h p r e s s u r e g a s i n i t i a l l y b e h i n d
t h e d i a p h r a g m ( t e r m e d t h e d r i v e r g a s ) d r i v e s a s h o c k i n t o t h e q u i e s c e n t
t e s t g a s . T h i s s h o c k w ave p r o p a g a t e s down t h e s h o c k t u b e and r e f l e c t s
o f f t h e end o f t h e s h o c k t u b e . The r e f l e c t e d s h o c k l e a v e s a s l u g o f
s h o c k h e a t e d g a s a t t h e en d o f t h e s h o c k t u b e . T h i s g a s s l u g a c t s
as a r e s e r v o i r f o r t h e n o z z l e f l o w . Thus t h e r e a r e t h r e e d i s t i n c t
t y p e s o f f l o w w h i c h a r e e n c o u n t e r e d : t h e f l o w s a s s o c i a t e d w i t h t h e
i n c i d e n t s h o c k , t h e r e f l e c t e d s h o c k and t h e h y p e r s o n i c n o z z l e .
At low i n c i d e n t s h o c k s p e e d s , a r e a s o n a b l y u n i f o r m s l u g o f g a s
i s form e d b e h i n d t h e s h o c k f r o n t . The f a c t t h a t t h e s l u g i s u n i f o r m
and t h e th e r m o d y n a m ic c o n d i t i o n s b e h i n d t h e s h o c k f r o n t a r e u n i q u e l y
d e t e r m i n e d by b o t h t h e i n i t i a l c o n d i t i o n s o f t h e t e s t g a s and t h e s h o c k
v e l o c i t y [Gaydon and H u r l e (3-963)] ^ h a s g i v e n r i s e t o w i d e s p r e a d u s e o f
t h e s h o c k t u b e . P h y s i c i s t s h a v e e m p lo y e d i t t o s t u d y t h e p r o p e r t i e s
o f g a s e s a t h i g h t e m p e r a t u r e s ( i n c l u d i n g t r a n s i t i o n p r o b a b i l i t i e s ) .
C h e m is t s h a v e u s e d t h e s h o c k t u b e t o s t u d y m o l e c u l a r e x c i t a t i o n and
d i s s o c i a t i o n ^ a n d a e r o d y n a m i c i s t s h a v e u s e d t h e f l o w o f g a s p a r t i c l e s
b e h i n d t h e s h o c k f r o n t t o a n a l y s e f l o w o v e r b o d i e s a t h i g h s t a g n a t i o n
2 At the end of the shock tube the shock reflection which occurs essentially converts the kinetic energy of the gas behind the incident shock into internal energy. The densities and temperatures obtained therefore are higher than with the incident shock. However^the behaviour of the reflected shock is not as well understood as that of
the incident shock. Although the conditions behind the reflected shock can be determined with comparative ease for an ideal inviscid monatomic gas (Gaydon and Hurle [1963] ), problems arise with a real gas due to the interaction of the reflected shock with the boundary layer and the
contact surface (i.e. the upstream end of the slug of test gas). Nevertheless the stationary gas slug is quite important for physical
and chemical studies of gas properties at high temperatures and densities. For example, if these are sufficiently high the slug can be of interest to astrophysicists studying stellar interiors.
This stationary slug can be used in conjunction with a small orifice^and possibly a nozzle. The gas at the orifice is in a condition of thermodynamic equilibrium^due to the large number of
collisions that occur per unit time. However, as the gas flows down the nozzle it expands, the density drops gradually, and the collision rate may become insufficient to maintain thermodynamic equilibrium.
3
1 . 2 HIGH PERFORMANCE SHOCK TUNNELS
As c o u l d b e i n f e r r e d f r o m 1 . 1 , t h e g r e a t e r t h e i n i t i a l s p e e d ,
t h e g r e a t e r w i l l b e t h e t e m p e r a t u r e and d e n s i t y o f t h e s h o c k h e a t e d
g a s and t h e g r e a t e r w i l l b e t h e f l o w v e l o c i t y f r o m t h e n o z z l e . Hence
b o t h p h y s i c i s t s an d a e r o d y n a m i c i s t s a r e i n t e r e s t e d i n o b t a i n i n g h i g h e r
i n c i d e n t s h o c k v e l o c i t i e s .
By way o f i l l u s t r a t i o n , two i n t e r e s t i n g a p p l i c a t i o n s f o r h i g h
s p e e d s h o c k s may b e n o t e d . F i r s t l y , w i t h i n c r e a s i n g s h o c k s p e e d s ,
t h e e l e c t r o n d e n s i t y becomes s u f f i c i e n t l y l a r g e f o r t h e Debye l e n g t h
t o become c o m p a r a b l e w i t h t h e a v e r a g e d i s t a n c e b e t w e e n e l e c t r o n s . I n
t h i s s i t u a t i o n t h e s t a t i s t i c a l t h e o r i e s o f c o n v e n t i o n a l p l a s m a p h y s i c s
w i l l b r e a k down, and h e n c e t h e s e c o n d i t i o n s a r e o f i n t e r e s t t o
p h y s i c i s t s and e s p e c i a l l y t o a s t r o p h y s i c i s t s s t u d y i n g t h e t h e r m o d y n a m i c s
o f g a s e s i n t h e i n t e r i o r o f s t a r s . S e c o n d l y , t o s i m u l a t e t h e r e - e n t r y
f ro m a n i n t e r p l a n e t a r y m i s s i o n , a n a e r o d y n a m i c i s t r e q u i r e s a t t h e n o z z l e
e x i t a g a s f l o w v e l o c i t y o f a b o u t 1 . 2 x 1 0 f’c m / s e c ( f o r Mars an d V e n u s ) .
U s i n g a r e f l e c t e d s h o c k t u n n e l an d a n i n i t i a l p r e s s u r e o f 5 0 . 8 t o r r o f
a i r i n t h e s h o c k t u b e , t h e i n i t i a l s h o c k s p e e d r e q u i r e d t o g e t t h i s
c o n d i t i o n i s a b o u t 8 . 5 x 1 0 5c m / s e c .
As o ne g o e s t o h i g h e r s h o c k s p e e d s , e l e c t r o n s w i l l s t a r t t o b e
p r o d u c e d a n d , a s t h e i r numb er i n c r e a s e s , r a d i a t i v e e n e r g y l o s s w i l l
become s i g n i f i c a n t , R a d i a t i o n l o s s b e h i n d t h e s h o c k f r o n t , o r i n d e e d
any f o r m o f e n e r g y l o s s , c a u s e s a g r a d i e n t i n t h e t h e r m o d y n a m i c c o n d i t i o n s
b e t w e e n t h e s h o c k a n d t h e c o n t a c t s u r f a c e . He n ce t h e r e i s no l o n g e r a
u n i f o r m s l u g b e h i n d t h e i n c i d e n t s h o c k , b u t r a t h e r a s l u g w i t h a l o n g i
t u d i n a l g r a d i e n t o f t h e r m o d y n a m i c c o n d i t i o n s . H o w e v e r ^ i f a t h e o r y w e r e
a v a i l a b l e t o a c c o u n t f o r t h e e n e r g y l o s s , t h e c o n d i t i o n s c o u l d b e
e v a l u a t e d i n s p i t e o f t h e g r a d i e n t . At l ow s h o c k s p e e d s ( e . g . b e l o w
4
significant) is relatively small,and approximate theories suffice
[Coates and Gaydon (1966)] . However^as one strives for higher speeds, the gradient of thermodynamic conditions behind the incident shock becomes more pronounced and a more precise radiation model is required. At these higher speeds, the reflected shock will be moving into a substantial gradient of conditions which will cause further departures from the theory which applies to the ideal gas. Thus in the analysis of the stationary reservoir slug two factors need to be considered: the longitudinal gradient and the substantial energy loss.
Under conditions appropriate to the reflected shock region in these studies, simple calculations of the expected energy loss from an ionized argon plasma, without reabsorption included, indicate that all the energy of the gas would be lost in a few microseconds. Experimental evidence in the shock tunnel indicates that this large loss does not occur and theoretical calculations show that the actual loss is greatly reduced by reabsorption of radiation. For this reason a study of the radiation
loss in the various flows associated with the operation of a reflected shock tunnel, was initiated.
A study of these effects requires production in the laboratory of shock tube flows with electron densities exceeding l O ^ / c m 3, and
temperatures exceeding 15,000 °K. Such conditions can be readily obtained with argon using the free piston shock tunnel at A.N.U. Argon therefore is used as the test gas throughout this study,
1.3 RADIATION COOLING
5
Petshek et al (1955) considered the radiation losses associated with partially ionized argon. They used the Kramer- Unsold formula for the continuum radiation with an arbitrary set of Values for the unknown parameters contained in the theory. Using
this set of values and ignoring line radiation, they found good agreement between theoretical and experimental results, under the conditions
considered.
Pomerantz (1961) derived the emission coefficent for
continuum radiation and used it to consider radiative cooling in argon theoretically. However, he overestimated the lowering of the
ionization potential and considered only continuum radiation. He investigated the influence of absorption over a range of gas pressures for the case of a plane infinite shock.
Sevastvanenko and Yakubov (1964) showed theoretically that the previously neglected effect of line radiation is indeed important.
McChesney and Al-Attar (1965) repeated Pomerantz’s calculations for the case of no absorption using the Debye polarization theory to account for the lowering of the ionization potential.
Horn (1966) calculated the change in the thermodynamic conditions behind the shock front. He assumed that there was emission by free- free, free-bound and hound-bound transitions and also used a "realistic” choice for the parameters contained in the continuum theory. He found sizable energy losses resulting from low level bound-bound transitions, even though these lines experience absorption. He also found theory and experiment to be in good agreement.
Oettinger and Bershader (1967) treated the electronic relaxa tion of a shock heated argon plasma flow by means of a combined
6
this was coupled with the macroscopic conservation laws, it led to a rigorous formulation of the equations governing the relaxing flow. They solved the problem numerically.
Due to the much larger electron densities involved in this study the electronic transitions from both the neutral and ionized argon had to Be considered^along with their optical thickness. The optical thickness of the continuum radiation further complicates the radiation model.
1.4 SCOPE OF THE THESIS
The project arose out of the need to clarify the behaviour of gases in a high enthalpy shock tunnel^in which radiation losses play an important part in modifying the reflected shock tunnel theory for an ideal gas. This study concentrated almost entirely on
radiation; its content (spectroscopy); its manifestation (luminosity photographs) and its effect (energy loss).
The uniqueness of this study lies in the fact that the free piston operation gives conditions of electron density, electron tempera ture and pressure greater than those obtained in other shock tunnels. Hence great care had to be taken in applying to the present study,
theories that are acceptable at low Mach numbers or low electron densities. In fact, it is for this reason that most theories are
discussed in detail in the text. Most of the theories used are based on a simplification of the real situation and hence the mode of approach is to set up the relevant equations and, if possible solve them in a manner applicable to the conditions occuring.
Of necessity, the study involves a number of research fields, namely the physics of fluids, plasma spectroscopy, photography and
numerical analysis, although important, was nevertheless commonplace and hence it is not discussed in detail. On the other hand, the methods of photographic analysis were culled from a variety of sources, ward
and adapted to the conditions which were peculiar to the shock tube? which produced moderately bright but somewhat short flashes. Thus
there is a comparatively detailed discussion of photography in a review paper (Logan 1971 B) associated with this study.
As this is essentially an initial study of the different radiating flows, no attempt has been made to concentrate on any one section of the work^but rather to establish the general patterns of behaviour. For this reason only the relatively commonplace equipment already available in the department was used?and this is described only briefly.
Looking at the thesis as an integrated study, the central theme is the effect that energy loss has on the plasma flows encountered in the operation of a high performance shock tunnel. Even behind the incident shock, it has been necessary to extend existing radiation models for many of the incident shock conditions encountered in this study. The electron densities in the present study are at least an order of magnitude greater than those used in other experimental analyses and as
a result, the continuum is becoming optically thick. The model
proposed is based on a spherical model similar to that of Horn (1966), but with extra transitions for the neutral atom and some low level transitions for the ion. Each transition is analysed separately with regard to the optical thickness. As the energy loss is becoming quite appreciable at the electron densities encountered, the thermodynamic conditions of this study represent a much more stringent test for the radiation model than those previously studied experimentally.
8 beginning to interact with the mass loss through the boundary layer. This effect is unimportant at lower shock speeds.
Behind the reflected shock^and in the reservoir slug, the gas is opaque to all radiation,and hence further development of the radiation model is required. Other phenomena associated with the reflected shock and the reservoir slug also have to be considered, because the radiation loss may be influenced by modifications to the test slug caused b}' the gas upstream of the contact surface.
The test slug, which continually loses energy due to radiation loss, serves as a reservoir for the nozzle flow5and hence radiation loss is important both in the test slug and, to a lesser extent, in the gas flow through the throat and down the nozzle. Although the simplified radiation model given here can predict the
conditions down the nozzle, the actual complete radiation field in the nozzle is studied in a separate chapter because it has interesting astrophysical analogies. The gas in the reservoir region is optically opaque and it becomes optically thin as it goes down the nozzle. Bence the radiation field observed looking up the centre of the nozzle^ towards the throat, is similar to that of a stellar atmosphere.
The actual flow in the test section is unimportant from the point of view of radiative energy loss, because the electron densities are relatively low. However this flow is important in that it throws light on behaviour in the reflected shock region and in the nozzle. Apart from this evidence, information on the reflected shock region is relatively scarce.
1.5 LAYOUT OF THE THESIS
(Chapter 6) and nozzle flow (Chapter 7). Chapter 8 discusses absorption spectra in the nozzle. This is logically a part, of Chapter 7, but has been devoted a separate chapter because it is complete in itself. The early chapters set the stage for later studies, Chapter 2 discusses the behaviour of both the argon atom and its associated radiationfand Chapter 3 discusses the experimental measurements made with photographic emulsions. Chapter 9 draws
together the conclusions for the thesis.
Due to the nature of this thesis, there needed to be a large number of appendices. However because of the general
applicability of these appendices, they were subsequently rewritten as review papers (Logan 1971 A, 1971 B, 1971 C, 1971 D ) . These contain mainly theoretical analyses which are extensions and discussions of previous literature on the subjects. Appendix B on fundamental concepts, takes out of the thesis itself the definitions of the many concepts used.
1.6 SUMMARY
No matter if one is a physicist, astrophysicist, aerody- namicist or chemist striving for higher performance in a shock tunnel, the problem of radiation loss from the test gas cannot be avoided. Theoretical studies have been done previously^but are generally only applicable to thermodynamic conditions much lower than those experienced in this present study. In the other studies, the line radiation is largely ignored or, alternatively, lost in the uncertainties of the continuum theory and furthermore, the gas is usually considered
transparent towards continuum radiation. This study takes into account all the electronic transitions in the neutral atom and some lower
Furthermore, "proper” wavelength dependent values are used for the
continuum radiation from argon, as opposed to other studies that
used an average "realistic" choice of the unknown parameters. In
addition, the optical depth of the continuum radiation has been
11
T h i s t h e s i s i s c o n c e r n e d w i t h t h e b e h a v i o u r o f t h e v a r i o u s
r a d i a t i n g f l o w s t h a t a r e p r e s e n t i n a h i g h p e r f o r m a n c e s h o c k t u n n e l .
I t s e e k s t o i n v e s t i g a t e t h e c h a r a c t e r i s t i c s o f t h e r a d i a t i n g f l o w s
p r i n c i p a l l y b y u s i n g t h e e m i t t e d r a d i a t i o n a s a d i a g n o s t i c t o o l .
The m o s t c o n v e n i e n t b e g i n n i n g t o s u c h a s t u d y i s a d i s c u s s i o n on t h e
a c t u a l s h o c k t u n n e l a s s e m b l i e s ( 2 . 1 ) u s e d , t h e th e rm o d y n a m ic
p r o p e r t i e s o f t h e t e s t g a s ( 2 . 2 ) and t h e q u a n t i t i e s m e a s u r e d ( 2 . 3 ) .
A summary i s g i v e n i n S e c t i o n 2 . 4 .
2 . 1 DESCRIPTION OF A.N .U. SHOCK TUNNEL ASSEMBLIES
I n C h a p t e r 1 t h e b a s i c p r i n c i p l e s o f s h o c k t u n n e l
o p e r a t i o n w e r e d i s c u s s e d . As n o t e d i n t h a t c h a p t e r t h e p r e s e n t
s t u d y w o u ld h a v e b e e n g r e a t l y r e s t r i c t e d w i t h o u t t h e h i g h
p e r f o r m a n c e c a p a b i l i t i e s o f t h e A .N .U . s h o c k t u n n e l a s s e m b l i e s .
T h e r e f o r e , a l t h o u g h d e t a i l e d d i s c u s s i o n i s o u t s i d e t h e s c o p e of
t h i s t h e s i s , t h i s s e c t i o n d e s c r i b e s t h e m ore i m p o r t a n t c h a r a c t e r
i s t i c s o f t h e A.N .U. a s s e m b l i e s .
A s c h e m a t i c d i a g r a m i s shown i n F i g u r e 2 . 1 . An a s s e m b l y
i s d e s c r i b e d i n d e t a i l b y S t a l k e r ( 1 9 6 7 ) .
The r e s e r v o i r ^ w h i c h i s i n d i c a t e d a t t h e l e f t , i s f i l l e d
w i t h c o m p r e s s e d a i r . When t h e a i r i s r e l e a s e d i t p u s h e s a ’’f r e e "
p i s t o n down t h e c o m p r e s s i o n t u b e . The " d r i v e r ” g a s ?w h ic h i s i n t h e
c o m p r e s s i o n t u b e t o t h e r i g h t o f t h e p i s t o n ^ i s c o m p r e s s e d u n t i l i t s
p r e s s u r e e q u a l s t h a t o f t h e c o m p r e s s e d a i r . H o w e v er, a t t h i s s t a g e
t h e p i s t o n p o s s e s s e s a l a r g e k i n e t i c e n e r g y and w i l l c o m p r e s s t h e
d r i v e r g a s e v e n f u r t h e r a s i t d e c e l e r a t e s . The p i s t o n would
e v e n t u a l l y move b a c k a f t e r i t h a d come m o m e n t a r i l y t o r e s t . B e f o r e
t h i s o c c u r s h o w e v e r , t h e m i l d s t e e l d i a p h r a g m i s d e s i g n e d t o b u r s t ,
a n d t h e s h o c k t u b e f l o w i s i n i t i a t e d . As w i l l b e d i s c u s s e d l a t e r ,
types of tunnels because the compression results in higher temperatures in the driver gas.
When the steel diaphragm bursts, an unsteady expansion passes back into the compression tube and another drives a shock into the low pressure test gas. The interface between the driver gas and the test gas (the contact surface) collects the test gas in front of it as it passes down the shock tube .and hence the slug of shock heated test gas grows as the shock system propagates down the tube. The contact surface in this process acts like a "supersonic piston".
The shock front hits the end wall, breaking the mylar diaphragm on impact„and reflects back into the shock heated slug, compressing it and bringing it to rest. This reflected shock hits the contact surface and a transmitted shock passes through the driver gas.
As the test section indicated to the right of the shock tube is initially evacuated, a flow through the nozzle throat occurs when the mylar diaphragm bursts, the stationary slug of test gas being the reservoir. At the exit of the nozzle, the gas flow produced is
hypersonic, and flows over various shaped models can be studied in the test section.
2.2 RADIATION FROM SHOCK HEATED ARGON
p r o v i d i n g a t e c h n i q u e t o d i a g n o s e t h e g a s p r o p e r t i e s , i s a l s o a v e r y
i m p o r t a n t m e c h a n i s m f o r e n e r g y l o s s .
The r a d i a t i o n t h a t i s e m i t t e d f r o m t h e g a s c o n t r i b u t e s
s i g n i f i c a n t l y t o i t s e n e r g y l o s s . As t h e s t r o n g s h o c k p r o p a g a t e s
i n t o t h e q u i e s c e n t a r g o n t h e g a s u n d e r g o e s a n e x t r e m e l y r a p i d i n c r e a s e
i n e n t h a l p y . The s t a t i s t i c a l e q u i l i b r i u m i s t e m p o r a r i l y d e s t r o y e d ?
and a n o n e q u i l i b r i u m e l e c t r o n i c s t a t e e x i s t s w h i c h h a s a s h o r t
r e l a x a t i o n t i m e . I n t h e l a t t e r p a r t o f t h i s e q u i l i b r a t i o n p r o c e s s ,
v i s i b l e r a d i a t i o n b ec ome s a p p a r e n t . As a r e s u l t o f t h e s u b s e q u e n t
r a d i a t i o n l o s s , t h e e n t h a l p y o f t h e g a s i s a p p r e c i a b l y a l t e r e d and
h e n c e t h e t r a n s i e n t e q u i l i b r i u m s t a t e i s c h a n g e d . I n a d d i t i o n ,
t h e r e w i l l b e o v e r a l l e n e r g y l o s s e s d u e t o t h e r m a l c o n d u c t i v i t y and
d i f f u s i o n . (Lo ga n (1971C) showed t h e s e a r e r e l a t i v e l y s m a l l . )
The e m i t t e d r a d i a t i o n w i l l t a k e t h e f o r m o f l i n e and
c o n t i n u u m r a d i a t i o n . The b a s i c r e a c t i o n s a r e d i s c u s s e d i n t h e
r e v i e w p a p e r (Lo ga n 1 9 7 1C) »h o w e v e r ?t h e i m p o r t a n t f e a t u r e s o f t h a t
d i s c u s s i o n a r e p r e s e n t e d h e r e .
The r e a c t i o n s g i v i n g r i s e t o c o n t i n u u m r a d i a t i o n a r e t h e
f r e e - f r e e t r a n s i t i o n s .
13
,+ _ + _
hv
A + e A + e +
A + e -* A 4- e + hv
and t h e f r e e - b o u n d t r a n s i t i o n
A+ + e A( p) + hv
t h o s e g i v i n g r i s e t o l i n e r a d i a t i o n a r e t h e s p o n t a n e o u s and s t i m u l a t e d
e m i s s i o n s .
A( p) + A( q) + hv
pq
A(P) + hv A ( q ) + hv + hv
pq pq pq
T h e s e r e a c t i o n s , a l t h o u g h r a t h e r i n s i g n i f i c a n t i n t r a n s f e r r i n g
e n e r g y w i t h i n t h e s y s t e m when c ompa r ed t o o t h e r p o s s i b l e p r o c e s s e s ,
14
processes for losing energy directly from the system.
For continuum radiation the full analysis has been
discussed in the review paper (Logan 1971C), and throughout the
thesis, the expression used for the emission coefficient is
where c,
(v,T)
128r3e6
3/3h3c3
N N .
c2-mr s(v’
T) >
k T 2
,-52
9.4 x 10 in c.g.s. units ,
and is the electron density and N. the ion density. S c h l ü t e r ’s
values of £(v,T) are used (1962).
The radiation loss due to continuum radiation from an
optically thick plasma is given by
Q c = /q 6.842 x 10 33 £(v,T) ~ exp(-pk^R)dv >
where the exponential term is due to reabsorption (with pk^R the
optical depth. Logan (1971D) )
For a spectral line resulting from a transition from
the pth to the qth bound states, the total intensity for spontaneous
emission is given by I
In equilibrium I
N A hv
p pq pq
N T 0 T A L ®
Pq
(T)
h c K
g A hv exp{- -t t t'}
s p pq pq kT
The line shape is described by a function L(v) (Appendix B ) . For
a Stark broadened line, the line absorption coefficient is given by
a dispersive profile pk
*
A B
v / , 2 2 >
( v - v Q) +B
* e2N f hv
with A = {1 - e x p c - - ^ )} and B = Av
h '
Under the thermodynamic conditions of the present study,
the Stark broadening will usually be greater than Doppler broadening,
15 dispersive type profile used throughout.
The energy lost from the plasma due to an optically thick line is given by
Q “ Q* (tv = 0) exp(-Tvo/2) Iq (tv q/2) exp (~rvc) ,
where I (x) is the modified Bessel function of the first kind of o
order zero, and t is the optical depth of the continuum radiation, the optical depth at the line centre, is given by
pk R vo
A* B R
2.3 PHYSICAL CONCEPTS AND MEASUREMENTS
As noted in Chapter 1, the equipment used to obtain the experimental data was relatively commonplace and hence this section concentrates on the physics involved in interpreting the measurements rather than the actual measurements. In some cases a straightforward relationship exists between the measured quantity and the character istic of the gas being determined. However with other gas parameters, the relationship between the definition of the gas parameter and the actual quantity measured, needs to be carefully analysed.
Two of the more difficult concepts to understand are temperature and electron density. As these are very important in the comparison of theory and experiment, it is necessary to discuss their definition and their measurement.
2.3.1 Temperature
Each species present (i.e. electron, atom etc.) will have a characteristic temperature, so that in a laboratory plasma there will be essentially three temperatures; the ion temperature, the
atom temperature and the electron temperature. Because the
16
t e m p e r a t u r e s c o u l d s t i l l b e q u i t e d i f f e r e n t . I n some c a s e s i n t h i s
t h e s i s i t i s p o s s i b l e f o r t h e e l e c t r o n s a n d t h e a t o m s and i o n s t o
h a v e d i s t r i b u t i o n f u n c t i o n s c o r r e s p o n d i n g t o d i f f e r e n t t e m p e r a t u r e s .
T h i s c o u l d b e e n c o u n t e r e d w i t h i n t h e s h o c k s t r u c t u r e ( Chubb[ 1 9 6 9 ] ) and
p o s s i b l y i n t h e l a t t e r s t a g e s o f t h e n o z z l e f lo w^ wh e n t h e c o l l i s i o n
f r e q u e n c y i s n o t f a s t e n o u g h t o m a i n t a i n e q u i l i b r i u m . N e v e r t h e l e s s ,
i n m o s t s i t u a t i o n s c o m p l e t e l o c a l t h e r m a l e q u i l i b r i u m w i l l h o l d due
t o t h e h i g h c o l l i s i o n r a t e .
D o p p l e r b r o a d e n i n g o f an atom o r i o n l i n e , i f m e a s u r e a b l e ,
y i e l d s t h e atom o r i o n t e m p e r a t u r e i f t h e p l a s m a i s i n e q u i l i b r i u m
I
( t h e b r o a d e n i n g i s d u e t o t h e r a n g e o f v e l o c i t i e s i n t h e M a x w e l l i a n
d i s t r i b u t i o n ) . I f t h e e l e c t r o n s a r e i n e q u i l i b r i u m , t h e e l e c t r o n
t e m p e r a t u r e c a n b e d e t e r m i n e d f r o m t h e r e l a t i v e i n t e n s i t i e s o f l i n e s
f rom t h e same e l e m e n t an d i o n i z a t i o n s t a g e }o r a l t e r n a t i v e l y by t h e
r e l a t i v e i n t e n s i t i e s o f l i n e t o c o n t i n u u m r a d i a t i o n . F o r n e u t r a l
a r g o n mo st o f t h e v i s i b l e r a d i a t i o n a r i s e s f rom u p p e r l e v e l s ^ w h i c h
a r e v e r y c l o s e t o e a c h o t h e r . T h i s r e n d e r s t h e r e l a t i v e l i n e
m et h od h i g h l y i n a c c u r a t e . Howe ver when u s e d i n c o n j u n c t i o n w i t h
i n f r a r e d l i n e s f r o m a d i f f e r e n t g r o u p o f e n e r g y l e v e l s , u s e f u l
i n f o r m a t i o n can b e o b t a i n e d . The l i n e - c o n t i n u u m r a t i o m et h od d e p e n d s
on t h e r e l i a b i l i t y o f t h e c o n t i n u u m t h e o r y . I f t h e r e a r e i m p u r i t i e s
p r e s e n t , w h i c h a r e i n l o c a l t h e r m a l e q u i l i b r i u m w i t h t h e m a i n s y s t e m ,
t h e n by c o n s i d e r i n g t h e i m p u r i t y l i n e s , t h e r e l a t i v e l i n e i n t e n s i t y
m e t h od c a n b e u s e d t o d e t e r m i n e t h e e l e c t r o n t e m p e r a t u r e ( C h a p t e r 3 ) .
2 . 3 . 2 E l e c t r o n D e n s i t y
A n o t h e r p a r a m e t e r e x t e n s i v e l y u s e d i n s h o c k t u b e a n a l y s i s
i s t h e e l e c t r o n d e n s i t y . The c o n c e p t i s q u i t e e a s i l y c o m p r eh en d e d
v i z . t h e number of e l e c t r o n s p e r u n i t v o l u m e . How ever , i t s m e a s u r e
men t i s n o t s o s i m p l e .
17 electron density, although each depends critically on the magnitude of the electron density to be measured. For the electron densities involved in the present study, two methods are available.
In the first method the optical refractivity of the gas is measured with an interferometer. Each of the species present will contribute to the refractivity. As the wavelength dependence of each species is different, the number density of all species can be determined by measuring the refractivity of the gas at a suitable number of wavelengths.
The second method involves the Stark broadening of a spectral line, arising from electronic transitions in either test gas or impurity atoms (Logan 1971 A). The presence of charged particles shifts the electron energy levels, and due to the statistical nature of the charged particle distribution, the spectral line, arising from a transition from the shifted level, will appear broadened. The amount of broadening (or shifting) will depend on the charged particle density^and hence by measuring
the broadening, by means of a suitably defined parameter such as the half width, the electron density can be determined. As this method relies solely on the. emitted radiation, it was used
extensively throughout the investigation, though refractivity measurements were also included*
2.4 SUMMARY
As noted in Chapter 1, the electron densities and to a lesser degree the temperatures of this present study, are larger than those experienced in other shock tunnel assemblies. This higher performance capability comes about through the free piston technique, in which the driver gas is heated due to compression by the free piston.
dynamics of shock heated argon have been discussed.
CHAPTER 3
The shock tube assemblies used have been described and the theories of radiation and basic concepts discussed in the previous chapters. In this chapter the experimental measurement techniques and analysis used are discussed. It was pointed out in Chapter 1 that radiation is the central, theme of this thesis and hence measurement of the emitted radiation is very important. For this reason the use of photographic emulsions to record emitted radiation and other spectro scopic techniques are discussed in detail. Non-spect.roscopic techniques are only discussed briefly.
The methods of making experimental measurements and the
associated problems are discussed separately in this chapter so that in following chapters the discussion of the basic physics will not become encumbered with these details. A clear understanding of these methods is also required because the experimental results must be interpreted in the light of the techniques and equipment used. The principles behind the measurements and the application of these principles are discussed at some length but the actual apparatus used is discussed only briefly.
The experimental techniques discussed in this chapter are (3.1) The Spectrometer
(3.2) The Monochromator
(3.3) The Photographic Emulsion (3.4) The Image Converter Camera (3.5) Luminosity Photography (3.6) The Pressure Transducer
(3.7) The Mach Zehnder Interferometer A summary is given in 3.8 .
The positions at which experimental data were obtained are indicated on the schematic diagram of the shock tunnel (Figure 3.1).
3.1 THE SPECTROMETER
20 spectrometer and a medium quartz spectrometer, were used to study the wavelength dependence of the emitted radiation. Although their basic optics were different, the principle of operation of each was similar. The shock tunnels used had turnaround times of the order of 30 minutes and this made single wavelength analysis (with a monochromator)
impractical for determination of wavelength dependence. The use of a polychromator would have enabled a number of wavelengths to be observed simultaneously. However, as a polychromator was not available, photo graphic emulsion had to be used in conjunction with a spectrometer to obtain the results required.
Various operations which were necessary to interpret the spectrometer results are discussed in this section. These are: the determination of wavelength on a developed emulsion (3.1.1), the focusing of the emitted light (3.1.2) and the acquisition of time resolved spectra
(3.1.3) . In addition to this the techniques used to determine the thermodynamic conditions are discussed. These include: line broadening
(3.1.4) , line shifting (3.1.5), relative line intensity (3.1.6), line to continuum intensity (3.1.7) and other techniques (3.1.8).
3.1.1 Wavelength Determination
The dispersion of light by a medium is described by Cauchy's formula viz n - 1 = A { 1 + + ~ ■ + ... }
X2 X4 where (n - 1) is termed the refractivity.
In the case of refractive index of glasses the alternate form cx of Hartman is thought to give better agreement, viz n = n H--- -— —
°
However, for this thesis a version, simplified for a desk
CX
calculator was found to give very good results, viz n = n^ + o
Hence, when using a prism spectrometer, the distance of spectral lines from a fixed standard on a photographic plate is given by
C
X = X + y r — r—
r-o (X-X ) o
i n t h i s e q u a t i o n .
21
I n t h e i n i t i a l s t u d i e s a m e r c u r y s p e c t r u m was r e c o r d e d o n t h e
e m u l s i o n and a l e a s t s q u a r e a n a l y s i s was p e r f o r m e d o n t h e s p e c t r a l l i n e s
t o a c c u r a t e l y d e t e r m i n e t h e c o n s t a n t s i n t h e e q u a t i o n . Once t h e s e
c o n s t a n t s w e r e d e t e r m i n e d t h e w a v e l e n g t h s w e r e c a l c u l a t e d and c o mp a re d
w i t h t h e s p e c t r a l t a b l e s (Moore ( 1 9 5 9 ) ; M e g g er s e t a l ( 1 96 1 ) ) . However
f o r l a t e r s t u d i e s t h e d e s k c a l c u l a t o r p r o g r a m was u s e d , a n d t h i s
d e t e r m i n e d t h e w a v e l e n g t h s w i t h s u f f i c i e n t a c c u r a c y t o i d e n t i f y t h e l i n e s
o
( v lA ) . T a b l e 3 . 1 shows a s e t o f t y p i c a l v a l u e s o f x a n d X and t h e
v a l u e o f X o b t a i n e d u s i n g t h e d e s k c a l c u l a t o r .
3 . 1 . 2 R e c o r d i n g o f E m i t t e d L i g h t
Two s y s t e m s w e r e u s e d t o o b t a i n s p e c t r a f ro m t h e g a s . I n t h e
c a s e o f a s t r o n g l y r a d i a t i n g g a s t h e l e n s s y s t e m was f o c u s s e d on a s m a l l
e l e m e n t o f l u m i n o u s g a s . However a s e c o n d m e t h o d ha d t o b e u s e d i n
c a s e s w h e r e t h e g a s was n o t l u m i n o u s e no u gh f o r t h e e m i t t e d l i g h t t o b e
r e c o r d e d . T h i s e n t a i l e d ma ki n g t h e g a s more l u m i n o u s by p a s s i n g i t
t h r o u g h a n a d d i t i o n a l s h o c k . The g a s c o u l d t h e n b e o b s e r v e d
s p e c t r o s c o p i c a l l y and t h e t h e r m o d y n a m i c c o n d i t i o n s b e h i n d t h e s h o c k
d e t e r m i n e d . Un d e r some c o n d i t i o n s , t h e t h e r m o d y n a m i c c o n d i t i o n s i n f r o n t
o f t h e a d d i t i o n a l s h o c k c o u l d t h e n b e i n f e r r e d . However i t c o m p l i c a t e d
t h e m a t h e m a t i c s a s t h e a d d i t i o n a l s h o c k ha d t o b e t a k e n i n t o a c c o u n t .
3 . 1 . 3 Time R e s o l v e d S p e c t r a
To t i m e r e s o l v e t h e s p e c t r a , a r o t a t i n g d i s c i s u s e d i n f r o n t
o f t h e s p e c t r o m e t e r e n t r a n c e s l i t . The r o t a t i n g d i s c h a s s m a l l s l i t s i n
i t , w h i c h a r e so s p a c e d t h a t t h e r e i s a l w a y s o n e s u c h s l i t on p a r t o f t h e
e n t r a n c e s l i t o f t h e s p e c t r o m e t e r (shown i n F i g u r e 3 . 2 ) . V a r i o u s d i s c s
and m o t o r s w e r e a v a i l a b l e and t h e b e s t r e s o l u t i o n t i m e was 4visec u s i n g an
a i r t u r b i n e m o t o r , a 4 i n c h d i a m e t e r d i s c and 0 . 0 1 i n c h s l i t s . (The
r e s o l u t i o n t i m e i s d e f i n e d a s t h e t i m e e a c h e l e m e n t on t h e p h o t o g r a p h i c
22 Because a resolution tirpe of 4ysec was not fast enough to
uniquely determine the time dependent thermodynamic conditions behind the shock, a semi-theoretical analysis had to be used. In this approach the theoretical values were calculated and the experimental results.expected for the resolution time used, were computed. In this way theory and experiment could be compared. This analysis is essential for a quantity with a complex relationship between the thermodynamic conditions and the measurement; e.g. the line width of a spectral line whose broadening
and shifting are time dependent.
However, in simpler cases, such as the intensity of continuum radiation the "actual” time dependence of the radiation can be
"deconvoluted" from the measured time dependence as explained below. The experimentally observed results are due to convolution. The actual time dependence, V(t) say, is modified by the "resolving disc" or
"apparatus" function, A(t-x), to give the experimentally observed value E(x). The relationship between these three is
E(x) = V(t) A(t-x) dt
( N.B. In the case of A(t-x) being a delta function {E(x) = V(t )} .) Thus a profile can be convoluted if the integration can be performed. One method of solution is through the Fourier transform. The Fourier transform of G(a) is defined by F(x) = /_raG(a)exp(iax)da
oo
and the inverse transform is given by G(a) = --- / F(x)exp(-iax)dx. /2tt
Using the Fourier transform one has
F{E(x)} = F{V(t)} x F{A(t-x)} or E(x) = G{ F{V(t)} x F{A(t-x)} }
This calculation can be quickly done on a computer.
Figure 3.3 shows a typical theoretical time dependent radiation signal and the effect of convolution of this signal. The square
3.1.4 Line Broadening
The constant deviation spectrometer was used to measure the
half width of spectral lines and hence to determine the electron density.
The theory for line broadening is discussed in the review paper
(Logan (1971A ) ) (the ion density has been included in the theoretical
derivation). For the electron density to be well specified the profile
of the line should be a Stark profile (Gaussian). One can then find
the density by comparing various theoretical Stark profiles (plotted
log I/Iq vs X, to give a larger range of applicability) to the
experimental ones and determining which one gives the best fit. This
method will also tell if the profile, is in fact a Stark profile.
Alternatively, if the profile is approximately a Stark profile then one
can use the "line widths" to find the electron density.
As noted when discussing convolution, the broadened profile
may not be a Stark profile but rather a time or position averaged
composite profile. It is known that if I-poTAI t^le tota^
intensity of the spectral line then the intensity at wavelength A, 1(A)
is given by
1(A)
1TOTAL L ^
where L is the line profile function given by
A-A
L(A) S(«) and
c j
2^3 c j 2//33 e 3 e
Because the intensity of a spectral line is given by
'TOTAL
C,N exp(I/lcT) exp(-E./kT)
^ a_____ 3____
3/2 y (T) T
the integrated intensity observed is
t /■» \ C4 rl 2 (t) exp{ (I-Bp)/kT(t) } S(q,t) dt
iu; - r
o/?
L3 t l y(T) T(t)3/Z
and if a theory is proposed to account for the time variation in Ne and
Te then the integral can be performed numerically. Figure 3.4 shows H
3
profiles for three different electron densities. The sum of these is
24
I n many o f t h e s i t u a t i o n s e n c o u n t e r e d i n t h i s t h e s i s , t h e
s p e c t r a l l i n e i s S t a r k b r o a d e n e d . I n s u c h a c a s e i t i s more c o n v e n i e n t
t o m e a s u r e t h e i n t e n s i t y a t t h e l i n e ’s c e n t r e t h a n t h e t o t a l l i n e
i n t e n s i t y . Once t h e p e a k v a l u e h a s b e e n o b t a i n e d o n e c a n e i t h e r c h a n g e
t h e t h e o r e t i c a l a n a l y s i s t o a c c o u n t f o r t h e p e a k i n t e n s i t y o r e l s e
c a l c u l a t e t h e t o t a l i n t e n s i t y f r o m t h e p e a k i n t e n s i t y . Such a c o n v e r s i o n
r e q u i r e s t h e h a l f w i d t h , AA^., t h e s l i t w i d t h , d , and t h e s p e c t r o m e t e r
d i s p e r s i o n , D .
A
The p e a k i n t e n s i t y i s
D d
I TOTAI X° + ~ Z ~
I(>.o) = — -- / D . d L(X) cU
7T A O ---—
1 AX^
w h e r e t h e l i n e s h a p e L(A) = — -7-.—~—x~n—;—-7 7—
it ( A-Ao) z + AAA
'2.
3 . 1 . 5 L i n e S h i f t s
I n t h e c o u r s e o f t h e d i s c u s s i o n o n l i n e b r o a d e n i n g i n t h e
r e v i e w ( L o g a n ( 1 9 7 1 A ) ) t h e c o n c e p t o f a l i n e s h i f t a l s o o c c u r r e d an d was
d i s c u s s e d . I n p r i n c i p l e a l i n e s h i f t i s a r e a d i l y o b t a i n a b l e
m e a s u r e m e n t . However t h e t h e o r e t i c a l c a l c u l a t i o n s a r e t h o u g h t t o be
n o t a s a c c u r a t e a s t h o s e f o r l i n e b r o a d e n i n g . F u r t h e r m o r e , t h e a c t u a l
m e a s u r e m e n t of t h e l i n e s h i f t i s made more d i f f i c u l t by t h e b r o a d e n i n g
o f t h e l i n e . T h i s i s u s u a l l y o f a c o m p a r a b l e m a g n i t u d e t o t h e s h i f t
and i t make s t h e c e n t r e o f t h e l i n e l e s s w e l l d e f i n e d . I n a d d i t i o n ,
w i t h i n c r e a s i n g t e m p e r a t u r e , t h e l i n e t o c o n t i n u u m i n t e n s i t y r a t i o
d e c r e a s e s and t h i s make s t h e d i s t i n c t i o n b e t w e e n t h e two l e s s p r o n o u n c e d .
3 . 1 . 6 R e l a t i v e L i n e I n t e n s i t i e s
The p h y s i c s o f t h e s i t u a t i o n and t h e c o n c e p t o f e l e c t r o n
t e m p e r a t u r e h a s b e e n d i s c u s s e d i n C h a p t e r 2. The m a t h e m a t i c s o f t h e
m et h od i s a s f o l l o w s .
I n l o c a l t h e r m a l e q u i l i b r i u m ( L . T . E . ) , t h e i n t e n s i t y o f a n a t o m i c
Thus
I. . = NTOT r.A.. exp(-E./kT)
3-1 J J1 h i 3
o
ln I
= lnA o A ) + ln(M) .
1X1 J-j-i l n ( y (T)) + l n (X ) kT
where g^. is the multiplicity of the j th level, A^_. is the transition
probability and N ^ is the total number of atoms of that element and
ionisation series, (later referred to as a species), y(T) is the partition function.
g -iA -i i
Because I.., — 7— -— , E. will vary from line to line in the
Ji X._. j
£A
jispectrum and -r— , E are known constants for most spectral lines, the
A
plot of l n ^ — ^ - ln I against E^ should yield a straight line of slope A — . Furthermore a straight line wrould imply that the assumption
K. JL
of equilibrium for this species is valid, though it does not
necessarily mean that other species also present are in "equilibrium" and at the same temperature. (Figure 3.5 shows a typical graph).
Alternatively, if only two upper levels are present in an equilibrium condition, then
10 (§ 9^9 ^
X
n~ = /“ T — {~(E.0-E.1)/kT}
1 1 X2 3 2 J 1
T h u s , once a temperature and density has been established, a
theoretical check can be made to see if approximate equilibrium holds.
3.1.7 Line to Continuum Intensity Ratio
The test gas of interest in this thesis is argon. Recently
theoretical and experimental values of the continuum radiation have been
shown to be in moderate agreement (Logan (1971C)). Hence using the
theoretical values of Schlüter (1963) for the wavelength dependence of radiation, £ , the intensity of continuum radiation in a wavelength
A
interval 6A is
( in c .g .s . units).
A K , N c 6\
I = — — j— ^--- where K, = 6.842 x 10
c
A
2 126
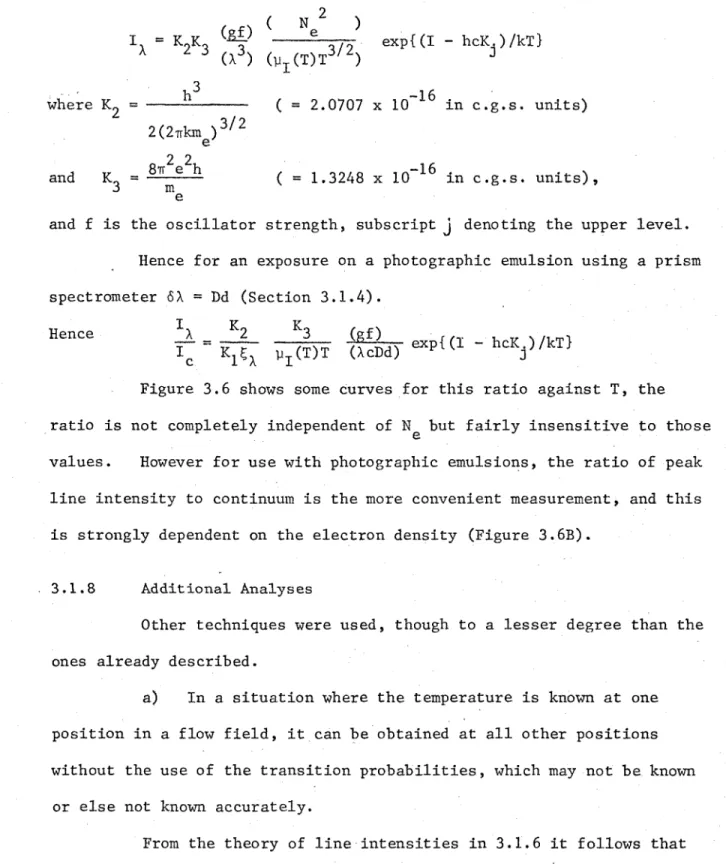
1 X “ k 2K 3 ,,3
f fv ( N )
---- ^ -3/2 exP{(x " hcKj)/kT} (X ) (yI (T)T )
where Kh
and K,
-16
2 (2Trkm )
2 2
8tt' e h 3/2
( = 2.0707 x 10 in c.g.s. units)
( = 1.3248 x 10 ^ in c.g.s. units),
and f is the oscillator strength, subscript j denoting the upper level.
Hence for an exposure on a photographic emulsion using a prism
spectrometer 6X = Dd (Section 3.1.4).
Hence k . = - I ! . _ l i _ M I eXp{(i - hcK )/kT}
X c K ^ x W j C D T (XcDd) C X p U i j "
Figure 3.6 shows some curves for this ratio against T, the
ratio is not completely independent of but fairly insensitive to those
values. However for use with photographic emulsions, the ratio of peak
line intensity to continuum is the more convenient measurement, and this
is strongly dependent on the electron density (Figure 3.6B).
3.1.8 Additional Analyses
Other techniques were used, though to a lesser degree than the
ones already described.
a) In a situation where the temperature is known at one
position in a flow field, it can be obtained at all other positions
without the use of the transition probabilities, which may not be known
or else not known accurately.
From the theory of line intensities in 3.1.6 it follows that
the relative intensity of a line at two positions is
hcK, IX^X2‘) n t(x2) po(T(x1)}
W ~ y o( T ( x 2 ) ) n t (x -[)
exp{-J-
(
1 1T(x2) T(x2)■)>
1 (x )
Hence a plot of ln X 2 against the x^avenumber K. gives a
W
J
line of slope — { 1
b) If the electron density is known approximately, the temperature can be calculated from the relative intensities of spectral lines from successive ionization states (Griem (1963)). Furthermore Griem discusses how the absolute intensity can be used to measure the number density if the temperature is known.
c) In an attempt to overcome impurity radiation in the test section flow, a condenser was discharged across the test section which gave rise to a "spark spectrum" that was in turn swept downstream by the flow. These spectra were obtained in order to measure the
contamination of the nozzle flow, by the driver gas. However this work was only partially successful because the only characteristic line
spectrum that was visible above the impurity radiation was the argon spectrum (Ar II). Hence using air or nitrogen as the test gas and argon as a seed in the driver 2%) the presence of argon could then be detected in the test section when the driver gas came through. However, as air and nitrogen were only of marginal interest to this
thesis, these results are not presented. However a fuller
investigation with differing seeds with complete calibration could lead to spark spectra being a useful diagnostic technique.
3.2 MONOCHROMATOR
The constant deviation spectrometer had an attachment that provided the spectrometer with an exit slit thus making it a
monochromator. A photomultiplier was placed behind the exit slit. Hence the emitted radiation in a wavelength interval could be monitored.
For this thesis, a visible-infra-red sensitive photomultiplier tube (upper cut off 12,000?0 was used.