ISSN 0252-8266
eurostat
EUROSTATISTIK
Daten zur Konjunkturanalyse
EUROSTATISTICS
Data for short-term economic analysis
EUROSTATISTIQUES
Données pour l'analyse de la conjoncture
eurostat
STATISTISCHES AMT DER EUROPÄISCHEN GEMEINSCHAFTEN
STATISTICAL OFFICE OF THE EUROPEAN COMMUNITIES
OFFICE STATISTIQUE DES COMMUNAUTÉS EUROPÉENNES
L-2920 Luxembourg — Tél. 43011, Télex : Comeur Lu 3423
EUROSTATISTIK
Daten zur Konjunkturanalyse
EUROSTATISTICS
Data for short-term economic analysis
EUROSTATISTIQUES
Données pour l'analyse de la conjoncture
Luxembourg : Office des publications officielles des Communautés européennes, 1 983
Kat./cat: CA-BJ-83-005-3A-C
Inhaltswiedergabe nur mit Quellennachweis gestattet
Hinweis
Die Veröffentlichung Eurostatistik — Daten zur Konjunkturanalyse ist
eine von drei Schlüsselveröffentlichungen des Eurostat, die dem Leser
einen Überblick über die wichtigsten quantitativen Daten geben sollen,
die für die Gemeinschaft und die Mitgliedstaaten zur Verfügung stehen.
Die anderen Veröffentlichungen in dieser Reihe sind Statistische
Grundzahlen mit Daten für ein bestimmtes Jahr sowie Eurostat-Revue
mit einem Zehnjahresüberblick über die Gemeinschaft in Zahlen.
Eine monatliche Veröffentlichung mit laufenden Wirtschaftsdaten muß
ständig angepaßt und auf den neuesten Stand gebracht werden. Zu
Beginn des Jahres 1982 wurde mit der Einbeziehung von Daten für
Griechenland und der Abwandlung der Aufmachung eine bedeutende
Änderung vorgenommen. Im Laufe des Jahres 1982 werden nach und
nach Gesamtzahlen für die 10 Mitgliedstaaten der Gemeinschaft
aufgenommen. Sobald genügend Daten zur Verfügung stehen, wird das
Basisjahr 1975, das die Grundlage für diese Veröffentlichung bildet,
durch das Jahr 1980 ersetzt werden. Zu einem späteren Zeitpunkt ist
vorgesehen, Daten für die beiden beitrittswilligen Länder Portugal und
Spanien sowie für die Vereinigten Staaten und Japan hinzuzufügen.
Es werden vier Arten von Daten in Eurostatistik veröffentlicht. Auf den
Seiten 5 und 6 findet sich ein Artikel . Kurz notiert", der sich mit den
jüngsten Tendenzen bei den verfügbaren Daten befaßt. Die Seiten 15
bis 20 enthalten eine schematische Darstellung der wichtigsten
wirtschaftlichen Reihen für die Gemeinschaft und die Mitgliedstaaten.
Die Seite 23 ist die erste von 56 Seiten mit .Gemeinschaftstabellen".
Dieser Abschnitt enthält von Eurostat auf der Grundlage von
Gemeinschaftskriterien harmonisierte Daten. Die neuesten Daten sind
vorläufig und in einigen Fällen von Eurostat geschätzt. Schließlich
enthält die Veröffentlichung noch einen Abschnitt , Ländertabellen ", der
eine Auswahl der in jedem Land am häufigsten verwendeten
Konjunkturindikatoren enthält. Hierbei handelt es sich um nationale
Reihen auf der Grundlage nationaler Definitionen. Zu Vergleichszwecken
ist auch eine Tabelle für die Vereinigten Staaten enthalten.
In allen Fällen stehen auf Anfrage Zeitreihen über die Cronos-Datenbank
des Eurostat zur Verfügung. Es werden außerdem statistische Bulletins
über Arbeitslosigkeit, Preise, industrielle Produktion, Zahlungsbilanzen.
Außenhandel und Energie monatlich oder vierteljährlich veröffentlicht. In
Eurostatistik selbst ist ein absolutes Minimum an Erläuterungen zur
Methodik enthalten. Ausführliche Informationen über Definitionen und
Methodik sind bei Eurostat erhältlich.
Eurostatistik wird am Ende eines jeden Monats in einer gemeinsamen
Ausgabe für Deutsch, Englisch und Französisch veröffentlicht. Darüber
hinaus steht auf Anfrage eine Ergänzung mit Übersetzung der Titel und
der Erläuterungen ins Dänische. Griechische, Italienische und
Inhaltsverzeichnis
Zeichen und Abkürzungen
Seite
.Kurz notiert"
5
Schaubilder
15
GEMEINSCHAFTSTABELLEN
21
1
.
Volkswirtschaftliche
Gesamtrechnungen
—
ESVG
2 3
Veränderung des Volumens
2 3
Veränderung der Preise
2 4
2. Beschäftigung
25
Bevölkerung
25
Beschäftigung
2 6
3. Arbeitslosigkeit
28
4 . Indizes der industriellen Produktion
31
Industrie, Baugewerbe
31
Erzeugung nach Kategorien
3 2
Erzeugung nach Produktionsbereichen
3 3
Konjunkturempfindliche Bereiche
3 5
5. Meinungsumfrage in der Industrie P)
3 7
6. Produktionsstatistik
41
Industrieerzeugnisse
41
Landwirtschaftliche Erzeugnisse
4 5
7. Außenhandel
4 6
Hauptindikatoren
4 6
Handel mit Drittländern
4 9
Innergemeinschaftlicher Handel
55
Handel nach Ländern
61
8. Preise
65
Indizes der Verbraucherpreise
65
Indizes der Erzeugerpreise
6 8
Indizes der Löhne und Gehälter in der Industrie . .
69
9. Finanzstatistik
7 0
Wechselkurse
7 0
Wichtigste Finanzstatistiken
72
1
0 . Zahlungsbilanz
7 4
Wichtigste Salden
7 4
LÄNDERTABELLEN
79
Belgique/België
85
Danmark
8 6
BR Deutschland
8 7
ΕΛΛΑΔΑ
8 8
France
8 9
Ireland
9 0
Italia
91
Luxembourg
9 2
Nederland
93
United Kingdom
9 4
United States
95
—
Nichts
0
Weniger als die Hälfte der verwendeten Einheit
:
Kein Nachweis vorhanden
14
Von 1 bis 4
6 + 8
6 und 8
%
Prozent
■/·, T4/T0
Prozentualer Zuwachs eines Vierteljahres
gegenüber dem entsprechenden Vierteljahr des
Vorjahres
%,
T 1 2 / T 0
Prozentualer Zuwachs eines Monats gegenüber
dem entsprechenden Monat des Vorjahres
·/·,
SALDO
Saldo zwischen den positiven Antworten
(Zunahme, Verbesserung der Situation) und den
negativen Antworten (Abnahme,
Verschlechterung der Situation) der
Konjunkturbefragung bei den Unternehmern in
der Gemeinschaft
*
Saisonbereinigt (Ländertabellen)
1975
=
100
Basisjahr
EUR
9 =
100
Prozentuale Angaben im Verhältnis zur
Gemeinschaft der 9 ( = 1 00)
EUR 10
=
100
Prozentuale Angaben im Verhältnis zur
Gemeinschaft der 1 0 ( = 1 00)
MIO
Million
MRO
Milliarde
Τ
Metrische Tonne
TR0EE
T o n n e R o h ö l e i n h e i t e n
GWH
G i g a w a t t s t u n d e = 1 0
6k W h
M3
K u b i k m e t e r
DM
D e u t s c h e M a r k
FF
Französischer Franc
UT
Italienische Lira
HFL
H o l l ä n d i s c h e r G u l d e n
BFR
Belgischer Franc
LFR
L u x e m b u r g i s c h e r Franc
UKL
Pfund Sterling
IRL
Irisches Pfund
DKR
Dänische Krone
USD
USDollar
ECU
Europäische W ä h r u n g s e i n h e i t
SZR
Sonderziehungsrechte
EG
Europäische Gemeinschaften]
Eurostat
Statistisches Amt der Europäischen
Gemeinschaften
EUR
9
Gesamtheit der Mitgliedsländer der
Europäischen Gemeinschaften bis 1 9 8 0
EUR 10
Gesamtheit der Mitgliedsländer der
Europäischen Gemeinschaften ab 1 9 8 1
UEBL/BLEU
Belgischluxemburgische Wirtschaftsunion
ACP
Länder Afrikas, der Karibik und des Pazifiks —
Abkommen von Lome
ESVG
Europäisches System Volkswirtschaftlicher
Gesamtrechnungen
NACE
Allgemeine Systematik der Wirtschaftszweige in
den Europäischen Gemeinschaften
Eurostatistik : Kurz notiert
1. Arbeitslosigkeit
Ende April 1983 waren 11,9 Millionen Personen bei den
Arbeitsämtern der Gemeinschaft der Neun als arbeitslos
gemel-det. Damit betrug die Arbeitslosenquote gemessen an den
zivilen Erwerbspersonen 1 0 , 7 % . In absoluten Zahlen ging die
Arbeitslosigkeit gegenüber dem Vormonat um 2 % zurück, dies
ist hauptsächlich auf saisonbedingte Faktoren zurückzuführen.
Die saisonbereinigten Zahlen ergeben jedoch erneut einen
geringen Anstieg der Arbeitslosigkeit in der Gemeinschaft der
Neun verglichen mit Ende März 1 9 8 3 .
Im Vergleich zum April 1 982 ¡st die Zahl der Arbeitslosen im
Durchschnitt der Europäischen Gemeinschaft um 1 6 %
gestie-gen; in der Bundesrepublik Deutschland war ein Anstieg um
3 2 % , in den Niederlanden um 2 8 % und in Irland um 2 7 % zu
verzeichnen. Für die übrigen Mitgliedstaaten entspricht der
Anstieg der Arbeitslosigkeit etwa dem
Gemeinschaftsdurch-schnitt, mit Ausnahme von Frankreich, wo es praktisch
gelun-gen ist, die Arbeitslosigkeit auf dem Stand des letzten Jahres zu
halten.
Dieser Anstieg der Arbeitslosigkeit gegenüber April 1982
betrifft die Männer stärker ( + 1 7 , 5 % ) als die Frauen
( + 1 3 . 9 % ) . Die Arbeitslosenquoten rückten näher aneinander,
sie beträgt nunmehr 1 1 , 3 % für die Frauen und 1 0 , 4 % für die
Männer. Die Stabilisierung der Arbeitslosigkeit in Frankreich hat
dazu geführt, daß, mit Ausnahme von Luxemburg, Frankreich
bei den Männern mit 7 , 3 % die niedrigste Arbeitslosenquote in
der Gemeinschaft der Neun aufweist. Diese Quote liegt im
Vereinigten Königreich und in den Niederlanden bei fast 1 5%,
in Irland bei fast 1 6%.
Da die Schulabgänger dieses Jahres noch nicht auf den
Arbeitsmarkt drängen, ist die Zahl der jüngeren Arbeitslosen
unter 25 Jahren etwa auf dem Niveau des Vormonats
geblie-ben.
In Griechenland, dessen unterschiedliche Beschäftigungsstruktur
keinen Vergleich mit den übrigen Mitgliedstaaten erlaubt, ist die
Zahl der Arbeitslosen im Vergleich zum Vorjahresmonat um
2 6 % gestiegen.
2.
Der
Verbraucherpreisindex im
April 1 9 8 3
Der Verbraucherpreisindex für die Gemeinschaft stieg zwischen
März und April 1983 durchschnittlich um 1,0%; dieser relativ
starke Anstieg ist in einigen Ländern hauptsächlich auf
saison-bedingte Faktoren zurückzuführen. Der Anstieg des
Gemein-schaftsindex spiegelt starke Steigerungen in Griechenland
(1,7%), in Frankreich ind im Vereinigten Königreich (jeweils
1,4%) sowie in Italien (1.0%) wider, während aus anderen
Ländern ein Anstieg um 0 , 2 % bis 0 , 6 % gemeldet werden.
Die anhand des Verbraucherpreisindex ermittelte Inflationsrate
betrug fur die gesamte Gemeinschaft in den letzten 1 2
Mona-ten bis Ende April 8,7%, dies ist der niedrigste Anstieg seit
mehr als 4 Jahren (März 1 9 7 9 : 8,6%).
3. Index der Industriellen Produktion im März 1
9 8 3
Der vorläufige Gemeinschaftsindex (EUR 10) belief sich im März
1 983 auf 1 1 6,3 und lag damit um 3 , 4 % unter dem Wert von
März 1982.
Nach Saisonbereinigung lag der Index für EUR 10 bei 109.7.
d.h. um 1,2% niedriger als im Februar 1 9 8 3 ; diese
Entwick-lung scheint zu bestätigen, daß der Aufschwung gegenwärtig
immer noch nicht feststellbar ist, auch wenn sich der Rückgang
der industriellen Produktion, die Ende 1982 den tiefsten Stand
erreicht haben dürfte, nicht mehr fortsetzt.
In der Bundesrepublik Deutschland, in Frankreich und im
Ver-einigten Königreich ist im März ein Rückgang gegenüber den
beiden Vormonaten festzustellen, in Italien war der niedrigste
Stand seit mehr als vier Jahren zu beobachten.
4. Eisen und Stahl
Nash der leicht ansteigenden Tendenz während des ersten
Vierteljahres 1983 ist die Rohstahlerzeugung der EG (ohne
Griechenland) im April gegenüber März 1983 saisonbereinigt
um 1 , 1 % auf 9,0 Mio t zurückgegangen. Sie lag damit um
1 4 . 4 % unter der im April des Vorjahres erzeugten Menge. Der
Auftragseingang für Massenstahl hat von Januar auf Februar
saisonbereinigt um 8 , 6 % zugenommen, blieb aber mit knapp
6,6 Mio t um 6 , 0 % unter dem vergleichbaren Vorjahresniveau.
5. Energiewirtschaft
—
Kraftwirtschaftlicher Betrieb der
Kernkraftwerke im Jahre 1 9 8 2
Im Vergleich zu den Vorjahren, in denen die Zahl der
Kernkraft-werke ausserordentlich stark zunahm, kann das Jahr 1982 als
ein Jahr der Konsolidierung betrachtet werden. 1 9 8 2 wurden
nur drei neue Kraftwerke (zwei in Frankreich, eines in Belgien)
mit insgesamt 2 6 8 0 MW netto in Betrieb genommen.
Berück-sichtigt man daneben die Berichtigungen, erreichte die gesamte
Nettoengpaßleistung der Gemeinschaft zum Jahresende
4 4 0 0 0 MW, das entspricht einer Zunahme um 6 , 3 %
gegenüber Ende 1 9 8 1 .
In der Gemeinschaft wurden aus Kernkraft 227 0 0 0 GWh netto
an Elektrizität gewonnen. Die Steigerung um 1 2 , 1 % gegenüber
1981 deutet auf eine allgemeine Verbesserung im Betrieb der
Kernkraftwerke hin. Die entsprenchenden Werte für den
Arbeits-verfügbarkeits- und den Ausnutzungsfaktor lauten 6 4 , 0 % und
6 1 , 4 % (1 981 : 6 3 , 2 % bzw. 60,7%).
Schließlich bleibt noch anzumerken, daß sich die Schere
zwi-schen Verfügbarkeit und Ausnutzung gegenüber 1981 geöffnet
hat. Daraus geht hervor, dass die Kernkraftwerke nicht mehr
ausschließlich als Grundlastwerke genutzt werden.
6. EG-Außenhandel
lassen darauf schließen, daß sich der Abbau des
Handelsdefizi-tes der Gemeinschaft in allen Ländern fortsetzt.
1 982 belief sich die gesamte Ausfuhr der Gemeinschaft auf
602 Milliarden ECU, die Einfuhr auf
631
Milliarden ECU. 4 8 %
der EG-Gesamtausfuhr ging in Drittländer; 2 5 % der
Gesamtaus-fuhr ging in andere Industrieländer und 2 0 % in
Entwicklungs-länder. Etwa die Hälfte der Ausfuhr in Entwicklungsländer war
für OPEC-Staaten bestimmt. Von den Drittländern waren die
USA nach wie vor der grösste Abnehmer für Waren aus der
Gemeinschaft (mit 1 5 % der Extra-EG-Ausfuhr). Weitere
wich-tige Kunden sind die Schweiz (8%), Schweden (5%),
Saudi-Arabien (4%), Oesterreich (4%) und Spanien (4%).
Die EG-Einfuhr aus Drittländern machte
1 9 8 2
5 1 % der
Gesamteinfuhren aus, davon kamen 2 6 % aus Industrieländern
und 2 0 % aus Entwicklungsländern. 1 1 % der gesamten
EG-Ein-fuhr kam
aus
OPEC-Ländern. Zu den an der EG-Einfuhr am
stärksten beteiligten Ausfuhrländern zählen die USA ( 1 7 % der
Extra-EG-Einfuhr) Saudi-Arabien (8%). Japan (15%). die
Schweiz (5%), die UdSSR (5%), Schweden (4%) und
Norwe-gen (4%).
7. Innergemeinschaftlicher Handel
Notice
Eurostatistics — data for short-term economic analysis is one of three
key Eurostat publications designed to give the reader an overview of the
most important quantitative information available for the Community and
Member States. The other publications in this series are Basic Statistics
giving data for a specific year, and Eurostat review with its summary of
the Community in figures over the past 7 0 years.
A monthly publication with current economic data must be continually
adapted and updated. At the beginning of 1982 a major modification
took place with the inclusion of data for Greece and a change in
presentation. Totals for the 7 O-member Community are being
progressively introduced in 1982. Once sufficient data are available,
the base year 1975 which is fundamental to this publication will be
replaced with 1980. At a later stage it is planned to add data for the
two applicant countries, Portugal and Spain, as well as for the United
States and Japan.
Four kinds of information are published in Eurostatistics. Pages 9 and
7 0 offer an article 'In brief' which looks at the latest trends in the data
available. Pages 15 to 20 provide the reader with a visual presentation
of the most important economic series for the Community and the
Member States. Starting on page 23 there are 56 pages of 'Community
tables'. This section contains data harmonized by Eurostat on the basis
of common criteria. The most recent data are provisional and in some
cases estimated by Eurostat. Finally there is a section 'Tables by
country' which contains a selection of economic indicators most often
used in each country. These are national series based on national
definitions. For comparison a table for the United States is also
included.
For all series, historical data are available on request from Eurostats
data bank Cronos. Statistical bulletins on unemployment, prices,
industrial production, balance of payments, external trade and energy
are also published monthly or quarterly. Eurostatistics itself contains an
absolute minimum of methodological notes. Detailed information on
definitions and methodology may be obtained from Eurostat.
Contents
Symbols and abbreviations
'In brief'
Graphics
COMMUNITY TABLES
1
.
National accounts ESA
Volume
Price
2. Employment
Population
Employment
3. Unemployment
4 . Index of industrial production
Industry, construction
Production by category
Production by branch
Branches in difficulty
5. Opinions in industry
16. Output
Industrial products
Agricultural products
7. External trade
Main indicators
ExtraCommunity trade
IntraCommunity trade
Trade by country
8. Prices
Consumer prices
Producer prices
Wages and salaries in industry .
9.
Financial statistics
Exchange rates
Main financial statistics
1 0 . Balance of payments
Main balances
TABLES BY COUNTRY
Belgique/België
Danmark
BR Deutschland
ΕΛΛΑΔΑ
France
Ireland
Italia
Luxembourg
Nederland
United Kingdom
United States
Page
9
15
21
23
23
2 4
25
25
26
2 8
31
31
3 2
3 3
35
37
41
41
45
4 6
4 6
4 9
55
61
65
65
6 8
69
7 0
7 0
72
74
7 4
79
85
8 6
87
8 8
89
9 0
91
92
93
9 4
95
—
0
14
6
+
8
%
%.
T4/T0
•/•.Τ12Λ0
'/.. BALANCE
*
1975 = 100 EUR 9 = 100
EUR 10 = 100
MIO
MRD
Τ
TOE
GWH M3DM
FF
UT
HFL
BFR LFR UKLIRL
DKR
USD
ECU SDR EC Eurostat EUR 9EUR 10
UEBL/BLEU
ACP
ESA
NACE
srrc
Nil
Data less than half the unit used
No data available
from 1 to 4
6 and 8
Per cent
Percentage increase on the corresponding
quarter of the previous year
Percentage increase on the corresponding
month of the previous year
Balance between positive replies (increase,
improvement in the situation) and negative
replies (reduction, worsening of the situation) in
the shorttermtrends enquiry conducted among
heads of enterprises in the Community
Seasonally adjusted (Tables by country)
Reference year
Data for countries expressed as a percentage of
the Community of 9 total
Data for countries expressed as a percentage of
the Community of 1 0 total
Million
Thousand million
Tonne
Tonne of oil equivalent
Gigawatt hour ( = 1 0
6kWh)
Cubic metre
Deutschmark
French franc
Italian lira
Dutch guilder
Belgian franc
Luxembourg franc
Pound sterling
Irish pound
Danish crown
US dollar
European currency unit
Special Drawing Right
European Communities
Statistical Office of the European Communities
Total of the member countries of the EC until
1980
Total of the member countries of the EC from
1981
BelgoLuxembourg Economic Union
African, Caribbean and Pacific countries of the
Lomé Convention
European System of Integrated Economic
Accounts
Eurostatistics : In Brief
1. Unemployment
At the end of April 1983 there were 11.9 million persons
registered as unemployed at public employment offices in the
Community of Nine, corresponding to an unemployment rate of
1 0 . 7 % of the civilian working population. The absolute figures
of unemployment showed a fall of 2 % compared with the
previous month, mainly due to normal seasonal factors. The
seasonally adjusted figure, however, indicates a further very
slight rise in unemployment in the Community of Nine
com-pared with end-March 1 9 8 3 .
Compared with the month of April 1 9 8 2 . the number
unem-ployed in the Community has risen bu 1 6 % on average. This
increase amounted to + 3 2 % in Germany. + 2 8 % in the
Netherlands and + 2 7 % in Ireland. The increase was close to
the Community average in the other Member countries with the
exception of France where unemployment remained practically
stable over the past year.
The rise in unemployment since April 1 982 has been greater
for men ( + 1 7 . 5 % ) than for women ( + 1 3 . 9 % ) . In
con-sequence the unemployment rates for the two sexes moved
closer together. 1 1.3% for women as against 1 0 . 4 % for men.
The stabilisation of unemployment in France has resulted in an
unemployment rate for males in that country (7.3%) which,
with the exception of Luxembourg, is the lowest in the
Commu-nity of Nine. This rate reached almost 1 5 % in the United
Kingdom and the Netherlands and almost 1 6 % in Ireland.
The next generation of school-leavers having not yet arrived on
the labour market, the number of unemployed persons aged
under 25 years remained at much the same level as at
end-March.
In the case of Greece, where the differing employment structure
prevents direct comparison with the other Member States, the
number unemployed at the end of April 1 983 was 2 6 % above
the figure of April 1 9 8 2 .
2. The consumer price index in April 1 9 8 3
The consumer price index for the Community rose by 1.0% on
average between March and April 1 9 8 3 ; this relatively high
monthly increase is mainly due to seasonal factors in a number
of countries. The rise in the Community index reflects significant
rises in Greece (1.7%). in France and the United Kingdom
(both 1.4%) as well as in Italy (1.0%) whereas the other
countries reported increases between 0 . 2 % to 0 . 6 % .
The rate of inflation as measured by the consumer price index
for the Community as a whole over the last 1 2 months to end
April is 8.7%, which is the lowest increase for more than
4 years (March 1 9 7 9 , 8.6%).
3. The index of industrial production in March 1 9 8 3
The provisional index for the Community in March 1 983 stood
at 1 16.3 which corresponds to a fall of 3 . 4 % compared with
March 1983.
After adjustment of seasonal influences, the EUR 10 index is at
109.7 which represents a drop of 1.2% compared with
Febru-ary 1983. This seems to confirm that the decline in industrial
production has stopped, having reached a minimum at the end
of 1 9 8 2 . Nonetheless, it is still not possible to show that
production is taking off again.
In Germany, France and the United Kingdom the March level is
lower than that of January and February. In Italy the level is the
lowest recorded for four years.
4. Iron and steel
Following the slight tendency to rise in the first quarter of 1 983
production of crude steel for the EC (ex Greece) showed in April
1983, at 9 mio.t. a fall of 1 . 1 % (deseasonalized) compared
with the previous month and 1 4 . 4 % compared with the same
month of 1 9 8 2 . In February 1 983 new orders (ordinary steels),
at 6.6 mio.t.. showed an increase of 8 . 6 % (deseasonalized)
compared with the preceding month — their level nevertheless
remains 6 % below that of February 1 9 8 2 .
5. Energy — Energy production of nuclear power stations
during 1 9 8 2
Compared with previous years, which were characterized by a
massive growth in nuclear power capacity, 1982 may be
regarded as a year of consolidation. Only three power stations
entered service in 1982 (two in France and one in Belgium)
with a total capacity of 2 6 8 0 MW net. Taking account of
corrections, the total net generation capacity installed in the
Community reached 4 4 0 0 0 MW by the end of the year, an
increase of 6 . 3 % since the end of 1 9 8 1 .
The electrical energy of nuclear origin produced in the
Commu-nity was 227 0 0 0 GWh net, an increase of 1 2 . 1 % over 1 9 8 1 ,
which signifies a general improvement in the performance of
nuclear power stations. Indeed, the energy availability and load
factors were 6 4 . 0 % and 6 1 . 4 % respectively (as against
63.20/0 and 6 0 . 7 % in 1981).
Finally, it should be noted that the gap between availability and
load was wider than in 1 9 8 1 , indicating that nuclear power
stations are no longer being used exclusively as base load
power stations.
6. Extra-EC trade
Extra-EC exports rose 8 % by value in January, compared with
January 1 9 8 2 . This figure is based on data from eight of the
ten EC-members (French and Greek data are not yet available).
Imports rose by 6%. As a result, the partial figures suggest that
the trend towards the reduction of the Community's overall
trade deficit is continuing.
developing countries. Just under half of exports to developing
countries was accounted for by OPEC countries. Of individual
third countries, the USA remains the largest market for
Commu-nity goods, taking 1 5 % of extra-EC exports. Other important
customers are Switzerland (8%), Sweden (5%), Saudi Arabia
(4%). Austria (4%) and Spain (4%).
Extra-EC imports made up 5 1 % of total imports in 1 9 8 2 , of
which 2 6 % of the total came from industrialised countries and
2 0 % from developing countries. OPEC countries supplied 1 1 %
of total EC imports. The leading exporters to the EC were the
USA ( 1 7 % of extra-EC imports). Saudi Arabia (8%). Japan
USSR (5%), Sweden (4%) and
(15%), Switzerland (5%),
Norway (4%).
7. Intra-EC trade
Avertissement
Eurostatistiques — données pour l'analyse de la conjoncture
est l'une
des trois publications clés d'Eurostat, destinées à donner au lecteur un
aperçu des informations quantitatives les plus importantes
disponibles
concernant la Communauté et les États membres. Les autres
publications de cette série sont les
Statistiques de base
fournissant des
données pour une année spécifique déterminée et la
Revue de
Γ Eurostat
qui passe en revue dix ans de la Communauté sous forme de
tableaux chiffrés.
Une publication mensuelle contenant des données économiques
conjoncturelles d'actualité doit être continuellement adaptée et mise à
jour. Au début de 1982, une modification importante est intervenue
avec l'inclusion de données concernant la Grèce et un changement de
présentation. Des totaux pour la Communauté de dix membres seront
progressivement introduits en 1982. Lorsque l'on disposera de
données en nombre suffisant, l'année 1975 — année de référence
pour cette publication — sera remplacée par 1980. Il est prévu
ultérieurement d'ajouter les données concernant les deux pays
candidats à l'adhésion — à savoir l'Espagne et le Portugal — ainsi que
pour les ÉtatsUnis et le Japon.
Eurostatistiques
publie quatre types d'informations. Les pages 13 et 14
contiennent un article « En bref» dans lequel les dernières tendances
pouvant être dégagées à partir des données disponibles sont
examinées. Les pages 15 à 20 fournissent au lecteur une présentation
visuelle des séries économiques les plus importantes pour la
Communauté et les États membres. Des « tableaux communautaires »
sont présentés sur 56 pages à partir de la page 23. Cette section
contient des données harmonisées par Eurostat sur la base de critères
communs. Les données les plus récentes sont provisoires et, dans
certains cas, estimées par Eurostat. Enfin, la section « tableaux par
pays » contient une sélection des indicateurs économiques les plus
souvent utilisés dans chaque pays. Ce sont des séries nationales
fondées sur des définitions nationales. A des fins de comparaison, un
tableau concernant les ÉtatsUnis est également inclus.
Pour toutes les séries, des données historiques sont disponibles sur
demande auprès de la banque de données d'Eurostat. CRONOS. Les
bulletins statistiques sur le chômage, les prix, la production
industrielle,
la balance des paiements, le commerce extérieur et l'énergie sont
également publiés sur une base mensuelle ou trimestrielle. En soi,
Eurostatistiques
contient un minimum de notes méthodologiques.
Une
information détaillée concernant les définitions et la méthodologie
peutêtre obtenue auprès d'Eurostat.
Table des matières
Signes et abréviations
« En bref »
Graphiques
TABLEAUX COMMUNAUTAIRES
1
.
Comptes nationaux SEC
Évolution en volume
Évolution des prix
2 . Emploi
Population
Emploi
3 . Chômage
4 . Indices de la production industrielle
Industrie, construction
Production par catégorie
Production par branche
Production des branches sensibles. . .
5. Opinions dans l'industrie (
1)
6. Production
Produits industriels
Produits agricoles
7. Commerce extérieur
Principaux indicateurs
Commerce extracommunautaire
Commerce intracommunautaire
Commerce par pays
8. Prix
Prix à la consommation
Prix à la production
Salaires dans l'industrie
9 . Statistiques financières
Taux de change
Principales statistiques financières . . .
1 0 . Balance des paiements
Principaux soldes
TABLEAUX PAR PAYS
Belgique/België
Danmark
BR Deutschland
ΕΛΛΑΔΑ
France
Ireland
Italia
Luxembourg
Nederland
United Kingdom
United States
Page
13
15
21
23
23
2 4
25
25
2 6
2 8
31
31
3 2
3 3
3 5
3 7
41
41
4 5
4 6
4 6
4 9
55
61
65
65
6 8
6 9
7 0
7 0
72
7 4
7 4
79
8 5
8 6
8 7
8 8
8 9
9 0
91
9 2
93
9 4
95
—
0
14
6
+
8
%
■/.. T4/T0
'/..T12/T0
·/..
SOLDE
*
1975 = 100
EUR 9 = 100
EUR 10 = 100
MIO
MRD
Τ
TEP
GWH
M3
DM
FF
UT
HFLBFR
LFR
UKL
IRL
DKR USDECU
DTS
CE
EurostatEUR 9
EUR 10
UEBL/BLEU
ACP
SEC
NACE
CTCI
Néant
Donnée inférieure à la moitié de l'unité utilisée
Donnée non disponible
De 1 à 4
6 et 8
Pourcentage
Accroissement en pourcentage d'un trimestre
sur le trimestre correspondant de l'année
précédente
Accroissement en pourcentage d'un mois sur le
mois correspondant de l'année précédente
Solde entre les réponses positives
(accroissement, amélioration de la situation) et
les réponses négatives (diminution,
détérioration de la situation) à l'enquête de
conjoncture auprès des chefs d'entreprise de la
Communauté
Désaisonnalisé (tableaux par pays)
Année de base
Données des pays exprimées en pourcentage
total de la Communauté à neuf ( = 1 00)
Données des pays exprimées en pourcentage
du total de la Communauté à dix
Million
Milliard
Tonne métrique
Tonne équivalent pétrole
Gigawattheure = 1 O
6kWh
Mètre cube
Deutsche Mark
Franc français
Lire italienne
Florin néerlandais
Franc belge
Franc luxembourgeois
Livre sterling
Livre irlandaise
Couronne danoise
Dollar US
Unité monétaire européenne
Droits de tirages spéciaux
Communautés européennes
Office statistique des Communautés
européennes
Ensemble des pays membres des
Communautés européennes jusqu'à 1 9 8 0
Ensemble des pays membres des
Communautés européennes à partir de 1981
Union économique belgoluxembourgeoise
Pays d'Afrique, des Caraïbes et du Pacifique —
Convention de Lomé
Système européen de comptes économiques
intégrés
Nomenclature générale des activités
économiques dans les Communautés
européennes
[image:14.595.32.557.201.735.2]Eurostatistiques : En Bref
1. Chômage
A la fin du mois d'avril 1983, le nombre des personnes
inscrites auprès des bureaux de placement s'élevait à 1 1,9
mil-lions dans la Communauté Européenne des Neuf. Ce chiffre
correspond à un taux de chômage par rapport à la population
active civile de 1 0 , 7 % . Cette diminution des chiffres bruts du
chômage de 2 % est due essentiellement à l'effet saisonnier
habituel. Les données corrigées des variations saisonnières
montrent une très légère augmentation du chômage pour la
Communauté des Neuf par rapport à la fin mars 1 9 8 3 .
Par rapport au mois d'avril de l'année dernière, le nombre des
chômeurs a crû de + 1 6 % en moyenne dans la Communauté
Européenne. Cette augmentation du chômage a atteint + 3 2 %
en Allemagne. + 2 8 % aux Pays-Bas et + 2 7 % en Irlande. Elle
est plus proche de la moyenne communautaire pour les autres
États membres. Seule la France a réussi à pratiquement
stabili-ser le chômage depuis l'année dernière.
Cette augmentation dö chômage par rapport à avril 1 9 8 2 a été
plus forte chez les hommes ( + 1 7 , 5 % ) que les femmes
( + 1 3 , 9 % ) . Il en résulte un resserrement des taux de chômage
des deux sexes. 1 1,3% pour les femmes contre 1 0 , 4 % pour
les hommes. La stabilisation du chômage en France a entraîné
que, hormis le Luxembourg, c'est la France qui, avec 7,3%, a
le taux de chômage masculin le plus faible de la Communauté
des Neuf. Ce taux atteignait près de 1 5 % au Royaume-Uni et
aux Pays-Bas. près de 1 6 % en Irlande.
La prochaine génération des jeunes sortant de l'école n'étant
pas encore arrivée sur le marché du travail, le nombre des
jeunes chômeurs de moins de 25 ans est resté à peu près au
même niveau qu'au mois de mars.
Enfin, en Grèce, dont la situation socio-économique particulière
ne permet pas de faire de comparaison avec les autres états
membres, le nombre des chômeurs à la fin avril 1983 était
supérieur de 2 6 % au chiffre d'avril 1 9 8 2 .
2. L'indice des prix à la consommation en avril 1 9 8 3
L'indice des prix à la consommation pour la Communauté s'est
accru de 1 % en moyenne de mars à avril 1983. Cette hausse
mensuelle relativement importante est principalement due à des
facteurs saisonniers dans un certain nombre de pays.
L'accrois-sement de l'indice communautaire reflète des hausses
significa-tives en Grèce (1,7%). en France et au Royaume-Uni ( 1 , 4 %
chacun) ainsi qu'en Italie (1.0%) tandis que les autres pays
observent des hausses se situant entre 0 , 2 % et 0,6%.
Le taux d'inflation mesuré par l'indice des prix à la
consomma-tion pour la Communauté dans son ensemble s'élève à 8 , 7 %
pour les douze derniers mois jusqu'à la fin avril, ce qui constitue
le plus faible taux depuis plus de 4 ans (mars 1 979 : 8,6%).
3. L'indice de la production industrielle en mars 1 9 8 3
L'indice provisoire pour la Communauté (EUR 10) du mois de
mars 1983 s'établit à 116,3 ce qui correspond à une baisse
de 3 , 4 % par rapport à mars 1982.
Après correction des variations saisonnières, l'indice EUR 10
est au niveau 1 09,7 c'est-à-dire en baisse de 1,2% par rapport
au niveau de février 1 9 8 3 , ce qui semble confirmer que s'il y a
une pause dans la baisse de la production industrielle qui aurait
atteint un minimum à la fin de l'année 1 9 8 2 , il n'est pas
actuellement possible de parler de reprise constatée.
Pour la République fédérale d'Allemagne, la France et le
Royau-me-Uni le niveau de mars est en baisse par rapport aux deux
mois précédents de pour l'Italie il correspond au niveau le plus
bas qui ait été observé depuis plus de quatre ans.
4. Sidérurgie
Après la légère tendance à la hausse du premier trimestre
1 9 8 3 , la production d'acier brut de la CE (sans la Grèce) a
enregistré en avril 1983, avec 9 mio. t, une baisse de 1 . 1 %
(désaisonnalisée) par rapport au mois précédent et de 1 4 , 4 %
par rapport au même mois de 1 9 8 2 .
En février 1 9 8 3 . les commandes nouvelles (aciers courants)
avec 6.6 mio. t ont connu une hausse de 8 , 6 %
(désaisonnali-sée) par rapport au mois précédent. Leur niveau reste
cepen-dant inférieur de 6 % à celui de février 1 982
5. Énergie : Exploitation énergétique des centrales
nucléai-res au cours de 1 9 8 2
Par rapport aux années précédentes, caractérisées par une
croissance massive du parc des centrales nucléaires, 1 982
peut être considéré comme une année de consolidation. Trois
centrales seulement sont entrées en service en 1982 (deux en
France et une en Belgique) pour une capacité globale de
2 6 8 0 MW nets. Compte tenu des rectifications, la puissance
totale nette installée dans la Communauté a atteint à la fin de
l'année 4 4 0 0 0 MW, soit une augmentation de 6 , 3 % par
rapport à la fin de 1 9 8 1 .
L'énergie électrique d'origine nucléaire produite dans la
Com-munauté a atteint 227 0 0 0 GWh net. soit une augmentation de
1 2 . 1 % par rapport à 1981 ce qui indique une amélioration
générale des performances des centrales nucléaires. En effet,
les taux moyens de disponibilité et d'utilisation en énergie ont
été respectivement de 6 4 , 0 % et de 6 1 , 4 % (contre 6 3 , 2 % et
6 0 , 7 % en 1981)
On peut observer enfin que l'écart entre la disponibilité et
l'utilisation a augmenté par rapport à 1981 ce qui indique que
désormais les centrales nucléaires ne sont pas exclusivement
employées comme centrales de base.
6. Commerce extra-Communautaire
réduction du déficit commercial global de la Communauté se
confirme. En 1982 les exportations totales de la Communauté
ont atteint 602 milliards d'ECU et le chiffre correspondant pour
les importations était de 631 milliards d'ECU. Le commerce
extra CE comptait pour 4 8 % du total des exportations
commu-nautaires; 2 5 % du total allait aux autres pays industrialisés et
2 0 % aux pays en voie de développement. Environ la moitié des
exportations vers les pays en voie de développement sont
destinées aux pays de l'OPEP. Parmi les pays tiers les USA
restent le plus grand marché pour la Communauté, avec une
part de 1 5 % des exportations extra CE. Les autres clients
importants sont la Suisse (8%), la Suède (5%). l'Arabie
Saou-dite (4%), l'Autriche (4%) et l'Espagne (4%).
Les importations extra CE constituaient 5 1 % du total des
importations en 1 9 8 2 , dont 2 6 % du total provenait des pays
industrialisés et 2 0 % des pays en voie de développement. Les
pays de l'OPEP fournissaient 1 1 % du total des importations
communautaires. Les principaux exportateurs vers la
Commu-nauté étaient les USA (1 7 % des importations extra CE), Arabie
Saoudite (8%), Japon (15%). Suisse (5%). URSS (5%). Suède
(4%) et Norvège (4%).
7. Commerce I n t r a c o m m u n a u t a i r e
Les importations intra CE ont augmenté de 1 0 % en janvier
comparé au premier mois de 1982 (chiffre basé sur les
données de 8 des 1 0 pays membres). Ceci est un taux annuel
plus élevé que pour les trois mois précédents.
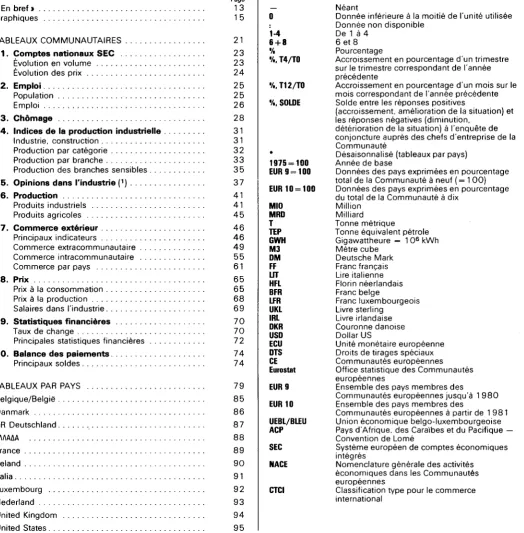
REGISTR. ARBEITSLOSIGKEIT
12
INSGESAITT
INSGESAITT/SAISONBEREINIGT rlAENNER / SA ISONBEREΙΝI GT FRAUEN/SAISONBEREINIGT
REGISTERED UNEHPLOTHENT
EUR IO ΠΙΟTOTAL
TOTAL/SEASONALLY ADJUSTED MEN/SEASONALLY ADJUSTED UOriEN/SEASONALLY ADJUSTED
CHOHAGE ENREGISTRE
TOTAL
TOTAL/DESAISONNALISE HOWIES / DESA ISONNALI SE FEnnES/DESA ISONNALISE
12
1 9 1 9
1980
198-1
1982
1983
INDUSTRIELLE PRODUKTION
TENDENZ EUR 10INDUSTRIAL PRODUCTION
TREND EUR 1019Ί5=100
INDUSTRIE NACE 1-¿ INDUSTRY NACE 1-4 GRUNDST. υ- PRODUKTIONSGUETER INTERKEDIATE GOODS INUESTITIONSGUETER INUESTnENT GOODS UERBRAUCHSGUETER CONSUHPTION GOODS
PRODUCTION INDUSTRIELLE
TENDANCE EUR 10
INDUSTRIE NACE l-¿ BIENS INTERrlEDIAIRES BIENS D'INUESTISSEHENT BIENS DE CONSOnnATION
150
130
120
110
100
1¿0
130
120
110
100
1 9 1 9
1980
1981
1982
Ι ι ' I ' ι Ι ι ι Ι 90
50
¿0
30
20
10
0
-10
-20
-30
- ¿ 0 - 5 0 -SO -ΊΟ
riEINUNGSUnFRAGE
IN DER INDUSTRIE (NACE 2-4) » SALDO
OPINIONS
IN INDUSTRY (NACE 2 - 4 )x BALANCE EUR 10
OPINIONS
DANS L'INDUSTRIE (NACE 2 - 4 )x SOLDE
PRODUKT IONSAUSSICHTEN AUFTRAGSBESTAND LAGERBESTAENDE AN
FERTIGERZEUGNISSEN
PRODUCTION EXPECTATIONS PERSPECTIl/ES DE PRODUCTION ORDER BOOKS CARNETS DE COMANDES STOCKS OF FINISHED PRODUCTS STOCKS DE PRODUITS F I N I S
50
¿0
30
20
10
0
1 0
2 0
3 0
¿ 0
5 0
6 0
10
1919
1980
1981
1982
1983
AUSSENHANDEL
SAISONBEREINIGT
EINFUHR EXTRA-EG AUSFUHR EXTRA-EG
EXTERNAL TRADE
SEASONALLY ADJUSTED
EUR 10 riRD ECU
IMPORTS EXTRA-EC EXPORTS EXTRA-EC
30
COnnERCE EXTERIEUR
DESAISONNALISE
IMPORTS EXTRA-CE EXPORTS EXTRA-CE
30
26 _
24
22
20 _
18
I S
14
_ 26
24
22
18
16
15
14
13
12 _
1 1 _
10 _
1
l/ERBRAUCHERPREISE
VERAENDERUNG
ï
J I I I I I I 1 I I I I I I I 1 I I I 1 I Ll i l i
I ! I I
CONSUMER P R I C E S
VARIATION
x T12/T0
EUR 10
P R I X A LA CONSOMMATION
UARIATION
I ■ . I ■ ■ I ι ι Ι ι ι Ι ι ι Ι ι I
15
_ 14
_ 13
12
1 1
10
_ 9
_ 1
I ! ! I
Λ
1 9 1 9
1980
1981
1982
1983
1 . 5 0 0
1 . 4 0 0
1 . 3 0 0
1.200
1.100
1 . 0 0 0 _
. 9 0 0
WECHSELKURSE
1 ECU 1 ECU
SZR USD
EXCHANGE RATES
1 ECU = ... SDR 1 ECU = ... USD
TAUX DE CHANGE
1 ECU = ... DTS 1 ECU = ... USD
1.400
1.300
1.200
1.100
1.000
.900
.800 Ι ι ι Ι ι ι Ι ι ι Ι ι ι Ι ι ι Ι ι ι Ι ι ι Ι ι ι I t ι Ι ι ι Ι ι ι Ι ι ι Ι ι ι Ι ι ι Ι ι ι Ι ι ι Ι ι ι Ι ι ι Ι ι ι Ι ι ι I „800
3500
3000
2500
200
ns
150
REGISTRa ARBEITSLOSIGKEIT
REGISTERED UNEMPLOYMENT
CHOMAGE ENREGISTRE
SAISONBEREINIGT SEASONALLY ADJUSTED
1 000
DESAISONNALISE
UK
NL
IRL
• DKGR
'****+♦**„« *
^
S'
„s
...'
«v.*"*
2000
Π50
1500
200
Π 5
150
140
130 _
120
110 _
100
INDUSTRIELLE PRODUKTION
TENDENZ NACE 1-4
D
INDUSTRIAL PRODUCTION
TREND NACE 1-4 1915=100
■V+++++++
PRODUCTION INDUSTRIELLE
TENDANCE NACE 1-4
„ « „ „
UK
EUR 10
90 L i I I I 1 I I I Ι Ι 1 Ι ι ι Ι ι ι Ι ι ι L
* * * + + + + *
V*. /*'
'*„»*<■ .„♦♦**♦<"»».* * * ♦ .
Ι Ι Ι ι ι Ι ι ι Ι ι ι
„ « * * * * * * ♦ ·*******„ '
.»·"·»„«
1 ι ι ' ι Ι ι ι Ι ι ι Ι ι ι
150
140
130
120
110
100
Ι ι ι Ι ι ι Ι ι ι Ι 90
1 9 1 9
1980
1981
1982
1983
150
140
130
120
110
100
90
INDUSTRIELLE PRODUKTION
T E N D E N Z NACE 1 4
NL
+++ +++ +++ +++Β
INDUSTRIAL PRODUCTION
TREND NACE 1-4 1915=100
tM +++ +++ +++ I * + + + ♦ ♦ + + + + J R I
EUR 10
PRODUCTION INDUSTRIELLE
TENDANCE NACE 1-4
+ + + + +
DK
2_y %+++ +++ +** *
ι ι Ι ι ι Ι ι ι Ι ι
1 9 1 9
I ■ ■ I ■ ■ I
1980
■ • » Μ * * * ' « » I . .
„S
l _ l I I I
N i l
1981
**+♦♦+++♦♦♦+♦**+*+++,
■"♦„.«' '
I I I I I ! I I \
GR
I I I I I I 150
140
1 3 0
120
110
100
90
UERBRAUCHERPREISE
GESAMT INDEX
CONSUMER PRICES
GENERAL INDEX 1915=100
PRIX A LA CONSOMMATION
INDICE GENERAL
***************
EUR 1 0
+ + + + + + + + + +
UK
350
300
215
250
225
100 I I I I I I I I I I I I I I I I I I I I I I
,»***
ι ι Ι τ ι
****
***"
.**'
^ "
I I ! I I I I
******
^**"
++ + 4 + + + + + + + + ' ++ + ++ ++
I I I I ! I I
_ 3 5 0
300
215
250
225
. 200
180
160
140
120
I I ! I ! I I
1919
1980
EINFACH-LOCARΙΤΗΠISCHE SKALA
1981
SEni-LOCARITHniC SCALE
1982
1983
ECHELLE SEHI- LOGARΙΤΗΠΙDUE
350
300
215
250
225 .
200
180
ISO
140
VERBRAUCHERPREISE
GESAMT INDEX
|\|L ~ ~ ~ . ~
120
^ttf.«****'*******"*
_ :,.»*M**<CONSUMER PRICES
GENERAL INDEX 1915=100
PRIX A LA CONSOMMATION
INDICE GENERAL
■""« IRL
EUR I O
DK
GR
ν
*
Μ*>»*~-*~>#
1***''
350
300
215
250
225
200
180
160
140
GEMEINSCHAFTSTABELLEN
COMMUNITY TABLES
VOLKSW.GESAMTRECHN. ESVG
NATIONAL ACCOUNTS ESA
COMPTES NATIONAUX SEC
EUR10 BELGIQUE
BELGIË D A N M A R K
BR
DEUTSCHLAND Ε Λ Λ Α Δ Α F R A N C E I R E L A N D I T A L I A
DUI BRUTTOINLANDSPRODUKT GROSS DOMESTIC PRODUCT
VERAENDERUNG DES VOLUMENS CHANGE IN VOLUME
1 9 7 5 I 1 0 0 . 0
1 9 7 9 1 9 8 0 1 9 8 1 1 9 8 2
114,9 116.2 1 15.8 116.2
1 9 7 9 III IV 1 9 8 0 1 II III IV 1 9 8 1 1 II III IV 1 9 8 2 I II III IV
+ 3,4 + 3.6 + 5.3 + 0.9 + 1.1 1 . 7 1 , 6 0 , 6 0 . 0 + 0.6 + 0.7 + 0,9 + 0,1 0 . 2
0 0 2 PRIVATER VERBRAUCH
EUR 10 1 0 0
3.9 2,1 25.5 1,9 21,8 0.7 17.8
1 9 7 5 1 0 0
112,3 113,7 116,6 1 2 1 , 8 115.3 119.3 116.2
115.1 113.5 1 1 9 . 0 123.9 116.2 121.5 120.8
113.9 113.5 118.9 1 2 4 . 4 116.4 123.6 120.6
1 1 2 . 8 116.4 117.9 123.3 118.9 1 2 0 . 4
% , T 4 / T 0
+ 3.0 + 3 , 9 + 4 . 0 + 4 . 5 + 3 . 7
+ 2,9 + 4 , 3 + 0 . 2 + 3 . 4 + 5 . 5
+ 5.7 + 5 . 7 + 1 . 6 + 3 . 6 + 1 0 . 8
+ 1.5 + 0 . 8 0 . 1 + 2 . 0 + 5 . 2
+ 0.8 + 1 . 4 + 2 . 0 + 0 . 1 + 5 , 5
1 . 9 0 . 3 + 3 . 8 0 . 6 4 . 5
3 . 6 1 , 4 1 . 7 1 . 7 0 . 6
1 . 6 + 0 , 1 + 0 , 0 + 0 . 1 0 . 8
1 . 7 + 0 , 7 + 1 , 8 + 0 , 5 + 1 . 5
2 , 6 + 0 . 7 1 . 2 + 1 . 7 + 0 . 5
0 , 1 0 . 0 + 2 . 3 + 2 . 1 + 1 , 2
0 . 3 + 0 . 0 + 1 . 9 + 0 . 8
1 . 8 + 1 , 0 1 . 0
1 . 9 + 0 . 9 2 . 4
CONSUMPTION BY HOUSEHOLDS
VERAENDERUNG DES VOLUMENS CHANGE IN VOLUME
1 9 7 5 I 1 0 0 , 0
1 9 7 9 1 9 8 0 1 9 8 1 1 9 8 2
1 1 5 . 0 116,5 116,7
1 9 7 9 III IV 1 9 8 0 1 II III IV 1 9 8 1 I II III IV 1 9 8 2 1 II III IV
+ 2.9 + 3.6 + 3.8 + 0.1 + 2.2 + 1.0
EUR 10 = 1 0 0
3.8 1,9 25,2 2.1 21,7 0.8 18,8
1 9 7 5 = 1 0 0
115.3 111.5 114.4 122.2 117.7 119.7 114.8
117.3 107.4 116.4 121.8 119.1 118.5 119.7
1 1 5 . 2 105.6 115.2 122.2 121.8 118.3 119.5
% , T 4 / T 0
+ 3,9 + 1 . 5 + 3 , 2 + 4 . 6
+ 5,3 + 2 . 7 + 2 , 8 + 5 , 2
+ 2,5 + 3 , 7 + 2 , 4 + 5 . 4
+ 4.5 1 . 0 + 1 . 3 + 5 . 6
+ 3,0 + 2 , 4 + 1 , 8 + 4 , 7
+ 0,5 + 1 , 2 + 1 , 4 + 2 , 0
1 , 1 1 . 6 + 0 . 8
0 . 4 0 . 5 + 2 . 7
1 . 2 + 3 . 0
2 . 1 1 . 6 + 2 , 7
0 . 4 1 . 4 + 4 . 2
1 . 6 2 . 0 + 3 . 7
3 . 0 + 2 . 8
2 . 5 + 3 . 0
0 0 3 BRUTTOANLAGENINVESTITIONEN GROSS FIXED CAPITAL FORMATION
VERAENDERUNG DES VOLUMENS CHANGE IN VOLUME
1 9 7 5 I 1 0 0 . 0
1 9 7 9 1 9 8 0 1 9 8 1 1 9 8 2
1 1 1,4 1 13.7 110.3
1 9 7 9 III IV 1 9 8 0 I II III IV 1 9 8 1 1 II III IV 1 9 8 2 I II III IV
+ 5.4 + 6.8 + 8.7 + 2.8 + 2.5 0 . 3 4 . 8 3 . 3 2 . 3 3 , 7 2 , 5 2 , 0 1 , 9
EUR 10 = 1 0 0
4.2 2.2 25.1 1.9 2 4 . 0 0.8 17.3
1 9 7 5 1 0 0
102.7 114.1 123.7 131.6 105.3 157,8 107.8
108.5 98,5 3,2 120,7 106.0 144.4 1 1 8 . 0
1 0 5 . 0 83.5 3 . 8 116.4 104.0 153.1 117.7
6 . 2 . . . .
<¥o. T 4 / T 0
+ 8.3 + 5 . 7 + 4 . 6 + 4 . 3
+ 8.4 + 6 . 1 + 4 . 0 + 9 . 0
+ 14,1 7 , 0 + 6 , 6 + 6 . 5
+ 1.3 4 . 9 + 3 . 7 + 7 . 6
+ 2.2 1 1 , 1 + 0 . 2 + 1 4 . 0
1 , 8 1 1 . 7 0 . 1 + 1 0 , 0
6 , 6 2 3 , 0 3 . 1 + 3 , 2
1 , 1 1 0 , 1 2 , 0 2 , 3
1 , 7 + 4 . 2 1 . 6 0 , 4
6 , 2 1 1 . 4 1 . 8 1 , 2
7 , 0 + 2 0 . 8 1 . 2 3 . 4
6 . 8 + 1 , 2 0 . 7
6 , 5 + 0 . 2 2 . 9
2 . 5 1 . 5
LUXEMBOURG
0.2
1 1 1 . 6 1 12.4 108,7 109.5
.
.
.
.
.
0.2
1 12.5 1 16.1 116.9
.
NEDERLAND UNITED KINGDOM
PRODUIT INTERIEUR BRUT EVOLUTION EN VOLUME
5.4 2 0 , 6
112,7 109,9
113.3 107.6
112.1 105.1
111.1 106.6
+ 1.0 + 1.4 + 2.3 3 . 5 1 . 6 2 . 7 2 . 4 2 . 3 2 . 9 0 . 8 0 . 4 + 0.9 + 2.5 + 2.7
CONSOMMATION PRIVEE EVOLUTION EN VOLUME
4.9 2 0 . 6
116.4 110.3
115.6 109.4
112.6 109.4
+ 2,6 + 2 , 8 + 3,4 + 4 , 5 + 1,8 + 4 . 1 0 . 8 3 . 6 1 , 7 + 0 . 6 2 , 4 0 . 6 2 . 6 0 . 5
2 . 6 + 1 . 2 2 . 6 + 0 . 5 2 , 5 + 0 , 6 1 , 8 0 , 7 + 0.3 + 1.8 + 3.0
FORMATION BRUTE DE CAPITAL FIXE
0,2
105.8 105,9 105.1
.
.
.
EVOLUTION EN VOLUME
5.3 19,1
109,9 1 0 2 . 8
107.1 101.6
9 9 . 6 9 4 . 4
+ 0.9 + 2 . 5
+ 4.2 + 6 . 6 + 27,1 + 4 , 6 7 , 4 0 , 7 7 , 3 4 , 8 1 2 , 9 8 , 5
1 3 , 9 1 2 , 3 1 2 . 5 1 0 . 2
VOLKSW.GESAMTRECHN. ESVG
NATIONAL ACCOUNTS ESA
COMPTES NATIONAUX SEC
EUR10 B E L G I Q U E
B E L G I Ë D A N M A R K BR
DEUTSCHLAND Ε Λ Λ Α Δ Α F R A N C E I R E L A N D I T A L I A LUXEMBOURG N E D E R L A N D
U N I T E D K I N G D O M
0 0 4 BRUTTOINLANDSPRODUKT
VERAENDERUNG DER PREISE
GROSS DOMESTIC PRODUCT
CHANGE IN PRICE
PRODUIT INTERIEUR BRUT
EVOLUTION DES PRIX
1 9 7 9 1 9 8 0 1 9 8 1 1 9 8 2
1 9 7 9 III IV 1 9 8 0 I II
III
IV 1 9 8 1 I II
III
IV 1 9 8 2 1 II
III
IV
)5 · PRIVA
RAENDERUf
1 9 7 9 1 9 8 0 1 9 8 1 1 9 8 2
1 9 7 9 III
IV 1 9 8 0 I II
111
IV 1 9 8 1 I II
III
IV 1 9 8 2 I II
III IV
143,6 159,6 176,9
10,8 11,3 13,0 14,1 12,5 11,9 10,9 10.2 10.4 10.1 10.3
TER VERBRAUCH
G DER PREISE
141.8 157.9 176.6
10.6 11.8 13.1 13,6 12.6 12.2
124.9 130.3 136.6
4,2 5.2 3,0 3.4 3.1 0,3 2.1 0.3 3.2 9.6 2,9 8.4
124.5 132.7 142.7
4,1 4.8 5,4 5,0 6.1 6,5 7,8 7,7 8,1 9,1 9.4 9,8
140,6 152.4 166.4
;
144.6 161.1 179,1
;
115,6 1 2 1 . 0 126.1
4,8 3.8 3.7 5,3 4.8 4,2 4,0 3,8 4.1 4.6 5,1 4,3 5,1 4,8
1 9 7 5 174.7 2 0 6 , 9 2 5 4 , 9
1 0 0
% . T 4 / T 0
145,7 163,4 183.1
9.6 9.7 10.4 11.7 11.9 11.6 10.6 10.6 11,1 12.8 14.0
CONSUMPTION BY HOUSEHOLDS
115.5 121.6 129.4
4,8 5,3 5,5 5.9 5,5 5,3 5,7 5,6 6,1 6.6 5,8 5.4 5.2 4,8
CHANGE IN PRICE
1 9 7 5 = 168.6 2 0 8 . 6 2 5 9 . 7
1 0 0
<¥o. T 4 / T 0
1 4 4 , 0 163.7 184,2
10,7 10,9 12,6 13,4 13,3 13,2 11.9 12,0 12.7 12.9 12.7
167.7 1 9 1 . 4 2 2 5 . 1
.
163.1 192.9 2 3 1 , 5
185,5 2 2 3 . 8 263.3
14.3 17.2 24.1 2 2 . 4 2 0 . 0 19,0 17,7 18,0 15.7 17.5 15.9 16.9 18.2
181.2 2 1 8 . 1 2 6 0 . 4
14.7 17,3 19,7 19.6 2 1 . 2 2 1 . 0
128.9 137.6 1 4 5 . 4
126,9 136.6 147.5
126.9 133.5 140.8
■
161,9 191.7 212,5 227.0
17.6 18,8 20.0 22.3 18.0 17.4 15.1 12.2 14.1 8,9 8,9 8.6 7,0 6,7
CONSOMMATION PRIVEE
EVOLUTION DES PRIX
1 2 5 . 4 133.7 142.5
3,7 4,7 6,7 7,0 7,2 7,0 7,4 5,9 6.0 6.9 6,3
164.2 191,1 2 1 2 , 0
15.0 16.7 18.2 19.1 14.4 13.1 11.3 10.7 10,8 10,5 9,7 8,5 7,2 6,9
0 0 6 BRUTTOANLAGENINVESTITIONEN
VERAENDERUNG DER PREISE
GROSS FIXED CAPITAL FORMATION
CHANGE IN PRICE
FORMATION BRUTE DE CAPITAL FIXE
EVOLUTION DES PRIX
100 1979
1980 1981 1982
1 9 7 9 III
IV 1 9 8 0 I II
III
IV 1 9 8 1 I II
III
IV 1 9 8 2 I II
III IV
144.2 161.6 179.4
11.4 12.0 13.5 14.6 12.7 11.5 11.3 10.4 9.4 9,6 9,4
125.1 131.4 140.6
136.6 152.2 170.5
118.4 127.5 132.8
7,1 7.2 8.3 8.4 7.4 6,4 5.2 4.4 4.0 4.1 3,8 2,4 2,1 2,2
1975
198,8 239.2 289.4
% , T 4 / T 0
146.5 166.8 2 0 4 . 9
10.9 9.9 11.6 13.9 10.8 11.2 1 1 . 0 10.9 10.7 11.8 12.9
175.9 2 0 5 . 6 2 4 9 . 4
183.2 2 2 0 . 3 2 6 6 . 4
16.9 19.3 21.3 2 2 , 4 19,8 17,5 2 0 , 4 21,5 20.9 2 1 . 0 19.7 17.2 17.3
122.5 133.5 1 4 5 . 0
131.7 1 4 1 , 8 153,9
6.9 6,5 6,8 8,0 7,8 8.0 9,3 7,3 5.7
163.6 192.6 2 0 9 . 5