DOI 10.1007/s00382-015-2635-9
A process‑based evaluation of dust‑emitting winds in the CMIP5
simulation of HadGEM2‑ES
Stephanie Fiedler1,2,3 · Peter Knippertz1,4 · Stephanie Woodward5 · Gill M. Martin5 ·
Nicolas Bellouin5,6 · Andrew N. Ross1 · Bernd Heinold7 · Kerstin Schepanski7 ·
Cathryn E. Birch8 · Ina Tegen7
Received: 14 January 2015 / Accepted: 27 April 2015
© The Author(s) 2015. This article is published with open access at Springerlink.com
HadGEM2-ES and ERA-Interim from the European Centre for Medium-Range Weather Forecasts. Compared to ERA-Interim, a stronger pressure ridge over northern Africa in winter and the southward displaced heat low in summer result in differences in location and strength of NLLJs. Particularly the larger geostrophic winds associated with the stronger ridge have a strengthening effect on NLLJs over parts of West Africa in winter. Stronger NLLJs in summer may rather result from an artificially increased mixing coefficient under stable stratification that is weaker in HadGEM2-ES. NLLJs in the Bodélé Depression are affected by stronger synoptic-scale pressure gradients in HadGEM2-ES. Wintertime geostrophic winds can even be so strong that the associated vertical wind shear prevents the formation of NLLJs. These results call for further model improvements in the synoptic-scale dynam-ics and the physical parametrization of the nocturnal stable boundary layer to better represent dust-emitting processes in the atmospheric model. The new approach could be used for identifying systematic behavior in other models with respect to meteorological processes for dust emission. This would help to improve dust emission simulations and contribute to decreasing the currently large uncertainty in climate change projections with respect to dust aerosol.
Keywords Dust emission · Nocturnal low-level jet · Geostrophic wind · Earth system model · Climatology · North Africa
1 Introduction
Mineral dust aerosol from deserts is an important ele-ment of the Earth system. Dust aerosol changes the radia-tion budget directly through scattering and absorpradia-tion as well as indirectly through altering cloud characteristics Abstract Despite the importance of dust aerosol in the
Earth system, state-of-the-art models show a large variety for North African dust emission. This study presents a sys-tematic evaluation of dust emitting-winds in 30 years of the historical model simulation with the UK Met Office Earth-system model HadGEM2-ES for the Coupled Model Inter-comparison Project Phase 5. Isolating the effect of winds on dust emission and using an automated detection for noctur-nal low-level jets (NLLJs) allow an in-depth evaluation of the model performance for dust emission from a meteoro-logical perspective. The findings highlight that NLLJs are a key driver for dust emission in HadGEM2-ES in terms of occurrence frequency and strength. The annually and spa-tially averaged occurrence frequency of NLLJs is similar in
* Stephanie Fiedler
1 School of Earth and Environment, University of Leeds,
Leeds LS2 9JT, UK
2 Institute of Meteorology and Climate Research,
Karlsruhe Institute of Technology, Kaiserstrasse 12, 76131 Karlsruhe, Germany
3 Present Address: Max Planck Institute for Meteorology,
Bundesstrasse 53, 20146 Hamburg, Germany
4 Present Address: Institute of Meteorology and Climate
Research, Karlsruhe Institute of Technology, Kaiserstrasse 12, 76131 Karlsruhe, Germany
5 Met Office, Exeter EX1 3PB, UK
6 Present Address: Department of Meteorology,
University of Reading, Reading RG6 6BB, UK
7 Leibniz Institute for Tropospheric Research,
Permoserstrasse 15, 04318 Leipzig, Germany
8 MetOffice@Leeds, School of Earth and Environment,
and the atmospheric circulation (e.g. Sokolik and Toon
1996; Rosenfeld et al. 2001; Lohmann and Feichter 2005; Tompkins et al. 2005; Karydis et al. 2011; Schmechtig et al.
2011). In addition to these climate effects, suspended dust aerosol decreases the air quality with adverse influences on human health (e.g. Longueville et al. 2010; Griffin 2007). Further impacts of dust include the disruption of air and road traffic due to reduced visibility and solar energy pro-duction due to suspended or deposited dust. Mineral dust also has fertilizing effects on terrestrial and marine ecosys-tems near and far away from dust sources (Okin et al. 2004; Jickells et al. 2005; Mahowald et al. 2005; Shao et al. 2011; Schulz et al. 2012). The major source region for mineral dust on Earth is North Africa, from where it can be trans-ported across the Atlantic and Mediterranean basins (e.g. Prospero 1996; Kallos et al. 2006). Despite the impacts of North African dust aerosol, estimates of both the emitted dust amount (Ginoux et al. 2001; Tegen et al. 2002; Cak-mur et al. 2004; Zender et al. 2004; Tanaka and Chiba 2006; Schepanski et al. 2009; Huneeus et al. 2011; Shao et al.
2011) and its climatic effects remain amongst the largest uncertainties in the present understanding of the Earth sys-tem (e.g. Boucher et al. 2013; Mulcahy et al. 2014).
Studies investigating aerosol-climate effects and esti-mating the atmospheric dust load are often based on global aerosol-climate models. Inter-comparing dust emission estimates from those models show differences of a factor of five to six (e.g. Textor et al. 2006; Huneeus et al. 2011). Globally, dust emission estimates in the AeroCom inter-comparison for the year 2000 range from 500 to 4400 Tg per year, affecting the mean aerosol optical depth (AOD) with values ranging from 0.02 to 0.053 at 550 nm (Huneeus et al. 2011). The model spread in North African dust emis-sion amounts is even larger with 400 to 2200 Tg per year (Huneeus et al. 2011), partly resulting from the lack of observations of the dust emission amount.
Determining the dominant reasons for the spread in state-of-the-art dust emission simulations is complicated due to the different processes involved and feedbacks within coupled Earth system models. Martin and Levine (2012) show that the vegetation die-back in an Earth system model increases the bare soil fraction so that more dust aerosol is emitted from pre-viously sparsely vegetated areas in Africa. Emissions can be increased in this case through both more potential dust sources and stronger near-surface wind speeds due to a smaller surface roughness. The vegetation decrease is caused by a rainfall defi-cit during the West African monsoon which is displaced south-ward. Such feedbacks of rainfall biases could also be present in other Earth system models. For instance, Evan et al. (2014) show that the dust aerosol life-cycle in CMIP5 simulations is substantially different to observations. A systematic analysis of the reasons for differences in dust emission from Earth sys-tem models is missing. Textor et al. (2006) suggest that dust
emission in models varies because of different wind speed distributions which influence dust emission non-linearly. This may not be a simple consequence of the coarse resolution, but due to different representations of meteorological processes leading to dust emission. For instance, in 40-day simulations for summer 2006 with the UK Met Office model, the coars-est configuration (40 km horizontal resolution) has surpris-ingly the largest wind speeds, due to a different development of synoptic-scale conditions (Marsham et al. 2011, 2013). Heinold et al. (2013) use the same model setup to investigate meso-scale processes. Their results suggest that dust emission associated with nocturnal low-level jets (NLLJs) and convec-tive dust storms (haboobs) during summer 2006 are also rep-resented differently. Since the results from these studies are derived from 40 days of data, their implication for long-term climate experiments is not clear. Principally, the model behav-ior with regard to meteorological processes for North African dust emission during other months is not well quantified.
The present work investigates the representation of meteorological processes for North African dust emission over 30 years simulated by the global Earth system model HadGEM2-ES from the UK Met Office. Previous work on HadGEM2-ES has shown global dust emissions at the upper end of the AeroCom range with 3311 +/ 227 Tg per year for particle sizes of 0.03–10 µm (Bellouin et al. 2011; Huneeus et al. 2011). If larger dust particle sizes to up to 30µm are included, the global dust emission amount
in HadGEM2-ES is even larger with 8000 Tg per year (Bel-louin et al. 2011). The associated large dust loads affect the model performance in AOD, which agrees only well with observations when mineral dust aerosol is absent (Bel-louin et al. 2011). Collins et al. (2011) and Woodward (2011) show that HadGEM2-ES produces substantially more dust aerosol than the atmosphere-only model ver-sion HadGEM2-A, especially in the Sahel. This differ-ence is assigned to (1) an increased fraction of bare soil due to vegetation die-back caused by a rain deficit and (2) higher near-surface wind speeds in the coupled model (Col-lins et al. 2011; Martin and Levine 2012). Further model improvements with regard to dust emission require a sys-tematic approach for the evaluation of simulated processes. Especially the origin of the higher wind speeds in the cou-pled model system remains unclear. In the present study, the effect of the simulated winds on dust emission in North Africa is isolated to address the underlying meteorological mechanisms.
et al. 2013; Heinold et al. 2013). NLLJs in North Africa can be formed by different mechanisms, namely inertial oscil-lations (e.g. Blackadar 1957; Knippertz 2008; Wiel et al.
2010), baroclinic conditions along the Saharan heat low (e.g. Parker et al. 2005; Bain et al. 2010; Pospichal et al.
2010) and interaction of the atmospheric flow with moun-tains (e.g. Washington and Todd 2005; Todd et al. 2008). Hourly output from HadGEM2-ES in combination with the automated detection tool for NLLJs by Fiedler et al. (2013) offers the unique opportunity to statistically analyze this dust-emitting process on sub-daily scales over a clima-tological time period of 30 years for new insights into the model performance. Since a long-term observational data set of dust emission does not exist, the dust emission cli-matology from the model by Tegen et al. (2002) calculated with wind speeds from ERA-Interim as in Fiedler et al. (2013, 2014) is used here as a benchmark. Quantifying the relative importance of NLLJs as a dust-emitting process from the models helps identifying systematic model behav-ior affecting dust emission, providing the basis for further advances in Earth system model development. Details of the method are outlined in the following Sect. 2. Results are presented in Sect. 3, followed by a discussion and con-clusions from this work.
2 Method
2.1 Models
The Earth system model HadGEM2-ES is chosen for investigating the representation of dust-emitting winds. HadGEM2-ES was developed at the UK Met Office (Bel-louin et al. 2011; Collins et al. 2011; Martin et al. 2011). It operates at a horizontal resolution of 1.875◦×
1.25◦ with
38 vertical levels up to 39 km. The coupled ocean has a horizontal resolution of 1◦ increasing to
1/3◦ towards the equator and 40 vertical layers. While the temporal inte-gration in the atmospheric component has a time step of 30 min, the coupling to the ocean is hourly. The model is run in the historical CMIP5 setup (Bellouin et al. 2011; Jones et al. 2011) for the period 1980–2010 with hourly output (H2ES-I). In addition to the CMIP5 simulation, a sensitivity experiment with the atmosphere-only model configuration is analyzed for understanding model differ-ences. The atmosphere-only configuration HadGEM2-A (H2ES-A) uses the observed vegetation cover from the “International Geophysical Biophysical Program” (Love-land et al. 2000). H2ES-A is compared against the experi-ment H2ES-C which has prescribed plant functional types of the interactive vegetation parametrization scheme from HadGEM2-ES. The experiment setup for H2ES-A (H2ES-C) is the same as HadGEM2-A (HadGEM2-AE) in Martin
and Levine (2012), but the data in this study captures two monsoon seasons (June to September) of the recent past with half-hourly resolution.
Climatologies of HadGEM2-ES are compared against ERA-Interim forecasts (Dee et al. 2011) which serve as the baseline climatology for model evaluation in the present study. Observational data of comparable quantity and qual-ity are not available over most of North Africa. Instead of the six-hourly re-analysis product of ERA-Interim, short-term forecasts of 12-h length are used as in previous works (Fiedler et al. 2013, 2014). Their advantage is the higher temporal resolution of three hours which is important for representing the diurnal cycle of wind speed and dust emis-sion. The forecasted winds are close to the re-analysis product at 18, 00 and 06 UTC (Fiedler et al. 2013), which shows the best comparison against station observations over land amongst state-of-the-art re-analysis (Decker et al.
2012). The forecasts are initialized at 00 and 12 UTC and have a horizontal resolution of 1 degree. The geopoten-tial height at 925 hPa from ERA-Interim, the Modern-Era Retrospective analysis for Research and Applications (MERRA Rienecker et al. 2011) from NASA, the Climate Forecast System Re-analysis (CFSR Saha et al. 2010) from the National Centers for Environmental Prediction (NCEP) and the re-analysis from NCEP/National Center for Atmos-pheric Research (NCAR Kalnay 1996) are compared to determine the uncertainty in re-analysis of the synoptic-scale conditions.
2.1.1 Stable boundary layer
The representation of NLLJs depends on both the pressure gradient force and the stably stratified boundary layer. In both ERA-Interim and HadGEM2-ES, the stable bound-ary layer is parameterized by a K-diffusion scheme (Brown et al. 2008; Sandu et al. 2013). The vertical turbulent flux w′ψ′ of a given variable ψ with the vertical wind
perturba-tion w′ is related to the vertical gradient of the variable’s
mean value multiplied by a turbulent exchange coefficient K parameterized as:
where l is the mixing length and Ri is the Richardson num-ber. The gradient Richardson number Ri is defined by Stull (1988):
as a function of the gravitational acceleration g and the vertical gradients in the mean virtual potential temperature
(1) K =l2∂ψ
∂zf(Ri)
(2) Ri=
g
θv ∂θv
∂z
∂u
∂z
2 +
∂v
∂z
θv, in the mean zonal and mean meridional wind
compo-nents u and v, respectively. This dimensionless number describes the ratio of the static stability and the vertical wind shear. Turbulent mixing occurs when Ri is below a critical threshold, typically values smaller than 0.4 (e.g. Banta et al. 2003). A long or short-tail function f(Ri) is
implemented and artificially increases the vertical mixing in stable boundary layers so that higher nocturnal near-sur-face winds are simulated than observed (Brown et al. 2006,
2008; Sandu et al. 2013). Such an approach is applied to balance other model shortcomings so that an overall good forecast skill is maintained, e.g. regarding cyclone life-time and near-surface temperatures, and justified by the currently poor representation of surface heterogeneity and sub-grid scale variability (e.g. Brown et al. 2008; Sandu et al. 2013). As a consequence the NLLJ strength is under-estimated possibly affecting dust emission derived from this data (Fiedler et al. 2013).
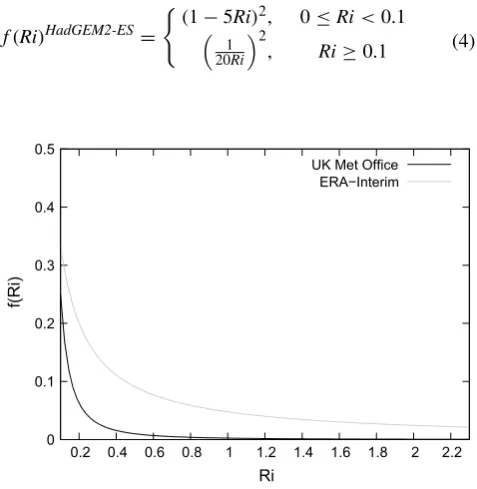
ERA-Interim uses revised long-tail functions for momentum in the boundary layer (Louis et al. 1982; Vit-erbo et al. 1999), which is shown in Fig. 1 and given by:
In HadGEM2-ES, long-tail functions are replaced by sharp functions in the climate configuration of HadGEM2-ES (e.g. Brown et al. 2008; King et al. 2001) given by:
(3) f(Ri)ERA-Interim = 1
1+10Ri(1+5Ri)−1/2, Ri>0.
(4)
f(Ri)HadGEM2-ES=
(1−5Ri)2, 0≤Ri<0.1
1 20Ri
2
, Ri≥0.1
This function reduces the artificially enhanced mixing and thereby complies better with Monin–Obukhov similarity theory (Brown et al. 2008). The difference between both functions is shown in Fig. 1 for Ri≥0.1, which are typical
values for nights with NLLJs.
2.1.2 Dust emission
Dust emission in HadGEM2-ES is calculated interactively (H2ES-I) every time-step with the updated dust emission scheme by Woodward (2001, 2011). This parametrization is based on Marticorena and Bergametti (1995), where the saltation flux FhWoodwardi is calculated for each of 8 bins,
with boundaries at particle radii listed in Table 1, following:
Here, the subscript i refers to the bin number, ρ to the
air density, U∗ to the surface friction velocity, U∗t,i to the
threshold friction velocity for the bin, and Mi to the mass
fraction of soil particles in the bin, S to a preferential
source term, V to the fraction of vegetation cover per grid box, and g to the acceleration by gravity. The constant of proportionality C is set to 2.61 based on wind-tunnel
experiments. Results by Bagnold (1941) provide the basis for the threshold friction velocities, which have been modi-fied to account for the different spatial and temporal scales of HadGEM2-ES compared with the observations. The description of the effect of soil moisture is based on Fécan et al. (1999), modified to work in less arid areas by provid-ing a moisture threshold above which particles cannot be emitted, and tuned to account for the soil-layer depth in the model. The vertical dust flux is calculated for 6 bins cor-responding to the smallest 6 of the horizontal flux. The size distribution is that of the horizontal flux across these bins, but the total vertical flux is obtained from the total horizon-tal flux across all 8 bins, so that the ratio of the vertical to the horizontal flux agrees with the observations of Gillette et al. (1980). Thus for each of the first 6 bins listed in Table
1 the vertical flux FvWoodwardi is given by:
(5) FhWoodwardi =ρ
g(1−V)u
3
∗(1+U∗t,i/U∗)(1−(U∗t,i/U∗)2)MiC S
0 0.1 0.2 0.3 0.4 0.5
0.2 0.4 0.6 0.8 1 1.2 1.4 1.6 1.8 2 2.2
f(Ri
)
Ri
UK Met Office ERA−Interim
Fig. 1 Parametrization for momentum mixing. Shown is the
depend-ency of the long-tail (ERA-Interim) and sharp (HadGEM2-ES) func-tion on the Richardson number above values of 0.1. The funcfunc-tions are applied for the momentum transport in the stable boundary layer
Table 1 Bins of particle-size radii in μm used in the dust emission
schemes
Bin Woodward (2001, 2011) Tegen et al. (2002)
1 0.0316–0.1 0.1–0.288
2 0.1–0.316 0.288–0.871
3 0.316–1 0.871–2.63
4 1–3.16 2.63–7.94
5 3.16–10 7.94–23.99
6 10–31.6 23.99–72.44
7 31.6–100.00 72.44–218.77
[image:4.595.51.290.408.653.2] [image:4.595.306.545.591.716.2]where fc is the clay fraction of the grid box with a
maxi-mum of 0.2. The effect of surface roughness on dust emis-sion has been omitted in Woodward (2001). Potential dust sources are parameterized following Ginoux et al. (2001) with a preferential source term S that depends on the sur-rounding orography:
with the local altitude z and maximum (minimum) altitude zmax (zmin) in the surrounding area of less than 10◦ distance.
The total vertical emission FvWoodward is given by:
Dust-emitting winds from HadGEM2-ES will be com-pared against ERA-Interim. The latter does not provide dust emission data so that these are calculated with the dust model by Tegen et al. (2002) using three-hourly instanta-neous 10m-wind speeds of ERA-Interim (T-EI-O) like in previous studies (Fiedler et al. 2013, 2014). This offline dust model and the scheme by Woodward (2001) are based on the same parametrization proposed by Marticorena and Bergametti (1995). However, they use different particle size distributions, potential dust sources, soil libraries and tuning settings. The scheme by Tegen et al. (2002) uses eight particle-size bins shifted towards larger particle radii (Table 1) which suggests a larger emission mass compared to the parametrization by Woodward (2001). The saltation flux FhTegen in Tegen et al. (2002) is calculated for these
bins by:
where si is the relative surface covered by particle size i.
The vertical dust emission flux FvTegen is calculated with:
with the effects of soil moisture Emoist and a scaling
param-eter α that is set to 10−5cm−1 in potential dust source. A
eff represents the vegetation-free fraction of a grid box poten-tially emitting dust given by:
(6)
FvWoodwardi =10(13.4fc−6.0)FhWoodward i
×
8
i=1
FhWoodwardi /
6
i=1
FhWoodwardi
(7)
S=
z
max−z
zmax−zmin 3
(8) FvWoodward=
6
i=1
FvWoodwardi
(9)
FhTegen= ρ
gu 3 ∗ 8 i=1
1+u∗t,i
u∗
1−
u2∗t,i
u2 ∗ si ,
u∗>u∗t,i.
(10)
FvTegen =FhTegenAeffEmoistα
(11)
Aeff =1−4Vmaxfshrub+Vmonthfgrass.
This factor decreases with a growing fraction of shrub
fshrub and maximum vegetation cover Vmax as well as with the monthly vegetation cover Vmonth and fraction of grass fgrass. Vegetation types are based on Kaplan (2001) and the soil size distribution on the Food and Agriculture Organiza-tion (FAO)/United NaOrganiza-tions soil map of the World (Zobler
1986). Potential dust sources in the simulations with the Tegen et al. (2002) scheme are derived from the SEVIRI satellite product (Schepanski et al. 2007, 2009) as areas with at least two observed dust emission events (Fiedler et al. 2013, 2014; Heinold et al. 2013). The simulation with the Tegen et al. (2002) scheme use a surface roughness of 0.001 cm in potential dust sources, motivated by otherwise missed emission from observed dust sources in complex terrain. This lower surface roughness enables more emis-sion from dust sources because less momentum is trans-ferred to non-erodible obstacles so that more energy is available for particle mobilization.
A direct comparison of H2ES-I against T-EI-O would make it difficult to separate the effects of wind speed and the dust parametrization on the emitted dust amount. In order to reduce uncertainties for the desired intercom-parison, the offline dust emission model by Tegen et al. (2002) is also run with instantaneous 10m-wind speeds from HadGEM2-ES (T-H2ES-O). Three-hourly results of T-H2ES-O are compared against the calculation with T-EI-O. Additionally, an offline dust emission calculation (T-ME-O) is driven with instantaneous 10m-wind speeds from MERRA. The seasonal mean dust emission from T-ME-O is shown along with T-EI-O to illustrate the spread in the best estimates of dust emission with state-of-the-art data sets.
The data sets used in this work are summarised in Table
2. Soil moisture is represented in H2ES-I but not included in the offline emission calculations here (Emoist=1). The
influence of soil moisture is limited to areas along the fringes of the Saharan desert (Fiedler et al. 2014). Other external driving data sets, e.g. potential dust sources, are chosen as in previous studies (summarized above, Fiedler et al. 2013, 2014; Heinold et al. 2013) and are the same for all offline calculations. This approach allows to assign differences in the offline dust emission calculations to the wind speed.
3 Results
3.1 Dust emission
[image:5.595.51.282.54.110.2]half of this emission amount is obtained with T-H2ES-O, namely 1947 Tg. T-H2ES-O is five times larger than the dust mass emitted by T-EI-O with 425 Tg per year. Com-pared to T-ME-O with 280 Tg per year, T-H2ES-O is even larger by about a factor of seven. Compared to the model intercomparison project by Huneeus et al. (2011) the total emission from T-EI-O (H2ES-I) lies at the lower (upper) end of the climate model spread for North Africa. Dust emission from T-EI-O has been evaluated with field and satellite observations in previous works (Fiedler et al.
[image:6.595.84.256.520.663.2]2013, 2014). The evaluation shows a good agreement for the dust source activation frequency compared to satellite data from Schepanski et al. (2009) in most areas, but does not allow a direct conclusion on the emitted dust amounts (Fiedler et al. 2014). Using the classification of the dust storm severity observed in the Bodélé Depression during the BoDEx campaign (Todd et al. 2008) points to a good performance in dust emission magnitudes from T-EI-O (Fiedler et al. 2013).
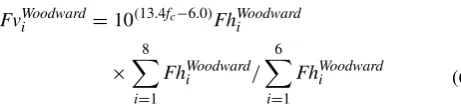
Figure 2 shows the fraction of dust emission per season for H2ES-I and all offline dust emission calculations with the model by Tegen et al. (2002). T-EI-O produces 30 % of its annual dust emission between December and Febru-ary, 40 % in March to May, 20 % in June to August and a minimum of 10 % between September and November. Dust
emission in T-ME-O agrees with the seasonal fractions for winter and summer, but has relatively less (more) emission in spring (autumn) by roughly 10 %. Seasonal fractions of dust emission from T-H2ES-O and H2ES-I should ide-ally lie within the spread between T-EI-O and T-ME-O of 10 % in spring and autumn and 5 % in winter and sum-mer. H2ES-I shows a good agreement for winter and lies within the spread for autumn and spring. The summertime emission fraction, however, is overestimated by 10 %. Looking at T-H2ES-O gives a rather different perspective on the model performance for simulating the seasonal frac-tions of dust emission. While the fracfrac-tions in spring and autumn from T-H2ES-O are within the spread of T-EI-O and T-ME-O, the seasonal fractions for summer and win-ter in T-H2ES-O are under- and overestimated by 10 %, respectively. In order to identify the regions with the larg-est differences, spatial patterns of the seasonal mean dust emission are analyzed next.
The spatial distribution of dust emission is shown in Fig. 3 averaged in units of gm−2 per season. In winter and
spring, the largest dust emissions in H2ES-I are simulated for the southern fringes of the Saharan desert and parts of West Africa with seasonally 80–600 gm−2 (Fig. 3a, b).
These areas continue being active in the remaining months of the year, although peak emissions decrease to values below 100 gm−2 per season in most areas (Fig. 3c, d). The
dust emission from the Sahel is dominant in H2ES-I while little emission is produced in T-H2ES-O. Emissions from the Sahel in the coupled model are analyzed with the sensi-tivity experiment that uses prescribed plant functional types (H2ES-A) from Martin and Levine (2012). H2ES-A shows a reduction of dust emission in the western Sahel compared to H2ES-C for June to September (not shown). Earlier studies suggest an association with larger bare soil fractions due to a vegetation die-back in H2ES-I caused by a deficit of monsoon rainfall (Collins et al. 2011; Woodward 2011; Martin and Levine 2012; Birch et al. 2014). Interestingly, dust emission from the Sahel is even larger in winter and spring with around 100 gm−2 per season in H2ES-I.
Sum-mer is, however, the season when the maximum is expected from T-EI-O and T-ME-O. The small emission over parts of Mali and Mauritania in H2ES-I coincide with small values of the preferential source term used in Woodward (2011).
Table 2 Overview of dust
emission calculations for 1980–2009
“I” in the experiment name refers to the interactive dust emission scheme by Woodward (2001, 2011) and “O” to the offline dust emission model by Tegen et al. (2002). The vegetation is described in Sect. 2 Experiment Dust emission Wind speed Soil moisture Total emission (Tg yr−1)
H2ES-I Interactive HadGEM2-ES Yes 4067
T-H2ES-O Offline HadGEM2-ES No 1947
T-EI-O Offline ERA-Interim forecasts No 425
T-ME-O Offline MERRA re-analysis No 280
Fig. 2 Climatology of seasonal contributions to annual dust
The Bodélé Depression, as an important African dust source, is active throughout the year with maxima of up to 600 gm−2 between September and May in H2ES-I.
North-ern margins and the central Sahara have generally smaller maximum dust emission amounts of up to 400 gm−2 in
spring and summer (Fig. 3b, c).
The dust emission patterns in T-H2ES-O (Fig. 3e–h) are smoother than in H2ES-I. Peak emissions are mostly reduced to values of 100–200 gm−2 in winter and spring
(Fig. 3e, f). Similar to H2ES-I, dust emission in the Bodélé Depression remains comparably large between September and May with maximum emissions of seasonally 400– 600 gm−2. The dust maximum in winter and spring is more
pronounced in T-H2ES-O with seasonally 60–80 gm−2
over large areas in Mali, Mauritania and Algeria. Similar dust emissions are calculated for the northern fringes of the continent in winter that increase in some areas to season-ally 100–200 gm−2. Maximum emissions between June
and November are smaller with 20–80 gm−2 (Fig. 3g, h).
Compared to T-EI-O (Fig. 3i–l), the dust emission in T-H2ES-O are substantially larger throughout the year. The
larger dust emission is most apparent in winter and spring over large areas of West Africa (Fig. 3i, j). Here T-H2ES-O has widespread emission of seasonally 200 gm−2 which
is ten times larger than values in T-EI-O. Emissions in T-H2ES-O remain larger in summer and autumn with typi-cally 60–100 gm−2 per season compared to 10–40 gm−2
in T-EI-O (compare Fig. 3g, h against 3k–l). T-EI-O and T-ME-O show the same spatial patterns for each of the seasons, although the latter has smaller peak emission in springtime North Africa and summertime West Africa. These differences are, however, small compared to the dif-ferences found between T-EI-O and T-H2ES-O. Also the general level of the dust emission amounts in T-H2ES-O is closer to H2ES-I than to T-EI-O. This result indicates that the wind speeds used in the same dust emission model have a larger impact on the calculated dust emission amount than differences between the dust emission parametrizations.
Possible differences of meteorological processes for dust emission in T-H2ES-O and T-EI-O are investigated in the following. The evaluation of T-H2ES-O is hereby entirely based on the comparison with T-EI-O and does not include
(a) (b) (c) (d)
(e) (f) (g) (h)
(i) (j) (k) (l)
(m) (n) (o) (p)
Fig. 3 Dust emission climatology. Seasonal mean dust emission for
(from left to right) December–February, March–May, June–August and September–November based on (a–d) H2ES-I, (e–h)
[image:7.595.81.513.52.387.2]T-ME-O. This choice is motivated by the larger number of dust-emitting winds at night and fewer during the day in MERRA (not shown). In comparison to ERA-Interim, MERRA has more frequent wind speeds of 6–9 ms−1 in
winter and summer that are typically sufficient for dust emission. However, these winds occur primarily at night in MERRA pointing to even more frequent nocturnal events of downward momentum mixing than in ERA-Interim which has an artificially increased turbulent exchange coef-ficient under stable stratification. More nocturnal winds likely cause the larger dust emission over the northern areas of the continent in winter and in the west in summer. ERA-Interim has more frequent events at the upper end of the wind speed distribution above 11 ms−1 in both seasons for
all times of day which are likely connected to strong dust emission events. These are not represented in MERRA despite its higher temporal and spatial resolution. ERA-Interim is therefore chosen as a benchmark for the model evaluation in the following. Dust emission from T-EI-O has been compared against observations (Fiedler et al. 2013,
2014) previously and is therefore not further validated here.
3.2 Diurnal cycle
The diurnal cycle of dust emission and 10m-wind speed provides first indications of the meteorological processes driving dust emission. Heinold et al. (2013) show that the downward mixing of momentum from NLLJs dominates the dust emission during the mid-morning while haboobs are the prevailing mechanism in the late afternoon and evening based on a 40-day convection permitting simula-tion for summertime West Africa. Nighttime emissions in these calculations are a mixture of both processes. The occurrence of haboobs is not expected in HadGEM2-ES because of the parametrization of convection (Marsham et al. 2013). In HadGEM2-ES, dominant emission around midday and in the afternoon may rather be linked to the downward mixing of momentum from a layer of high wind speed in the free troposphere when the daytime boundary layer is sufficiently deep. Nighttime and morning emis-sion are expected to be linked to the vertical mixing of momentum from NLLJs (Fiedler et al. 2013). The diurnal cycle is used as an indication whether these mechanisms are responsible for larger dust emission in T-H2ES-O com-pared to T-EI-O.
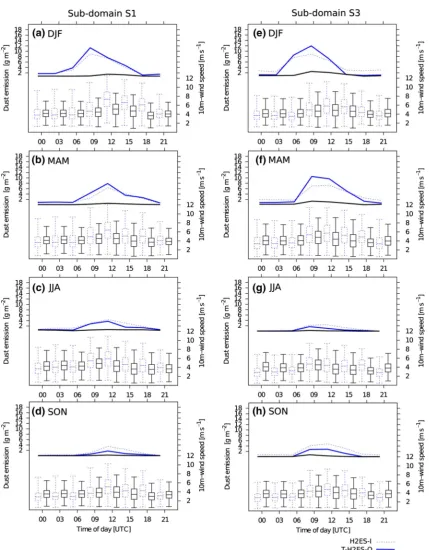
The diurnal cycle of dust emission from H2ES-I, T-H2ES-O and T-EI-O as well as box-and-whisker plots of the near-surface wind speed from HadGEM2-ES and ERA-Interim forecasts seasonally averaged for 1980–2009 are analyzed for the sub-domains S1 over parts of West Africa and S3 enclosing the Bodélé Depression. The geographi-cal location of these sub-domains follows the definition in Fiedler et al. (2013) and are shown in Fig. 4. The analysis
highlights that the differences in the dust emission between T-H2ES-O and T-EI-O are substantially larger than the dif-ferences between T-H2ES-O and H2ES-I independent of the season and sub-domain (Fig. 5). The diurnal ampli-tude in dust emission from T-EI-O is often too small to be resolved by the vertical axis, but is shown on a different scale in Fiedler et al. (2013).
In S1, the overall largest differences in dust emission between T-H2ES-O and T-EI-O occur between December and May (Fig. 5a, b). While T-H2ES-O has peak emis-sions of 12 gm−2 (8 gm−2) at 09 UTC (at 12 UTC) in
win-ter (spring), emissions in T-EI-O do not exceed 2 gm−2. H2ES-I has emissions closer to T-H2ES-O with differences of up to 2 gm−2. The diurnal variations in summer and autumn are similar with peaks in the morning, although the magnitude is generally below 4 gm−2 (5c, d). These
mid-morning emissions point to NLLJs as the driving mechanism for dust emission. Also the diurnal variations of the near-surface wind speed have a clear maximum dur-ing the morndur-ing and at midday, the former of which sup-ports the hypothesis of NLLJs as the driving mechanism for dust emission. The largest wind speeds, here shown by the 99 %-percentile of the 10m-wind speed, are 11 ms−1 at 09 UTC and 12 ms−1 at 12 UTC in HadGEM2-ES,
com-pared to 8 ms−1 at 12 UTC in ERA-Interim. These winds are well above typical threshold values for dust emission onset. A perfect correlation between the wind speed and dust emission maxima, however, is not seen. For instance the largest wind speeds in HadGEM2-ES occur at 12 UTC, but the peak emission is earlier at 09 UTC. This can be due to surface properties that suppress dust emission in parts of the sub-domain, i.e. the high wind speeds at 12 UTC occur away from dust sources. As a result dust emission may not
Fig. 4 Geographical map. Shown are the (shaded) terrain height in
[image:8.595.308.543.53.241.2]Fig. 5 Diurnal cycle of dust emission and 10m-wind speed per
sea-son. (Top) Dust emission from (dashed) H2ES-I, (blue) T-H2ES-O and (black) T-EI-O. (Bottom) box-and-whisker plots of the 10m-wind speed (dashed) from HadGEM2-ES and (solid) ERA-Interim for the sub-domain (15◦
W–0◦,
10◦
N–25◦
N, a–d) S1 and (10◦
E–20◦ E, 10◦
N –25◦
N, e–h) S3. Figure shows three hourly values spatially averaged
[image:9.595.84.514.49.600.2]occur even if a sufficient wind speed is given at the grid point.
A similar diurnal cycle is found in the sub-domain S3 shown in Fig. 5e–h. Dust emissions are largest at 09 UTC in winter and spring with 12 gm−2 in T-H2ES-O, 8 gm−2 in
H2ES-I and 3 gm−2 in T-EI-O (Fig. 5e, f). The 99
%-per-centile of the wind speed in HadGEM2-ES at that time is 11 ms−1 spatially averaged. Maxima from HadGEM2-ES are also found at 09 and 12 UTC in summer and autumn (Fig. 5g, h), but the dust emission amount from T-H2ES-O does not exceed 2 and 4 gm−2, respectively. ERA-Interim has fewer events at the upper end of the 10m-wind speed distribution and also T-EI-O has much smaller dust emis-sion amounts than T-H2ES-O.
In summary, the mid-morning maxima of both the 10m-wind speeds and the dust emission from T-H2ES-O, H2ES-I and T-EI-O in parts of West Africa for December– February and the Bodélé Depression for December–August suggest that the NLLJ is a key driver for emission. Both regions have been identified for frequent NLLJ occurrence based on ERA-Interim (Fiedler et al. 2013). The NLLJ is further analyzed in the following Sect. 3.3. The midday maximum of dust emission and peak winds in parts of West Africa in spring points to strong synoptic-scale pressure gradients in the lower troposphere which will be addressed in Sect. 3.4.
3.3 Representation of NLLJs
The skill of ERA-Interim in NLLJ forecasting is tested with a contingency table using quality controlled radio-sondes launched during the African Monsoon Multidisci-plinary Analysis (AMMA, Redelsperger et al. 2006; Parker et al. 2008; Agust-Panareda et al. 2009). The longest record of radiosondes around 00 UTC is available at Agadez, Niger (16◦N, 7◦E) for January–October, which is located in an area of frequent NLLJ formation. NLLJ presence at
midnight in ERA-Interim is manually compared against its occurrence in the radiosonde data. Manual comparison has been chosen since the automated detection from Fie-dler et al. (2013) is not directly transferable to the noisy radiosonde data. Some nights are missing in the observa-tion record so that 242 nights are examined in total. Ten nights showed some ambiguity and are excluded from the statistics. The hit rate of 0.92, the probability of detection of 0.96, and the false alarm ratio of 0.04 indicate a good forecast performance for NLLJ events. However, the small sample size limited to one station and year does not allow to generalize this finding. Especially taking into account that the occurrence of NLLJs is a frequent event in both the model and the observation, the statistical assessment of the model skill is rather limited. More quality-controlled upper-air observations from North Africa are needed for reliably assessing NLLJs in the re-analysis over North Africa. In the absence of more observations, NLLJs from ERA-Interim are used as the benchmark.
3.3.1 Occurrence frequency
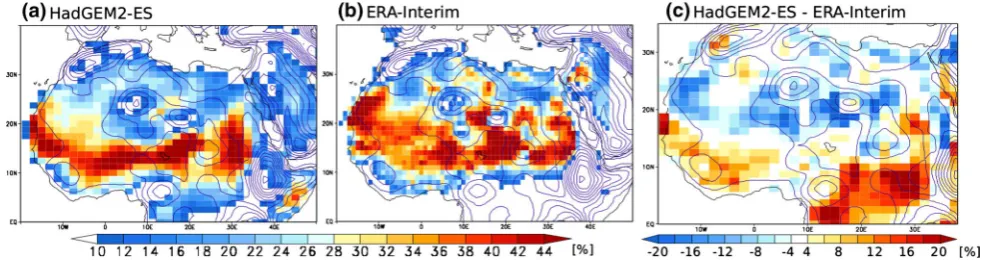
The diurnal cycle of dust emission and near-surface wind speed indicates that NLLJs play a role in dust emission. Using the automated NLLJ detection algorithm developed by Fiedler et al. (2013) allows a more detailed analysis. The NLLJ occurrence frequency is defined as the percentage of nights showing a NLLJ. In the annual and spatial mean, the NLLJ occurrence frequency from HadGEM2-ES is 27 %, remarkably close to 29 % found in ERA-Interim for 1980–2009. Figure 6 shows the spatial distribution of the occurrence frequency of NLLJs in HadGEM2-ES, in ERA-Interim and the difference between both climatologies. While both models show NLLJ occurrence maxima with frequencies exceeding 30 % along a distinct band over the southern parts of the Sahara, NLLJ occurrence maxima in HadGEM2-ES are shifted southwards and appear in a band
Fig. 6 Annual mean climatology of nocturnal low-level jets.
Annual mean NLLJ occurrence frequency for (a) HadGEM2-ES, (b) ERA-Interim and (c) absolute difference of NLLJ frequency from
[image:10.595.51.543.543.673.2]that is narrower over the West. Computing the difference between both models shows that NLLJs in HadGEM2-ES occur up to 12 and 20 % more frequently in southern West Africa and central Africa, respectively. The difference in the latter region, however, has no implication for dust emis-sion because of the lack of dust sources near the equator.
In contrast to these larger numbers of NLLJs, nights with NLLJs in the center, north and west of North Africa are up to 20 % less frequent.
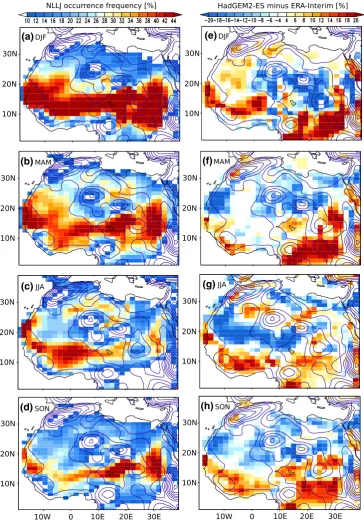
The seasonal distributions are investigated to identify the time of largest differences. Figure 7 shows the seasonal dis-tribution of NLLJ occurrence frequencies in HadGEM2-ES
(a) (e)
(b) (f)
(c) (g)
(d) (h)
Fig. 7 Seasonal mean climatology of nocturnal low-level jets.
Sea-sonal mean NLLJ occurrence frequency for (left, a–d) HadGEM2-ES and (right, e–h) absolute difference of NLLJ frequency for
[image:11.595.115.480.151.678.2]and the differences between HadGEM2-ES compared to ERA-Interim. During winter NLLJs occur more frequently over West Africa in HadGEM2-ES with typical differences of 4–20 % (Fig. 7a, e). At the same time, areas in the cen-tral Sahara are characterized by fewer events. In spring, an underestimation compared to ERA-Interim is more wide-spread, when the west coast and northern parts of Africa have fewer events by −8 to −20 %, but the Bodélé Depres-sion shows more NLLJs by up to 10 % (Fig. 7b, f).
Summertime West Africa shows fewer NLLJs in HadGEM2-ES, while areas further south have larger num-bers of NLLJ nights (Fig. 7c, g). More NLLJs are also detected over southern areas of Algeria and Libya in sum-mer. At the same time fewer events are detected along the northern coast of Libya. This pattern strongly suggests a southward displacement of NLLJ maxima along the mar-gins of the Saharan heat low. The shift of the heat low and, therefore, the NLLJ maxima, may be connected to the southward displaced monsoon in HadGEM2-ES. The pat-tern of more NLLJs in the south and less in the north of West Africa is also found in autumn, but now accompanied by more NLLJ nights in the Bodélé Depression (Fig. 7d, h).
3.3.2 Associated dust emission
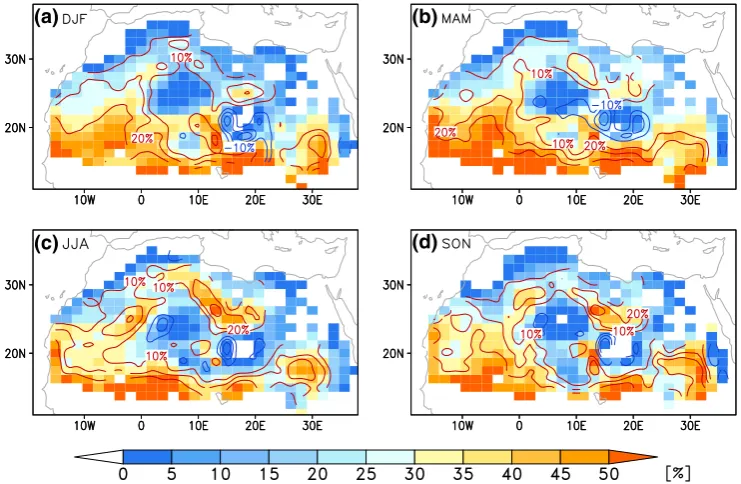
The importance of NLLJs for dust emission in T-H2ES-O is measured by quantifying the dust emission amount asso-ciated with NLLJs, i.e. dust emitted during NLLJ events
as in Fiedler et al. (2013). Figure 8 shows the fraction of dust emission in T-H2ES-O that coincide with NLLJs in HadGEM2-ES and the difference to T-EI-O. Particu-larly in winter 25–50 % of the dust emission is associated with NLLJs south of 25◦
N in T-H2ES-O (Fig. 8a). Here,
T-H2ES-O has larger fractions in western areas compared to T-EI-O on the order of 30 % (Fig. 8a). In the Bodélé Depression around 50 % of the emission is associated with NLLJs in T-H2ES-O, which is of the same order of magnitude as in T-EI-O. The spatial distribution in spring is similar, but shows NLLJ contributions exceeding 50 % over larger areas in the south (Fig. 8b). Particularly, west-ern areas south of 20◦
N have again larger fractions by
more than 30 % in T-H2ES-O compared to T-EI-O. Dust emission associated with NLLJs increases to values larger than 25 % over most of the north in spring which is at least 10 % larger than in T-EI-O. The spatial distribution in sum-mer and autumn is similar to spring (Fig. 8c, d). In Libya, 40 % of the dust emission is associated with NLLJs dur-ing summer which is typically 20 % larger than in T-EI-O. Characteristic amounts of dust emission coinciding with NLLJs over parts of West Africa in summer and autumn are 30 %, which is in some areas larger by 10–20 % compared to T-EI-O.
In summary, NLLJs occur more frequently in HadGEM2-ES than in ERA-Interim in southern parts of West Africa throughout the year and in the area of the Bodélé Depression in spring and autumn. West African
(a) (b)
(c) (d)
Fig. 8 Fraction of dust emission associated with NLLJs. Seasonal mean
(shaded) fraction of dust emission from T-H2ES-O associated with NLLJs and (contours) absolute difference in fraction associated with
[image:12.595.112.483.431.673.2](a)
(b)
(c)
(d)
(e)
(f)
(g)
[image:13.595.113.485.49.602.2](h)
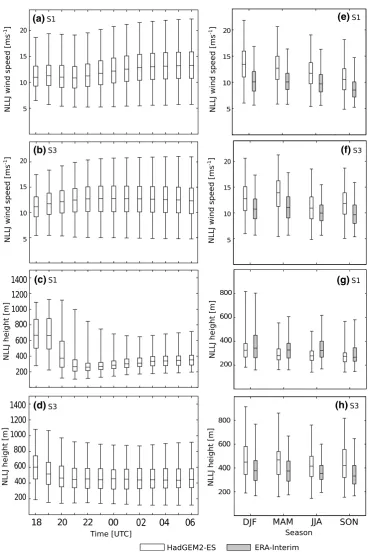
Fig. 9 NLLJ characteristics. (a–d, left) Temporal development of
hourly box-and-whisker plots showing (from top to bottom) the 99-, 75-, 50-, 25- and 1 %-percentiles of the NLLJ core wind speed spa-tially averaged for sub-domain (a) S1 and (b) S3 and the NLLJ core height spatially averaged for (c) S1 and (d) S3 based on
areas, particularly south of 20◦
N, have a larger fraction
of dust emission associated with NLLJs in HadGEM2-ES. The more frequent number of NLLJs in HadGEM2-ES and the large contributions of NLLJs to dust emission in certain regions of North Africa support the hypothesis that differ-ences in the NLLJ frequency and their characteristics are a cause of larger dust emission during the mid-morning in T-H2ES-O. It is interesting to understand whether this is an effect of more frequent NLLJ formation only or whether the wind speed and height of the NLLJ plays a role. The NLLJ characteristics are therefore analyzed for the two key regions next.
3.3.3 NLLJ characteristics
The speed and height of NLLJs are important for the down-ward mixing of momentum to the surface. These variables are investigated for a thorough evaluation of the NLLJ in HadGEM2-ES for the two key regions S1 and S3 cover-ing parts of West Africa and wide areas around the Bodélé Depression, respectively. Figure 9 shows the NLLJ core wind speed and height in HadGEM2-ES for these sub-domains. In S1, the median wind speed in the NLLJ core is around 11 ms−1 at the beginning of the night (Fig. 9a). Between 21 UTC and 03 UTC the median core wind speed of NLLJs increases to 13 ms−1 and persists at this value
until 06 UTC. As in ERA-Interim (Fiedler et al. 2013), a nocturnal or near-morning wind speed maximum in the NLLJ core does not exist, which is consistent with artifi-cially increased vertical mixing in both models (Brown et al. 2006, 2008; Sandu et al. 2013). The median core wind speed in HadGEM2-ES, however, is 2 ms−1 larger
com-pared to ERA-Interim shown in Fiedler et al. (2013), prob-ably at least partly related to a weaker enhancement of ver-tical mixing in HadGEM2-ES (Sect. 2, Brown et al. 2008). The upper end of the wind speed distribution in the core of NLLJs has values of up to 23 ms−1, which is higher than in
ERA-Interim with 17 ms−1. This upper end of the
distribu-tion is particularly important for dust emission due to the non-linear dependency on the wind speed. The distribution of core wind speeds in S3 shows an earlier increase of the median wind speed from 11 ms−1 at 18 UTC to 12.5 ms−1 at
22 UTC (Fig. 9b). Here the development of the nocturnal boundary layer is more advanced at 18 UTC, which cor-responds to 19 local time (LT). In contrast, 18 UTC in the west is 17 LT which is too early for NLLJ formation over wide areas. The highest value of the 99 %-percentile in the early morning is in S3 22 ms−1, therefore slightly lower
than in the western sub-domain, but substantially larger than in ERA-Interim with 18 ms−1 shown in Fiedler et al.
(2013).
While the NLLJ wind speed is shifted to higher values in HadGEM2-ES, the NLLJ core height is comparable
between both models in S1 (Fig. 9c). After a sharp decrease of NLLJ core heights in the first evening hours, HadGEM2-ES has median NLLJ heights around 250 m increasing to 350 m for 03–06 UTC. The height during the morning is of the same order of magnitude as the ERA-Interim long-term median for this region. The difference in the median NLLJ height in S3 with typically 450 m in HadGEM2-ES and 380 m in ERA-Interim (Fig. 9d) is too small for being resolved by HadGEM2-ES with levels at 250, 410 and 610 m a.g.l. It is interesting that the NLLJ height is not as sharply decreasing in the early evening in S3 as in S1. This difference is likely caused by a more advanced nocturnal development at 18 UTC (19 LT) in S3 located in the east of the continent.
The nocturnal development suggests substantial differ-ences of the NLLJ wind speed between ERA-Interim and HadGEM2-ES. Figure 9e–h show the comparison of the NLLJ wind speed and height seasonally averaged for S1 and S3. The largest median values of NLLJs in S1 occur in winter with 13 ms−1 at 320 m and gradually decrease
in the following seasons to 11 ms−1 at 270 m in autumn. Compared to ERA-Interim, these median wind speeds are larger by 2–3 ms−1 while the 99 %-percentiles of the NLLJ
wind speed are even larger by up to 5 ms−1. S3 shows
simi-larly large NLLJ wind speeds (Fig. 9f) at similar altitudes of the NLLJ core (Fig. 9h). Reasons for larger NLLJ wind speeds at similar altitudes in HadGEM2-ES may be due to model differences in the representation of synoptic-scale conditions and the stability in the nocturnal boundary layer which are investigated in the next two sections.
3.4 Synoptic‑scale conditions
(a)
(b)
(c)
(d)
(e)
(f)
(g)
(h)
Fig. 10 Climatology of geopotential height and geostrophic wind at
925 hPa at 00 UTC. Seasonal mean of (a–d, left) geopotential height and (e–h, right) geostrophic wind speed at 925 hPa from (shaded) HadGEM2-ES and (grey contours) difference of HadGEM2-ES
[image:15.595.113.484.50.644.2]In order to quantify the contribution from differences in the synoptic-scale conditions between both models, the geostrophic wind at 925 hPa
vg
=
u2
g+v2g is calculated
from the geopotential height φ and the latitude-dependent
Coriolis parameter f following (e.g. Stull 1988):
Figure 10e–h shows the seasonal mean geostrophic wind at 925 hPa. At that level
vg
is larger in HadGEM2-ES by up to 4 ms−1 over all southern sub-domains during winter (Fig. 10e). Similarly, larger geostrophic winds are found during spring, but the spatial extent of areas with larger
vg in HadGEM2-ES is smaller. Since
vg
is a strong control of the NLLJ wind speed, their larger values in HadGEM2-ES in S1 and S3 during winter and spring are likely caus-ally related. The conditions at 12 UTC show similar results for these months (not shown). The stronger geostrophic Harmattan winds at that time, consistent with a larger gra-dient in the geopotential height, likely cause the stronger 10m-wind speeds and dust emission during midday in S1 and S3 during winter and spring.
May to September is dominated by the establishment of the heat low over West Africa (Fig. 10b–d). The heat low is shifted southwards in HadGEM2-ES which is con-nected to a southward displaced West African monsoon system. Along with the shift of the heat low, the position of NLLJ occurrence maxima along the margins change. At the same time smaller geostrophic winds are found for HadGEM2-ES over most areas in the north and in the cen-tral Sahara, contrary to areas along the southern margins of the heat low with geostrophic wind speeds larger by up to 4 ms−1 (Fig. 10g). Here, the sensitivity test H2ES-C shows a clear increase of the near-surface wind speed which coincides with larger dust emission compared to H2ES-A (not shown). This result suggests that the vegetation die-back has a positive feeddie-back on dust emission in H2ES-I through: (1) the increased bare soil fraction resulting in more potential dust sources and (2) stronger winds at the surface in agreement with Martin and Levine (2012). The larger geostrophic winds by up to 4ms−1 over this area
sug-gest that the synoptic-scale dynamics are more important than a reduction in the surface roughness associated with the vegetation die-back. Smaller values of
vg
over most of S1 are not consistent with the larger NLLJ wind speeds in summer, so it is likely that mechanisms other than the syn-optic-scale conditions dominate here. Similarly, S3 has not as large a model difference in
vg
during summer as earlier in the year, so again other mechanisms are likely to contrib-ute more to strong NLLJs.
(12)
ug= 1 f
∆φ ∆y
vg= − 1 f
∆φ ∆x.
From October onwards, the heat low retreats to the southeast while the ridge over the north strengthens again (Fig. 10d). These conditions are similarly simulated by HadGEM2-ES and ERA-Interim forecasts. Since the mean pressure gradient over northwest Africa is not affected as much as at the beginning of the year, the geostrophic wind speed differences are smaller (Fig. 10h). Only areas close to the wintertime heat low in the east and in the Bodélé Depression show larger geostrophic winds in HadGEM2-ES. Over the West, weaker boundary layer mixing under stable stratification in HadGEM2-ES (Brown et al. 2008) may contribute more to the larger NLLJ wind speeds dur-ing summer and autumn, and this is analyzed next.
3.5 Stability associated with NLLJs
In addition to the geostrophic wind, the strength of NLLJs is determined by the low-level stability and the potential momentum loss at the NLLJ level due to vertical mixing. Figure 11 shows the seasonally averaged diurnal cycle of stability characteristics associated with NLLJs for the sub-domains S1 and S3, respectively. The 1 %-percentile of the vertical gradient of the virtual-potential temperature as a measure of the minimum stability below the NLLJ core is similar in both models due to the applied threshold for NLLJ detection. However, also the median is often simi-lar in both models, particusimi-larly in S1 during spring from 21 to 06 UTC (Fig. 11b). A small tendency towards larger nocturnal stability below the NLLJ core in HadGEM2-ES is found for S1 during summer and autumn (Fig. 11c, d) and towards less stable conditions for S3 during win-ter and spring (Fig. 11e, f). The larger stability suggests a stronger frictional decoupling and therefore the possibil-ity of developing stronger NLLJs despite the smaller geo-strophic winds in this region and season. Weaker stability would imply weaker winds in the NLLJ if all other con-ditions are similar. However, larger NLLJ wind speeds are found for HadGEM2-ES in S3 at the beginning of the year. In this case the synoptic-scale conditions cause larger geo-strophic winds that are particularly favorable for stronger NLLJs. It is interesting that both regions show larger sta-bility in HadGEM2-ES during winter in the early morning. This implies that NLLJ may survive for a longer time in HadGEM2-ES before being eroded by turbulent mixing.
Fig. 11 Seasonal mean diurnal cycle of stability characteristics
associ-ated with NLLJs. Shown are the mean diurnal cycles for (a, e) December– February, (b, f) March–May, (c, g) June–August and (d, h) September– November for 1980–2009 of the (blue) 1 % and (red) 50 % percentiles for (top) the vertical gradient of the virtual potential temperature ∆θv/∆z and
wind shear below NLLJs is much larger consistent with stronger NLLJs at similar heights. Based on S1 in spring, when the stability in both models agree particularly well, the vertical wind shear between the median NLLJ height and the ground is 30 % larger in HadGEM2-ES (0.045 s−1)
than in ERA-Interim (0.031 s−1).
The 1 %-percentile of Ri in HadGEM2-ES is mostly lower than in ERA-Interim suggesting that HadGEM2-ES is more prone to nocturnal mixing during NLLJ events. As in ERA-Interim, the vertical exchange coefficient for momen-tum in HadGEM2-ES is artificially increased (Brown et al.
2006, 2008; Sandu et al. 2013). This leads to an overesti-mation of vertical momentum mixing, weakening the NLLJ and increasing the near surface winds at night (Fiedler et al.
2013; Sandu et al. 2013). These winds can also be strong enough for nocturnal dust emission in T-H2ES-O (compare Fig. 5). As a result, the NLLJ accelerates to a certain speed and remains at that wind speed level during the night simi-lar to ERA-Interim. The NLLJ core wind speed, however, is larger in HadGEM2-ES likely due to the smaller enhance-ment of the vertical mixing than in ERA-Interim (Brown et al. 2008; Sandu et al. 2013). This contributes to stronger NLLJs in HadGEM2-ES independent of the geostrophic wind speed, but the NLLJ wind is expected to be larger where the geostrophic wind is also stronger.
3.6 Discussion
The Earth system model HadGEM2-ES is analyzed regard-ing the simulation of dust emissions and NLLJs as driv-ing mechanism. Dust emissions are calculated offline with the model by Tegen et al. (2002) which is driven with 10m-wind speeds from HadGEM2-ES (T-H2ES-O) and ERA-Interim forecasts (T-EI-O) for investigating the iso-lated effect of winds on dust emission. The level of the dust emission amount from the interactive emission scheme in HadGEM2-ES (H2ES-I) is closer to the offline version T-H2ES-O than T-H2ES-O to T-EI-O, suggesting that the impact of the wind speed is larger than the choice of the dust emission parametrization scheme. Differences in their spatial distribution of dust emission are apparent over the Sahel where H2ES-I produces large amounts compared to T-H2ES-O with virtually no events. Emission is here ena-bled by a vegetation die-back in the dynamic vegetation parametrization of HadGEM2-ES due to a rainfall deficit (Collins et al. 2011; Martin and Levine 2012). Simultane-ously larger near-surface wind speeds over this area coin-cide with larger geostrophic winds pointing to the impor-tance of the synoptic-scale conditions. The results of this study lead to the general question whether increased model complexity of an Earth system model adds value to the esti-mate of North African dust emission. Although this study is undertaken for HadGEM2-ES, other CMIP5 models may
show similar uncertainties. For instance, Evan et al. (2014) suggest that CMIP5 models in general show differences in the dust aerosol life cycle compared to observations. The approach of isolating processes affecting emission applied in this study could help to identify systematic behavior for further improvements of those models.
The results highlight that T-H2ES-O has substantially larger dust emission over North Africa compared to T-EI-O, particularly in winter and spring. These differences of the emitted dust amount are pronounced in the West Afri-can sub-domain and the Bodélé Depression where stronger winds are simulated compared to ERA-Interim. The ori-gin of these larger wind speeds and dust emissions are addressed by evaluating the NLLJ frequency, their charac-teristics, the atmospheric stability and the synoptic-scale conditions. The key findings of the evaluation from the two key regions, captured by the sub-domains S1 and S3, are discussed in the following.
3.6.1 Sub‑domain S1
of vertical momentum mixing. In consequence, the NLLJ core wind speeds remain strong leading to larger dust emission at the following morning compared to T-EI-O.
Conditions in spring are similar regarding the dust emis-sion associated with NLLJs, the NLLJ speed, the geopoten-tial height and the geostrophic wind (Table 3). Regions with larger NLLJ frequencies in HadGEM2-ES, however, are lim-ited to southwest Africa while the center shows little differ-ences in NLLJ occurrence and areas along the coast show a reduction compared to ERA-Interim. The time of maximum emission and wind speed is also later at 12 UTC, suggest-ing that the downward mixsuggest-ing of momentum in the daytime boundary layer in spring is more important for producing the majority of dust emission than the stronger NLLJs. These winds are driven by the larger horizontal gradient in the geo-potential height that is present throughout the day.
Summer is characterized by a shift in NLLJ occurrence maxima due to the more southern position of the Saharan heat low in HadGEM2-ES. The Sahel has a larger bare soil fraction in H2ES-C compared to H2ES-A that leads to
more dust emission because of more potential dust sources and larger near-surface wind speeds. In T-H2ES-O, larger dust emission occurs over southern West Africa and a sub-stantial fraction of this is associated with NLLJs (Table 3). NLLJs are stronger here like earlier in the year. Differences in the horizontal gradient of the geopotential height, how-ever, are smaller in HadGEM2-ES than in ERA-Interim. The weaker artificial enhancement of the vertical mixing in the stable boundary layer in HadGEM2-ES compared to ERA-Interim (Brown et al. 2008; Sandu et al. 2013) can therefore have a larger net impact on the strength of NLLJs in summer. The spatial shift of NLLJs persists until Sep-tember and vanishes with the retreat of the heat low from West Africa thereafter.
3.6.2 Sub‑domain S3
The Bodélé Depression is one of the most active places for dust emission and is located in sub-domain S3, for which the findings are summarised in Table 4. Here, T-H2ES-O shows
Table 3 Summary of findings
for sub-domain S1
Modest (largest) overestimation of meteorological parameters of HadGEM2-ES compared against ERA-Interim and dust emission from T-H2ES-O against T-EI-O highlighted in italics (bold)
Differences in Dec–Feb Mar–May Jun–Aug Sep–Nov
Dust emission (gm−2) 10 8 3 1
Emission associated with NLLJs (%) 20 to 30 20 to 30 10 to 20 20 to 30
NLLJ event frequency (%) 0 to 20 20 to 20 20 to 20 20 to 20
Median NLLJ wind speed (ms−1) 3 2 2 2
99 %-percentile (ms−1) 5 4 3 4
Median Ri (frac) 1.5 1 0.5 1
Geopotential height at 925 hPa Stronger High Stronger High Shifted Low Shifted Low
Geostrophic wind speed (ms−1) 1 to 4 1 3 to 3 1 to 2
[image:19.595.160.544.55.185.2] [image:19.595.117.479.232.415.2]larger dust emission compared to T-EI-O throughout the year, particularly in winter and spring when peak emissions at 09 UTC point to the importance of NLLJs. NLLJ core wind speeds are particularly large in both seasons linked to stronger geostrophic winds at 925 hPa in HadGEM2-ES (Fig. 12). NLLJs, however, occur less frequently in winter compared to ERA-Interim. This result is surprising as win-ter is the time of year when the channeling of the prevailing north-easterly Harmattan winds cause favorable conditions for NLLJ formation (Washington and Todd 2005; Todd et al.
2008; Fiedler et al. 2013). Todd et al. (2008) provide obser-vational evidence that a stronger synoptic-scale pressure gra-dient across the Bodélé Depression causes high wind speeds throughout the day while the NLLJ mechanism enhances the winds during the following morning. It is likely that the vertical wind shear below the larger geostrophic winds in HadGEM2-ES leads to so much vertical mixing that the for-mation of NLLJs is prevented in some nights.
From spring onwards, the NLLJ wind speed as well as the 09 UTC maximum in both dust emission and 10m-wind speed suggest that the NLLJ is important for dust emission. The geostrophic winds in HadGEM2-ES are larger dur-ing sprdur-ing and autumn (Table 4), pointing to a substantial contribution from synoptic-scale conditions. While the sta-bility below the NLLJ core is remarkably similar in both models for those seasons, the gradient Richardson number is smaller in HadGEM2-ES and points to more nocturnal mixing events (Table 4). Here, the larger geostrophic winds may again aid NLLJs to strengthen after the weakening effect of vertical momentum mixing during the night. The stronger geostrophic winds are likely the first-order driver of stronger NLLJs and associated dust emission. A contrib-uting factor to stronger NLLJs is the weaker enhancement of mixing during stable stratification in HadGEM2-ES (e.g. Brown et al. 2008).
3.6.3 Uncertainty
ERA-Interim is used as a benchmark for assessing the Earth system model HadGEM2-ES. While ERA-Interim is the best estimate of the past state of the atmosphere
(e.g. Decker et al. 2012), the largest NLLJ winds are likely underestimated in ERA-Interim (Fiedler et al. 2013; Sandu et al. 2013). The spatial resolution and the physical param-eterizations are sources for uncertainty which shall be briefly discussed based on existing studies.
While problems in modeling the stable atmospheric boundary layer (ABL) are known for decades, little pro-gress has been made with regard to better simulating NLLJs (e.g. Holtslag et al. 2013). This is attributed to the physical parametrization of the ABL but also to weak-nesses of other model components, e.g. the parametriza-tions of the soil, surface and radiation (e.g. Steeneveld et al. 2006, 2008). Higher spatial resolution in models can improve the representation of stable ABLs, but does not entirely solve the problem (e.g. Steeneveld et al. 2006; Svensson et al. 2011). By analyzing the regional model MM5 over the Bodélé Depression, Todd et al. (2008) indi-cate a small sensitivity of the NLLJ to the vertical reso-lution close to the surface. The horizontal resoreso-lution is important in complex terrain, but has a small effect on the NLLJ away from mountainous regions (Todd et al. 2008). Over West Africa, Schepanski et al. (2014) show with the regional model WRF and two state-of-the-art re-analysis products that changing the spatial resolution, ABL and surface-layer parametrization has overall smaller impacts on NLLJs than the initial and lateral boundary conditions. For another model nudged to ERA-Interim, Hourdin et al. (2014) indicate that improving the parametrization of dry convection in the daytime boundary layer positively affects the downward mixing of momentum from NLLJs during the following morning. In summer, NLLJs can be formed by aged cold pools above nocturnal near-surface temperature inversions (Heinold et al. 2013). This mech-anism is poorly represented in both ERA-Interim and HadGEM2-ES, but their effect is rarely important in the dry season due to the dependence on convective down-drafts from deep moist convection. Although daytime near-surface winds in ERA-Interim are likely underesti-mated, ERA-Interim compares best against observations amongst state-of-the-art re-analysis (Decker et al. 2012; Largeron 2015).
Table 4 As Table 3 but for
sub-domain S3 Differences in Dec–Feb Mar–May Jun–Aug Sep–Nov
Dust emission (gm−2) 10 10 1 2
Emission associated with NLLJs (%) 20 to 20 10 to 30 10 to 30 10 to 30
NLLJ event frequency (%) 20 to 0 14 to 14 20 to 14 20 to 20
Median NLLJ wind speed (ms−1) 2 3 1 2
99 %-percentile (ms−1) 3 3 3 3
Median Ri (frac) 1.5 1 0.5 1
Geopotential height at 925 hPa Stronger High Stronger High Shifted Low Shifted Low
[image:20.595.181.545.58.185.2]