White Rose Research Online eprints@whiterose.ac.uk
Universities of Leeds, Sheffield and York
http://eprints.whiterose.ac.uk/
This is an author produced version of a paper published (online early) in Complexity.
White Rose Research Online URL for this paper:
http://eprints.whiterose.ac.uk/78184/
Paper:
Bale, CSE, McCullen, NJ, Foxon, TJ, Rucklidge, AB and Gale, WF (2014)
Modeling diffusion of energy innovations on a heterogeneous social network and approaches to integration of real-world data. Complexity.
Modelling diffusion of energy innovations on a heterogeneous
social network and approaches to integration of real-world data
Catherine. S. E. Bale a,d,*, Nicholas J. McCullenb,^, Timothy. J. Foxonc,d, Alastair M.
Rucklidgeb, William F. Galea,d
a Energy Research Institute, Energy Building, School of Process, Environmental and Materials Engineering,
Faculty of Engineering, University of Leeds, Leeds LS2 9JT, UK. Email: c.s.e.bale@leeds.ac.uk ; w.f.gale@leeds.ac.uk
b
Department of Applied Mathematics, University of Leeds, Leeds LS2 9JT, UK Email: a.m.rucklidge@leeds.ac.uk
c Sustainability Research Institute, School of Earth and Environment, Faculty of Environment, University of
Leeds, Leeds LS2 9JT, UK. Email: t.j.foxon@leeds.ac.uk
d Centre for Integrated Energy Research, University of Leeds, Leeds LS2 9JT, UK
^ Present address: Energy and the Design of Environments (EDEn) research unit, Architecture and Civil Engineering, University of Bath, Claverton Down, Bath, BA2 7AY, UK. Email: n.mccullen@physics.org
* Corresponding author: Email address: c.s.e.bale@leeds.ac.uk Tel: +44 (0)113 343 8250
Fax: +44 (0)113 246 7310
Abstract
A model has been developed to simulate the diffusion of energy innovations on a heterogeneous social network. Nodes on a network represent households, whose adoption of an energy innovation is based on a combination of personal and social benefit; social benefit includes the positive influence from an individual's personal social network and feedback from the wider population.
This paper describes the development of the model to incorporate heterogeneous parameters, and thus become more like a real social system. The sensitivity of the model is investigated and it is shown that heterogeneity matters. This has important implications for the inclusion of real-world data into this type of model.
Keywords: Social networks, Energy efficiency, Diffusion of innovations, Data-driven
1. INTRODUCTION
There has been much interest in applying complex-systems thinking to real-world problems and recently there have been examples of the application of complexity science techniques to understanding and addressing energy challenges1.
In this paper we describe some results from a project in which the aim was to apply complexity science to enable effective decision-making on energy at the city level by developing the type of tools that a local authority could use to assess the implications of different energy-related interventions. With the UK's heavily urban population, cities have a major impact on energy sustainability. Indeed, cities are responsible for around two-thirds of global CO2 emissions2 and in the UK over 30%, of final energy is consumed in the domestic
sector3. Local authorities hold significant indirect influence over the provision and use of energy in cities, and are in a position to influence residents and businesses to reduce energy demand through the services they deliver and their role as social landlords, community leaders and major employers (in addition to their regulatory and strategic functions)4. Decision-making tools are therefore needed to support local authorities in achieving their potential contribution to national and international energy and climate change targets. These tools may also be helpful in supporting local authorities to save money on initiatives by delivering energy programmes more efficiently, an important benefit at time when they are severely resource constrained5.
The problem of how to quantify and integrate real-world data into mathematical and simulation models needs to be addressed for them to be seen as reliable, and to encourage take-up and use as tools by strategic planners. The aim of the current work is to assess the dependence of one potential simulation method on available data. This is done by running our model of diffusion of energy innovations and looking at how the results change as the parameters of the model are varied, and, therefore, which parameters strongly affect the model. These model parameters relate to real-world factors which could be either quantified using available data, where it is shown to be necessary, or otherwise given approximate values based on qualitative data which lead to meaningful results. Additionally, the sensitivity of the model outcomes to various parameters can be used to guide which are the most effective targets for network interventions in the real world, and what additional data need to be gathered.
preferences alone). Models based on individual behaviour tend to assume rational choice or reflect psychological motivations8, whereas approaches that address the social context of decision-making tend to be more qualitative9, and there is a clear need for approaches that integrate the two concepts.
Both the individual preferences and the social-network influences are important factors in the adoption of energy innovations, and local authorities have the means to potentially harness these influences to their advantage in encouraging increased adoption. Since average uptake of an innovation emerges as a result of adoption behaviour of individuals connected on a social network, in order for us to investigate potentially successful interventions, a complex-systems perspective is needed.
Recent developments in complexity science allow study of the effect of social influences on the diffusion of new innovations10, as well as the importance of network structure and the role played by the overlapping communities to which people belong11. Valente12 describes the term “network interventions” as ‘the process of using social network data to accelerate behaviour change’ and highlights the need for research to compare different network interventions.
We reported on the development of a multi-parameter dynamical model of innovation diffusion on a social network in a recent paper13. In this previous work the model was restricted to a set of homogeneous nodes (representing households) with uniform parameters, in order to derive some analytical insight into the underlying behaviour of the system. This provided a great deal of theoretical understanding of the model, but these simplifications made the model less representative of the real world. In order to make the model useful for informing specific decision-making, in this paper we discuss the process for developing this model further by making the nodes represent heterogeneous households and integrating real-world data. Our aim is to enhance and assess the usefulness of these types of models in understanding adoption of energy innovations and identifying interventions that could lead to their increased uptake. In subsequent work we have investigated this idea in more detail and present the development of the model for use to investigate different interventions a local government agency could take to try to increase uptake of energy-technologies in the domestic sector14. This paper therefore aims to bridge the gap between the work of mathematicians in modelling homogenous networks and the work of social scientists in understanding the role of social networks in the diffusion of innovations.
2. THEORETICAL CONTEXT AND OBJECTIVES
only a single contact for a transmission to occur from one individual to another. However, for a consumer product (or behaviour) to spread, empirical studies show that many people wait for a proportion of their social group to precede them in the process16. Threshold models have been developed to account for this phenomenon17,18.
There have been some recent developments in understanding and modelling network influences on the diffusion of energy innovations. Multi-parameter models similar in principle to this work have previously been investigated, such as the model of Choi, Kim and Lee15, who numerically investigated individual realisations on a model balancing intrinsic value with network influences. A three-parameter model that includes influence from the wider population (as well as peer-group) was simulated by Lee, Lee and Lee19, who investigated complementary effects of competing products. The effect of feedback from the wider network and external drivers were considered in addition to the feed-back from other nodes by Basset et al20. A closely related model to ours was developed by Tran21, using the same three influence factors as the ones we describe below, using an agent-based model (ABM) to simulate and investigate competing technologies. It was found in these investigations that network influence can play an important role in accelerating energy-innovation diffusion. Our approach differs from an agent-based model in that the rules governing a transition from a non-adopter to an adopter are deterministic and equation-based, rather than defined by a probability, but our model could be easily adapted to run in this way.
The objectives of this paper are twofold:
1. To present a method for modelling diffusion of energy-efficiency innovations on a social network of heterogeneous households;
2. To describe the systematic approach to integration and use of empirical data in this type of social simulation and identify the gaps where more data are required.
In the next section we outline our approach to the model development. We then present the systematic integration of empirical data. We conclude with comments on the methodology developed so far and its suitability in addressing the original aim, as well as areas for further research.
3. APPROACH
For a full description of the basic model that this work builds on see McCullen et al.13, which also includes a description of some of the features exhibited by the simulation results and mathematical analysis of the model. We include brief details of the main approaches and basis for the model here.
The model represents individual households as nodes on a complex network, each with a binary variable representing their current state, xi = (0, 1), for non-adopters or adopters,
The basic idea behind the model is that a household will decide to adopt the energy innovation if the perceived usefulness or utility exceeds a threshold (which encompasses their ability to adopt). The total perceived utility of an innovation (either technological or behavioural) can be attributed to a number of factors; for this model we divide these broadly into personal and social benefit10. Personal benefit pi is a measure of the perceived practical
use of implementing the innovation to the ith household. The total social benefit is the utility derived from agreeing with peer groups and mainstream social norms. The social benefit can thus be divided into two parts: the influence from an individual's personal peer-group network and the influence from society in general (the total larger population in the network; that is, the social norm)22.
The total utility therefore has three factors: personal benefit, social benefit from the peer-group of one's network neighbour connections and a benefit derived from following the wider population. In the work of Tran21, this third factor was derived from the interaction with a subset of the whole population, representing an individual's wider contact network, whereas we look at the influence of the whole population (for example from both the wider contact network and via the media as a reflection of the mainstream social norm).
In the model we have developed we assign these three factors to each household with the relative weightings i, i and i (with i + i + i = 1), to account for different behavioural
archetypes. The parameter i is the weighting given to the personal benefit of adoption to the
individual pi, i is the weighting given to the average value of xi within the individual's social
network neighbourhood si, and i is the weighting given to m, the average of x over the entire
population.
The total utility is therefore given by:
ui = ipi + isi + im, (1)
where si is the mean average of x over the ki neighbours of individual i and m is the mean
value of x for the whole system.
Adoption at each time-step occurs if perceived total utility to the household outweighs the barriers to adoption, the threshold:
ui > i. (2)
3.1 Modelling the Social Network
The individual nodes (here representing households) interact with others in their peer group (their network neighbours) via a fixed set of connections, or edges, on the network. Several common models of network topology were investigated in our previous work13, including
random 23 and small-world 24 models. The most important factors influencing take-up by
households in the network were found to be the node degree, i.e. the number of connections belonging to each node, and the clustering coefficient (or transitivity) i.e. the proportion of second-degree neighbours who are also directly linked (the so called “friend-of-a-friend is a friend” effect).
Whilst the total number of contacts may vary greatly between individuals, it is clear that most individuals maintain a relatively small number of close associations who influence adoption decisions more strongly than the whole peer-network 25. In the real world, social interactions often occur via communities, which can be either social groups or workplaces, where individuals meet each other and form connections with a limited number of other members. A model containing these features is the random-clustered network model of Newman26. In these models the degree of clustering can be varied in a natural way by linking individuals via their mutual association with groups. The following work uses this type of model for the structure of the social network, assigning N nodes each to a number Gi of groups out of a total
of W. This number Gi can be either homogeneous, such as each node being associated with G
Figure 1. Network features: A simple network consisting of N=12 nodes and W=2 groups (circled). Node i has L = 3 links for each type of association, giving connections assigned both individually (to nodes I1, I2 and I3) and via the two groups that of which it is a member (to B1, B2 and B3 in the ‘blue’ group and D1, D2 and D3 in the ‘green’ group). Groups have a higher level of common connections between members than to the rest of the network and, therefore, higher clustering.
In this work we wish to systematically investigate the parameter space of the model and the effect that including real, heterogeneous data could have on the expected level of uptake of an energy innovation. We have applied this to a case study for the city of Leeds, but this could easily have been applied to other geographic areas, and also for other types of innovation.
4. SIMULATION AND EVALUATION
A major aspect of our research is determining whether the insights and tools of complexity science can be useful for understanding energy interventions at the city level. It is, therefore, useful to understand the degree of complexity to which we need to represent the system in our models, and the degree of accuracy that is required for the model parameters. To do this we have systematically investigated the influence of the network structure, the threshold parameter and the archetypes (weightings for and). Determining the degree to which a correct representation of the statistical properties of the model parameters is critical to the outcome of any intervention will give us an understanding of the data requirements needed to produce useful simulations.
We indicate where empirical data from the survey has been used in the model in the details covered in the next section regarding the systematic analysis of the parameter space. Table 1 shows an overview of this.
Table 1 – Data sources used to parameterise the model.
Parameters Data source (if used)
Network structure N, G, M | W, L Survey | Assumption
Individual connections I | L Survey | Assumption
Group connections G | L Survey | Assumption
Archetypes Ai=(iiandi), P(Ai) Simulation
Threshold P() Survey | Assumption
The model was written in the multi-platform, open-source Python programming language, using freely available modules NetworkX for the construction of the networks and Scientific
Python (SciPy) for the dynamical time-stepping. Plotting was done using Gnuplot. Codes and
compiled versions of the model are available at https://sourceforge.net/projects/netdifmodel/.
For the following investigations we want to understand the isolated effect of varying one of the network or parameters of the dynamical model, by keeping all other factors fixed. In all cases the personal utility p is set to 0.5 and the initial seed proportion m0 is set to 5% of
nodes. We define an archetype, Aj, in the model to be a specific set of (j, j, j) parameter
values which describe the decision-making behaviour of a subset of individual nodes in relation to the adoption of a particular innovation. In the simplest manifestation of the model we use a homogeneous population, by setting all nodes to be of the same archetype. This was done in our previous work13 to enable us to derive analytical expressions to explain the observed simulation results. Here, the results allow us to observe the individual responses of the different archetypes and guide us in choosing which archetypes to use in more realistic versions of the model simulations. At each set of (j, j, j) archetype values we perform 20
individual realisations of the system, simulating the uptake of the innovation on the network from a different initial seed, with the same model and network parameters but different precise details, such as individual links.
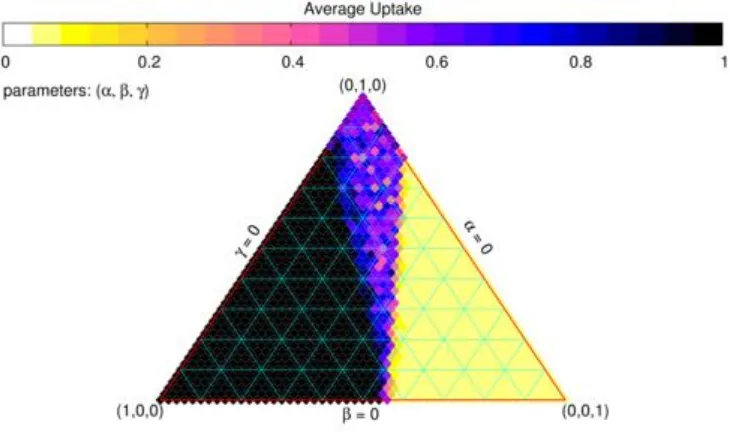
The results for the simplest case are shown in Figure 2, with colours plotted to represent the mean average uptake of the population after a fixed number of time-steps, which is here 36, after which time the uptake level settles to a constant value. This shows the same behaviour as that seen and analysed in detail in McCullen et al.13, which can be summarised as follows. The parameter space can be seen to be divided into distinct regions, each with different expected values for the likelihood of success. When the weighting to personal preference, , is large and the other parameters small (bottom left corner) then universal uptake is a certainty, as personal utility p is greater than the threshold in this case). Close to
Figure 2. Systematic study of the archetype parameter space for the simplest version of the basic model described in McCullen et al.13. Each point on the plot is for a unique set of () parameter values, which are homogeneous across the network with every node taking the same values. The colours show the average number of adopters after 36 time-steps over an ensemble of 20 realisations of the model, each time randomising the identities of the initial seed-nodes and who is connected to whom in the network, whilst keeping the numerical values of all parameters the same. Other model parameters are fixed to = 0.25, N
= 756, W = 20, G = 2, L=5.
4.1 Variation of Network Connections
We can firstly test the effect of making the model more representative of the real world by connecting each node to others via a different number of groups Gi, rather than all nodes
having the same value of G, and including individual connections. This has the effect of changing the structure of the network so that nodes have variation in their degrees and the clustering is more irregular across the network. The group association number Gi can be
picked from a distribution or based on empirical data. For the results shown in Figure 3 connections were assigned based on the results of our survey, in which we asked people if they communicate about energy issues with others in their social and work groups as well as individual friends and family. These data were used to assign links to nodes based on these
active group and individual contacts (i.e. those contacts they indicated they currently talk to
[image:11.595.116.481.88.310.2]reported number of groups. Workplace links were assigned if the respondent was employed and reported talking to colleagues about energy. From 1068 responses it was found that 756 households reported talking about energy-related issues to at least one other individual household, group (local) or workplace (long distance).
It can be seen that changing the network structure in this way shifts the critical line in parameter space, the reasons for which can be understood using the insights from our previous work. That is, the critical parameters are the node degrees and the clustering coefficient. Since these factors are difficult to ascertain from data for interpersonal social networks (on the city scale, at least) we must conclude that simulation models such as these have the potential to be very useful for comparing the relative effectiveness of different interventions as opposed to making precise predictions on individual outcomes. The situation may be easier for online social networks, or smaller bounded communities since data is more readily available or easily gathered in such cases.
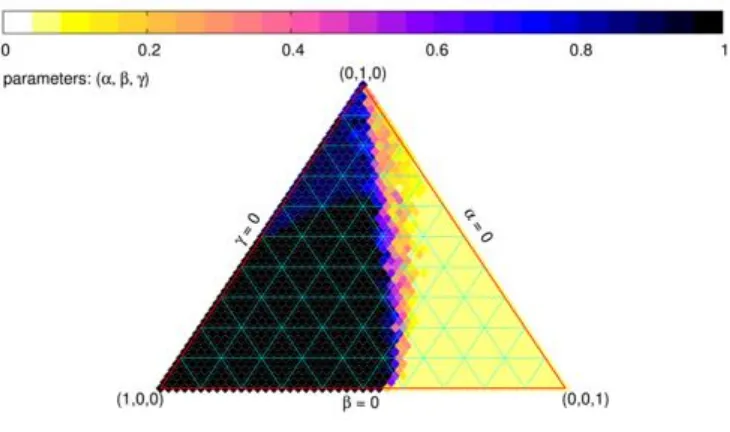
Figure 3. Nodes are associated each to Gigroups based on survey data rather than every node
to two, as was the case in Figure 2. Other than this variation, which alters network features such as the node degrees and clustering coefficient (transitivity), all parameters are identical to the previous case. For non-work groups the proportions of nodes communicating energy information via association to 0, 1, 2, 3 groups are 89%, 5%, 4% and 2% respectively, with 37% of nodes additionally assigned individual connections. 45% of nodes also have an active work group. A group connection give a node 5 extra connections to other individual nodes. The critical line is seen to shift with this variation in the network structure, as compared to the previous case (Figure 2) of homogeneous associations.
4.2 Distribution of thresholds
In the real world, individuals and households do not have the same thresholds to adoption of innovations. Therefore, it is natural to consider the effect of introducing a variation in the thresholds assigned to nodes in the network model (c.f. Bassett et al.20). For this we can assign two or more discrete thresholds or even a continuous distribution. While it can be difficult to quantify the precise levels of the perceived and real barriers to adoption from surveys, data can help to provide information on the proportions of individuals with different banded threshold levels. First, we introduce two distinct thresholds, 1 and 2, and study the
Figure 4 Different choices of two thresholds for a homogeneous archetype A=(0.1, 0.8, 0.1), colours show the mean uptake after 36 time-steps at each choice. All model parameters are as for the results in Figure 2.
(a)
[image:15.595.83.488.70.634.2](b)
Figure 5 Different values of two thresholds, each assigned to half the nodes. (a) 1= 0.45,
To explore the question of whether heterogeneity in the threshold parameter matters to the overall system we compare the case where every node in the network takes the same value as the average of the two thresholds in Figures 5 (a) and (b). For the results shown in Figure 6 (a) and (b) we therefore uniformly raise the threshold across the population to = 0.35 and
= 0.5, respectively.
(a)
[image:16.595.75.489.187.690.2](b)
As can be seen from the results in Figure 6 (a) and (b) the results are not the same as in the case of distributed thresholds (Figure 5). Comparing Figure 5b with Figure 6b reveals a dramatically different result even though the average of the population thresholds in 0.5 in each case. In Figure 6b uniformity of the threshold parameter means not many new adopters are seen as there is a too low probability for "social contagion"13. Where there is an inhomogeneous mix of thresholds with the same average, as in Figure 5b, the low threshold agents can "kick-start" the process by being over the threshold first, raising the peer-average of some of the higher threshold individuals and resulting in a higher uptake than a homogeneous mid-range threshold. This is contrary to the expectation that the very high threshold (= 0.9) would be balanced by the low (= 0.1) and act similar to the average. This can be interpreted as an emergent property of the complex mix of heterogeneous thresholds rather than an averaged behaviour of the individual elements. In short, in a complex system of this type, where the elements are coupled, the exact heterogeneity of the elements matters to the emergent outcome at the system level.
Further choices can be made for the number, values and populations of different thresholds. Several of these are illustrated in the results in the following two figures (7 and 8). In many studies, including our own, a population is divided into three levels with respect to barriers to adoption; low, medium and high. These can depend on a number of factors, but estimates of the number of individuals in each can be made from the responses to survey questions. The survey was used in such a way to divide the population into three. The percentage of households (nodes) assigned to each category are based on household income, house type and tenancy. Those living in flats, halls of residence, or in shared or rented accommodation are deemed unable to adopt, as they will typically not be able to change the physical fixtures and fittings. The banding of high, mid and low then corresponds to the household’s income level14.
(a)
(b)
Figure 7 Thresholds distributed over three values. (a) 28% of 1 = 0.25, 17% of = 0.45,
5% of = 0.75, 50% of = 1; (b) 28% of = 0.25, 67% of = 0.45, 5% of = 0.75.
[image:18.595.84.494.90.580.2]Figure 8 All nodes take different threshold values randomly from a uniform distribution, across the range [0:1].
4.3 Introducing Different Archetypes
The next aspect to evaluate in making the model more realistic is to remove the restriction on the homogeneity of the archetypes. To do this we divide the population into a number of different groups with distinct archetypes, randomly assigning a certain proportion of nodes to each. In the real-world it is known that people fall into categories such as “innovator”, “majority” or “laggard” (Rogers, 1983) depending on their propensity to favour adoption of an innovation based on its individual merits, the fashion amongst ones peers or the prevalence in society as a whole, respectively. These types of behaviour can be seen in our previous results (as explained in McCullen et al.13), with certain sets of parameter values being more or less likely to adopt than others. To keep the parameter space manageable, as well as making the results easier to visualise and interpret, we restrict ourselves to three separate archetypes in each case, varying the relative proportions (P(A1), P(A2), P(A3))
assigned to each of the three archetypes (A1=(1, 1, 1,), A2=(2, 2, 2,), A3=(3, 3, 3,)) and
[image:19.595.115.479.89.303.2]a)
(c)
(d)
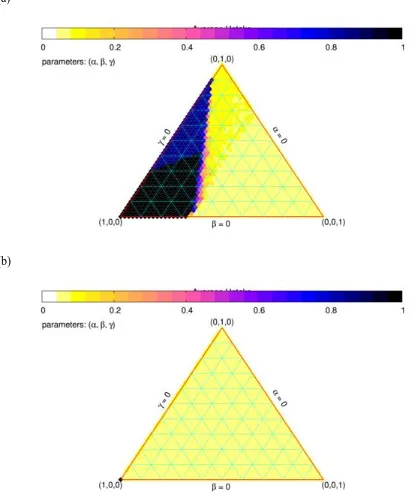
Figure 9. The population is divided into three archetypes and individual nodes are each
assigned to an archetype Aj=(jjj). Each point on the plot is for a different set of relative
proportions of the three archetypes in the population (P(A1), P(A2), P(A3)), and individuals are
assigned according to this distribution. All other parameters are identical to previous cases. (a) Extreme values for the archetypes of [A1=(1, 0, 0), A2=(0, 1, 0), A3=(0, 0, 1)] in order to
[image:21.595.84.487.87.595.2]extreme [A1=(0.25, 0.7, 0.05), A2=(0.1, 0.8, 0.1), A3=(0.05, 0.6, 35)], and guided by
simulations on homogeneous populations (e.g. Figure 2). (c) Here the thresholds are distributed, with the same values as used for Figure 7a, and archetypes guided by the results therein, i.e. thresholds = (1, 0.75, 0.45, 0.25) with proportions (0.5, 0.05, 0.17, 0.28), and archetypes (A1=(0.5, 0.45, 0.05), A2=(0.25, 0.65, 0.1), A3=(0.1, 0.7, 0.2)) with proportions of
each being the location of data in this plot. In (d) the = 1 threshold is lowered to = 0.45, as for the results in Figure 7b.
The results in (a), with homogeneous thresholds, shows a similar split between regions of success and otherwise, with a fairly distinct dividing line. However, these will depend on the exact choice of archetypes and other model parameters. For the more realistic case of distributed thresholds shown in (b) the behaviour changes completely. Here the picture is much simplified, showing much lower sensitivity to the proportions of archetypes for the model.However, when the inaccessible subset of nodes (= 1) have their thresholds lowered to allow them to adopt, the critical behaviour is again apparent. This again shows the importance of the threshold distributions used in the model.
5. DISCUSSION
The structure of the network is important to the dynamical processes on it, and in this specific application of innovation diffusion the clustering (transitivity) is particularly so. Through our survey work we have gathered some information on the active network connections (those participants who indicated they do talk to about energy-related issues), both individual and group, which has certainly helped give a representational structure of a real-world network for the influence of energy information on which to base out models.
We have demonstrated the importance of the parameters for the threshold () and the split of archetypes. However, we are currently limited in applying the model as a full decision-support tool for local authorities by the availability of appropriate data, although as we have shown elsewhere14 our dynamical network approach could be used as the conceptual basis of a decision-support tool for local authority interventions in domestic energy demand reduction.
, or (as discussed earlier). Additional data on the barriers to adoption for specific energy innovations is warranted. While we have focussed mainly on quantitative data, as that is most useful from a modelling perspective, in addition, in order to fully understand some of the issues that are listed in Table 2 a qualitative approach might be more appropriate. In particular understanding/awareness of the technology would warrant qualitative exploration. Similarly, qualitative data might also provide a useful insight into the respondents’ perceptions of ‘personal benefit’.
Table 2 — Specific data requirements for further model development.
Model parameter Data needed Comments
Threshold ( Segmentation of households’ barriers to specific energy technologies. Linked to physical and economic barriers to adoption e.g. house type, tenancy, cost. May potentially include understanding/awareness of the technology.
This would be different for different technologies e.g. solar panels cannot be adopted if the household does not have a south-facing roof.
Personal benefit (p) Likely economic and personal benefit to adopting a technology
This would not solely include cost savings, but could also include thermal comfort or fit with pro-environmental lifestyle choices.
Archetypes (groups with different weightings)
Segmentation of households’ weightings for personal, personal social influence and social norms.
This does not need to be technology specific.
Social Network properties Average node degree, transitivity and link weightings for connections specific to energy technologies.
This may also be different for different technologies e.g. solar panels are more visible than loft insulation.
There are potentially many modifications and enhancements that could be made to the model developed so far, which support the assumption that there is potential value in these methods as a basis of decision-support tools. An example of an enhancement is given. In the current model, network connections are all equally weighted. In the survey, we gathered information on levels of trust regarding energy information that people placed in different groups of people (e.g. friends, family, work colleagues etc.). This information could be used to weight different network connections, i.e. introducing a measure of each connection’s ability to influence.
Aside from further developments, experimental methods for validating the model would be invaluable and network interventions need to be tested in either restricted laboratory or real-world settings. As noted by Valente12, the options for network interventions have been dramatically enhanced by electronic communications and online social networks. While there are some questions as to whether electronic network interventions are as effective as face-to-face 27, the online networks could provide an easier means of setting up and monitoring a network intervention as well as providing the data on the initial (and developing) network structure. An online experiment, for example, implementing a scheme for users to recommend a friend to receive a voucher offer for an energy-efficient technology could be monitored and associated data on the participants gathered. This would provide a controlled environment with a bounded network of participants to be studied and would provide a valuable means of validating theoretical models.
6. CONCLUSION
In this work we have developed a model for exploring the parameter space to investigate what factors are important in the diffusion of innovations on a real-world social network. We extended the previous implementation of our basic dynamical network model, which represented households as homogeneous nodes, to integrate empirical data (gathered via a city-wide survey) into the models in order to express a heterogeneous population which more closely represents a real social system. In applying a systematic approach we have examined the relative effect that different parameters have on the behaviour of the system. This development exhibits a significant advance over previous models which contain a homogeneous population of nodes on a network. The method presented enables investigation of the relative significance of personal preferences versus social influence, both from the peer-group and wider population networks.
This methodology has been developed further and used for exploring different network interventions that could be implemented by a local authority for enhancing uptake of energy-technologies, and identifying those that would be more likely to lead to an increased uptake14. In addition, with relevant modifications based on empirical data this model could also be used to investigate diffusion of a variety of energy-efficient behaviours that may have different properties in terms of the associated level of personal preference and social influence. For example, it is plausible that solar panels are associated with a higher degree of social influence compared with loft insulation, as they are visible on the property.
We have highlighted the need for new data to understand (both in a quantitative and qualitative way) householder barriers and drivers to adoption of energy-efficient innovations. However, the models developed to date provide a useful means of drawing insights into the factors affecting the emergent behaviour of a social system. This, in itself, provides a constructive starting point for designing effective interventions to increase uptake of energy-efficient innovation in cities and supporting efforts to mitigate climate change. As observed by Valente12 ‘the science of how networks can be used to accelerate behaviour change ...is still in its infancy’. Nonetheless, the benefits to adopting network interventions are becoming clearer and this is certainly an area where further research is warranted.
Acknowledgements
The authors would like to thank the Engineering and Physical Sciences Research Council for supporting this work under grant EP/G059780/1 ‘Future Energy Decision-Making for Cities
— Can Complexity Science Rise to the Challenge?’. We would like to thank colleagues Tao
References
1. UKERC The Meeting Place. Energy and Complexity – The Way Forward (Workshop Report); UKERC: Oxford, 2012.
2. International Energy Agency. World Energy Outlook; OECD/IEA: Paris, 2008.
3. Department of Energy and Climate Change. Energy consumption in the UK: London, 2013.
4. Committee on Climate Change. How local authorities can reduce emissions and manage climate risk London, 2012.
5. Bale, C. S. E.; Foxon, T. J.; Hannon, M. J.; Gale, W. F. Strategic energy planning within local authorities in the UK: A study of the city of Leeds. Energy Policy 2012, 48, 242-251.
6. Cheng, V.; Steemers, K. Modelling domestic energy consumption at district scale: A tool to support national and local energy policies. Environmental Modelling & Software 2011, 26, 1186-1198.
7. Clinch, J. P.; Healy, J. D. Cost-benefit analysis of domestic energy efficiency. Energy Policy 2001, 29, 113–124.
8. Nye, M.; Whitmarsh, L.; Foxon, T. Sociopsychological perspectives on the active roles of domestic actors in transition to a lower carbon electricity economy. Environment and Planning A 2010, 42, 697-714.
9. Shove, E. Gaps, barriers and conceptual chasms: theories of technology transfer and energy in buildings. Energy Policy 1998, 26, 1105-1112.
10. Delre, S. A.; Jager, W.; Bijmolt, T. H. A.; Janssen, M. A. Will It Spread or Not? The Effects of Social Influences and Network Topology on Innovation Diffusion. Journal of Product Innovation Management 2010, 27, 267-282.
11. Palla, G.; Derenyi, I.; Farkas, I.; Vicsek, T. Uncovering the overlapping community structure of complex networks in nature and society. Nature 2005, 435, 814-818.
12. Valente, T. W. Network Interventions. Science 2012, 337, 49-53.
14. Bale, C. S. E.; McCullen, N. J.; Foxon, T. J.; Rucklidge, A. M.; Gale, W. F. Harnessing social networks for promoting adoption of energy technologies in the domestic sector. Energy Policy 2013, Submitted for review.
15. Choi, H.; Kim, S.-H.; Lee, J. Role of network structure and network effects in diffusion of innovations. Industrial Marketing Management 2010, 39, 170-177.
16. Granovetter, M.; Soong, R. Threshold models of diffusion and collective behavior. The Journal of Mathematical Sociology 1983, 9, 165-179.
17. Grönlund, A.; Holme, P. A network-based threshold model for the spreading of fads in society and markets. Advances in Complex Systems 2005, 08, 261-273.
18. Watts, D. J. A simple model of global cascades on random networks. Proceedings of the National Academy of Sciences 2002, 99, 5766-5771.
19. Lee, E.; Lee, J.; Lee, J. Reconsideration of the Winner-Take-All Hypothesis: Complex Networks and Local Bias. Management Science 2006, 52, 1838-1848.
20. Bassett, D. S.; Alderson, D. L.; Carlson, J. M. Collective decision dynamics in the presence of external drivers. Physical Review E 2012, 86, 036105.
21. Tran, M. Agent-behaviour and network influence on energy innovation diffusion. Communications in Nonlinear Science and Numerical Simulation 2012, 17, 3682-3695.
22. Valente, T. W. Social network thresholds in the diffusion of innovations. Social Networks 1996, 18, 69-89.
23. Erdos, P.; Renyi, A. On the evolution of random graphs. Publ. Math. Inst. Hung. Acad. Sci 1960, 5, 17-61.
24. Watts, D. J.; Strogatz, S. H. Collective dynamics of 'small-world' networks. Nature 1998, 393, 440–442.
25. Weenig, M. W.; Midden, C. J. Communication network influences on information diffusion and persuasion. Journal of Personality and Social Psychology 1991, 61.
26. Newman, M. E. J. Properties of highly clustered networks. Physical Review E 2003, 68, 026121.


![Figure 8 All nodes take different threshold values randomly from a uniform distribution, across the range [0:1]](https://thumb-us.123doks.com/thumbv2/123dok_us/7923227.192114/19.595.115.479.89.303/figure-nodes-different-threshold-values-randomly-uniform-distribution.webp)


