This content has been downloaded from IOPscience. Please scroll down to see the full text.
Download details:
IP Address: 129.11.132.214
This content was downloaded on 18/06/2014 at 11:09
Please note that terms and conditions apply.
EELS from organic crystalline materials
View the table of contents for this issue, or go to the journal homepage for more 2014 J. Phys.: Conf. Ser. 522 012060
(http://iopscience.iop.org/1742-6596/522/1/012060)
EELS from organic crystalline materials
R Brydson1, M D Eddleston2, W Jones2, C R Seabourne1 and N. Hondow1
1 Institute for Materials Research, SPEME, University of Leeds, Leeds, LS2 9JT, UK 2 Department of Chemistry, University of Cambridge, Lensfield Road, Cambridge, CB2 1EW, UK
E-mail: [email protected]
Abstract. We report the use of the electron energy loss spectroscopy (EELS) for providing light element chemical composition information from organic, crystalline pharmaceutical materials including theophylline and paracetamol and discuss how this type of data can complement transmission electron microscopy (TEM) imaging and electron diffraction when investigating polymorphism. We also discuss the potential for the extraction of bonding information using electron loss near-edge structure (ELNES).
1. Introduction
Polymorphism is the ability of a compound to crystallise with different packing arrangements and is critically important in several industrial sectors as many of the solid-state properties of a compound are dependent on the crystal form. For example, in the pharmaceutical industry it is a requirement that the polymorphic behaviour of a drug compound is thoroughly investigated and understood as different crystal phases dissolve at different rates affecting the adsorption of the compound in vivo, making it essential to control which crystal form is dosed to patients.
Recently, TEM has been applied to the study of polymorphism in organic materials such as pharmaceuticals and has been shown to have advantages over more routinely used analytical techniques [1, 2]. Using a combination of imaging and diffraction each of the crystals in a sample can be analysed one-by-one during TEM analysis and different polymorphs of a compound can be distinguished, or new polymorphs of a compound identified, on the basis of crystal morphology and/or by indexing electron diffraction patterns. A further advantage is the ability to solve crystal structures of beam sensitive organic compounds using a single crystallite with sub-micron sized dimensions, by combining electron diffraction and crystal structure prediction, where standard single crystal or powder X-ray approaches would not be applicable. For example, a new polymorph of the pharmaceutical compound theophylline has been identified from analysis of a single crystallite having an estimated mass of 3 pg, despite this phase being present as a minor component in a mixture of crystal forms [3]. Here we investigate the potential use of EELS to provide additional chemical and structural information from single crystalline particles of organic material.
2. Experimental
substituted with two phenyl groups. Paracetamol (or acetaminophen) (C8H9NO2) is a mild analgesic. These organic crystals are classified as molecular crystals where the molecules retain their character and pack and interact via weak van der Waals and hydrogen bonds. Preparation of thin organic crystals for TEM is a significant issue; para-terphenyl crystals were prepared by evaporation from an organic solvent at the interface with water, paracetamol crystals were prepared by crystallisation from the melt, theophylline crystals were prepared by cooling a saturated solution in nitromethane, and the 1:1 caffeine:theophylline co-crystal was prepared by ball milling.
Samples were dispersed and drop cast onto holey carbon coated TEM grids and analysed in a FEI CM200 field emission TEM/STEM operated at 200 kV equipped with a Gatan GIF200 Electron Energy Loss Imaging Filter and an Oxford instruments energy dispersive X-ray (EDX) detector for elemental analysis. An extraction voltage of 3.25 kV, spot size 6 and a magnification of 5000 times were employed. The value of probe current was estimated using an FEI calibration curve based on the measured brightness (i.e. exposure time) incident on the viewing screen – this was independently checked by measuring the current incident on the drift tube of the GIF. For measurement, the beam was typically spread over a circular area of > 20 micron radius giving an electron fluence rate of ca. 4 x 10⁻⁵ A/cm2 and a total electron fluence during spectral acquisition of typically 1500-2000 electrons/nm2. All electron energy loss (EELS) spectra were collected in diffraction mode from crystalline areas of ca. 0.8 micron diameter. Low loss EELS spectra were collected with a collection semi-angle of 6 mrads (typically 0.1 second acquisition time) and core loss spectra with a collection semi-angle of 30 mrads (typically 20 second acquisition time). Beam damage (presumed to be by a radiolytic mechanism) was monitored by observation of the diffraction pattern; typical lifetimes of crystals were of the order of minutes. Interestingly, progressive amorphisation by the electron beam proceeded via progressive loss of short range order (fading of the outer diffraction spots first) as observed by Glaeser [4] possibly due to breaking of hydrogen bonds and small molecular rearrangements during the initial stages of damage.
3. Results
3.1. EELS Low loss spectra
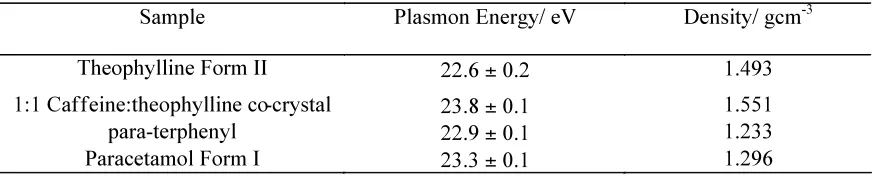
[image:3.595.72.508.631.719.2]Small variations were apparent between EELS plasmon peak energies for the different organic crystals (see Table 1). The most noticeable difference was between theophylline Form II and the 1:1 caffeine:theophylline co-crystal where an increase in energy of over 1 eV was consistently measured. This would correlate with an increase in physical density between the two crystals and hence, as the two molecules are chemically similar, an increase in valence electron density (N) which is known to influence the plasmon energy as √N. A further effect in the low loss was the tentative observation of intensity in the region between 6-8 eV which would be associated with π to π∗ transitions or a π plasmon in the conjugated systems such as para-terphenyl and paracetamol (figure 1).
Table 1. Plasmon peak energies (average and standard deviation of three measurements) compared to physical density derived from single crystal X-ray structure determination.
Electron Microscopy and Analysis Group Conference 2013 (EMAG2013) IOP Publishing Journal of Physics: Conference Series522(2014) 012060 doi:10.1088/1742-6596/522/1/012060
3.2. EELS Core loss spectra
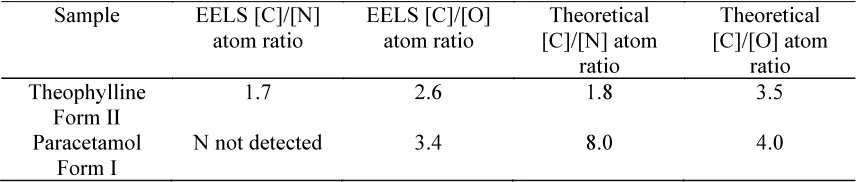
[image:4.595.85.515.316.407.2]In principle EELS is ideal to quantify light elements in organic crystals such as C, N and O. However at the low electron fluences required to prevent irradiation damage, core loss spectra suffered from low signal to noise ratios (SNR) due to dominance of detector readout noise and dark current over the inherent statistical noise in the data (see figure 2). Despite this current limitation, it was possible to derive some elemental ratios which are listed in Table 2. Here the values are averages of three measurements and we estimate the accuracy of the ratios to be at best 20%. The core loss EELS spectrum of theophylline is shown in figure 2 and shows the presence of carbon, nitrogen and oxygen with a derived [C]/[N] atom ratio close to the expected value but provides an overestimate of the level of oxygen. Data for paracetamol showed the presence of carbon and oxygen in the sample in reasonable agreement with the expected value, however no nitrogen K-edge was observed above the baseline noise owing to the relatively low levels present.
Table 2. Values of the measured and theoretical carbon to nitrogen and carbon to oxygen atom ratios. Values determined using a 30 eV integration window and Hartree-Slater cross-sections.
With such low SNR, the core loss edge shape (ELNES) was difficult to extract reliably. However there were indications that the C K-ELNES was different between Theophylline and para-terphenyl consistent with the presence of conjugated π bonding in the latter. As an indication of the potential of ELNES measurements to differentiate between organic crystal polymorphs, figure 3 shows calculations using the CASTEP density functional theory (DFT) code of the predicted N K-ELNES for two polymorphs of para-aminobenzoic acid C7H7NO2 [5 - 6]. These calculations were carried out using appropriately converged cell sizes and calculation parameters, using 0.5 electron core-holes for the α and β polymorphs, with an energy-dependent final state lifetime broadening applied [7-10]. The calculations show clear differences in the main peak some 10 eV above the edge onset which is split in the α phase but not in the β polymorph.
4. Future strategies for EELS measurements
A major problem remains that, at the low electron fluences required to prevent irradiation damage in these samples, core loss spectra suffered from low signal to noise ratios (SNR) due to dominance of detector readout noise and dark current over the inherent statistical noise in the data. We outline strategies to improve EELS analysis of organic crystals which include: (1) cooling the sample to allow, in principle, higher electron fluences and fluence rates to be used so as to improve spectral SNR; (2) optimisation of the SNR induced by the CCD detector via reduction of the number of detector pixels used in the non-energy dispersive direction on the CCD, as well as the use of new fast readout, low noise detectors; (3) the use of thinner crystals for analysis and (4) the use of a scanned beam as in STEM.
Assuming that EELS can be optimised further to give reliable quantitative information about chemical composition it would be useful when studying polymorphism by TEM. For example, when analysing a sample of a given compound by TEM, if a crystal giving diffraction patterns that do not index to a known crystal form of this compound (or with an unexpected crystal habit) was observed, EELS analysis would help in determining if this crystal was a new polymorph of the compound or a
chemical impurity. Also, when performing electron diffraction analysis on samples containing several different compounds, such as a drug formulation, EELS analysis would be important for determining which of the compounds was being analysed when diffraction patterns were recorded, making the process of indexing the diffraction patterns to a particular crystal form significantly easier.
References
[1] Li Z Get al. 2002 Microsc. Microanal.8, 134 [2] Eddleston M D et al. 2010 J. Pharm. Sci. 99, 4072 [3] Eddleston M D et al. 2013 Chem. Eur. J. 19, 7874 [4] Glaeser R M 1971 J. Ultrastructure Res. 36, 466 [5] Clark S J et al. 2005 Z. Kristallogr. 220, 567 [6] Gao, S P et al. 2008 Phys. Rev. B 77, 115122.
[7] Athimoolam S and Natarajan S 2007 Acta Cryst. C63, o283 [8] Gracin S and Fischer A 2005 Acta. Cryst. E61, o1242 [9] Stevens J S et al. 2013 PCCP in preparation
[image:5.595.72.513.176.735.2][10] Moreau P et al. 2006, Phys. Rev. B 73, 195111.
[image:5.595.73.513.329.441.2]Figure 3. Calculations of the N K-ELNES for two polymorphs of para-aminobenzoic acid using the CASTEP DFT code.
Figure 1. Low loss EELS from a crystal of paracetamol showing evidence for a π plasmon/transition below 10 eV (total acquisition time a few seconds at 4 x10⁻⁵
A/cm2).
Figure 2. EELS core loss spectra from a theophylline crystal showing the nitrogen K-edge (ca. 400 eV) and the oxygen K-edge (ca. 530 eV)
superimposed on the tail of the background subtracted carbon K-edge at ca. 285 eV (total acquisition time 20 seconds at 4 x10⁻⁵ A/cm2). Electron Microscopy and Analysis Group Conference 2013 (EMAG2013) IOP Publishing Journal of Physics: Conference Series522(2014) 012060 doi:10.1088/1742-6596/522/1/012060
[image:5.595.79.325.505.727.2]