https://doi.org/10.5194/bg-15-7141-2018 © Author(s) 2018. This work is distributed under the Creative Commons Attribution 4.0 License.
Filtration artefacts in bacterial community composition can affect
the outcome of dissolved organic matter biolability assays
Joshua F. Dean1,2,a, Jurgen R. van Hal2, A. Johannes Dolman1, Rien Aerts2, and James T. Weedon2 1Department of Earth Sciences, Vrije Universiteit Amsterdam, 1081 HV Amsterdam, the Netherlands 2Department of Ecological Sciences, Vrije Universiteit Amsterdam, 1081 HV Amsterdam, the Netherlands anow at: School of Environmental Sciences, University of Liverpool, L69 7ZT, UK
Correspondence:Joshua F. Dean ([email protected]) Received: 12 June 2018 – Discussion started: 2 July 2018
Revised: 18 October 2018 – Accepted: 16 November 2018 – Published: 30 November 2018
Abstract.Inland waters are large contributors to global car-bon dioxide (CO2) emissions, in part due to the vulnerability of dissolved organic matter (DOM) to microbial decomposi-tion and respiradecomposi-tion to CO2during transport through aquatic systems. To assess the degree of this vulnerability, aquatic DOM is often incubated in standardized biolability assays. These assays isolate the dissolved fraction of aquatic OM by size filtration prior to incubation. We test whether this size selection has an impact on the bacterial community compo-sition and the consequent dynamics of DOM degradation us-ing three different filtration strategies: 0.2 µm (filtered and inoculated), 0.7 µm (generally the most common DOM filter size) and 106 µm (unfiltered). We found that bacterial com-munity composition, based on 16S rRNA amplicon sequenc-ing, was significantly affected by the different filter sizes. At the same time, the filtration strategy also affected the DOM degradation dynamics, including the δ13C signature. How-ever, the dynamics of these two responses were decoupled, suggesting that filtration primarily influences biolability as-says through bacterial abundance and the presence of their associated predators. By the end of the 41-day incubations all treatments tended to converge on a common total DOM biolability level, with the 0.7 µm filtered incubations reach-ing this point the quickest. These results suggest that assays used to assess the total biolability of aquatic DOM should last long enough to remove filtration artefacts in the micro-bial population. Filtration strategy should also be taken into account when comparing results across biolability assays.
1 Introduction
Research showing that inland waters are significant sources of carbon dioxide (CO2) to the atmosphere (Cole et al., 2007) has led to a large increase in the number of studies that con-sider the magnitude and source of this CO2. Inland waters are estimated to release CO2equivalent to∼19 % of global an-thropogenic CO2emissions annually (Le Quéré et al., 2016; Raymond et al., 2013). One potentially important source of this CO2is dissolved organic matter (DOM), which is present in relatively high concentrations in many inland water sys-tems (e.g. Evans et al., 2014; Dean et al., 2016). The contri-bution of CO2from microbial respiration in aquatic systems is an important component of understanding the global car-bon cycle (e.g. McCallister and del Giorgio, 2012), as well as ecosystem dynamics in this important interface between the terrestrial and marine realms (Aufdenkampe et al., 2011; Guillemette et al., 2017). Biolability assays, which deter-mine the vulnerability of DOM to microbial decomposition during aquatic transport are increasingly common for deter-mining the magnitude and importance of aquatic DOM as a CO2source (Guillemette and del Giorgio, 2011; Vonk et al., 2015).
determin-ing the total biolability of an aquatic DOM sample, long-term assays tend to be more common (e.g. Spencer et al., 2015).
The DOM size class has variously been defined as the frac-tion of organic matter molecules smaller than ∼1 µm (e.g. del Giorgio and Pace, 2008), 0.7 µm (e.g. Mann et al., 2015), 0.45 µm (e.g. Drake et al., 2015) and 0.2 µm (e.g. Logue et al., 2016). The lowest size cut-off, 0.2 µm, is often assumed to be biologically sterile as no microbes are thought to be smaller than this (Gasol and Morán, 1999), although tests have shown that viable microbial communities can develop even in<0.2 µm filtrate (Hahn, 2004). Filtration to 0.7 µm, arguably the most common size cut-off (the pore size of stan-dard glass fibre filters [GF/F] used in water filtration appli-cations) would also likely exclude the majority of microbes (Ferguson et al., 1984; Gasol and Morán, 1999). Biolability assays that filter to 0.2 µm commonly include an inoculation of the incubations after filtration with in situ (or study rele-vant) unfiltered microbial communities to reduce community effects (e.g. Logue et al., 2016). However, biolability assays filtered to 0.45 and 0.7 µm are often not inoculated and it is assumed that enough bacteria will pass through the filter to decompose and respire the filtrate DOM (Vonk et al., 2015). In biolability studies, specifically in permafrost regions, the effect of filter size was shown to be insignificant (Vonk et al., 2015). However, due to the extreme size filtration this is a surprising result given that these filter sizes will exclude a large proportion of microbes, potentially causing a signifi-cant shift in the microbial community structure and therefore potentially altering the dynamics of the decomposition pro-cesses mediated by the microorganisms (Logue et al., 2016; Traving et al., 2016).
We aimed to test the significance of this potential micro-bial shift resulting from filtration by answering the follow-ing questions: (1) how do different filtration strategies affect the bacterial community composition in DOM incubations? (2) Does this influence the outcome of DOM biolability as-says? We tested these questions using an experimental set-up with three filtration treatments applied during biolability as-says of organic carbon-rich water draining a temperate peat-land in the Netherpeat-lands.
2 Methodology 2.1 Field sampling
The organic carbon-rich water for the DOM incubations was collected from a ditch draining Horstermeer peatland (52.144◦N, 5.043◦E) (Hendriks et al., 2007). The site is former agricultural land, abandoned in the mid-1990s, in a drained natural lake in the central Netherlands. The un-derlying geology is Pleistocene aeolian sands, overlain by peat and organic-rich lake deposits (Hendriks et al., 2007). Approximately 20 L of water was collected in spring 2016 (16 March), pre-filtered to 106 µm and transported to Vrije
Universiteit Amsterdam in two acid-washed plastic vessels. The samples were not refrigerated during transport, but travel time was less than 1 h and the samples were refrigerated at 4◦C immediately upon arrival at the university until filtra-tion for the incubafiltra-tions on the same day.
2.2 Incubations
The sample water was prepared for incubation with three filtration strategies: (1) 3 L of sample water was filtered to 0.2 µm (sterilized nylon membrane, Whatman), homog-enized and inoculated with 5 mL of sample water filtered to 106 µm (henceforth P2 treatment). (2) 3 L of sample wa-ter filwa-tered to 0.7 µm (pre-ashed glass fibre filwa-ter, Whatman; GF/F) and homogenized (henceforth P7 treatment). (3) 3 L of sample water was homogenized but not filtered further than 106 µm (henceforth UF – unfiltered). Subsamples for dissolved organic carbon (DOC – the carbon component of the DOM pool) concentrations and quality analyses (CDOM) were collected from the homogenized treatments.
For each treatment, 100 mL of sample water was decanted into 25 individual 125 mL acid-washed HDPE bottles for in-cubation. The bottles were incubated at 20◦C in completely dark conditions following standard protocol (Vonk et al., 2015). Bottle lids were loosely placed on top to ensure there was sufficient oxygen for bacterial respiration to occur. Five bottles for each treatment were removed from the incubation chamber on days 5, 14, 27 and 41 to enable sampling and analysis of DOM and microbial community dynamics during incubation. All incubation bottles were gently shaken every 2 to 3 days to limit flocculation and settling of organic matter at the bottom of the incubation bottles.
Five individual 125 mL acid-washed HDPE bottles were filled with 100 mL demineralized water and incubated under the same conditions as the treatments to serve as blanks. Car-bon concentrations in the blanks increased from 0.01±0.02 to 0.05±0.02 mmol L−1 over 41 days, representing an in-crease of 0.03 mmol L−1, likely because the demineralized water was not completely sterile. These values represent
∼1 % of the initial DOC concentrations and a maximum of
∼15 % of the lowest final DOC concentration, suggesting that any possible carbon input from the plastic bottles was small relative to the DOM dynamics observed during the in-cubation. Incubation samples would not have been affected by the suspected biological growth in the non-sterile dem-ineralized blanks because the incubation bottles only con-tained sample water and were not treated with the deminer-alized water in any way.
2.3 Sample collection and analysis
syringes; for the P7 and UF treatments, they were filtered to 0.7 µm (pre-ashed GF/F, Whatman) – this was to ensure the same size class of DOM was compared for each treat-ment. Samples were frozen immediately after collection and analysed within 6 months, which should not have had any significant impact on the concentration or isotope composi-tion of the DOC analyses (Gulliver et al., 2010; Peacock et al., 2015). The most commonly used filter sizes for DOM in-cubations are 0.2 and 0.7 µm (Vonk et al., 2015). A filter size of 0.45 µm is also common for a DOC sample collection, but less so for incubations. DOC concentrations and δ13 C-DOC isotopes were measured on a high-temperature com-bustion total organic carbon system (varioTOC cube; Ele-mentar Analysensysteme GmbH) coupled to an isotope ratio mass spectrometer (IsoPrime 100; Isoprime Ltd, UK), using an independent calibration curve (measurement range 0.02 to 12.5 mmol L−1) with 13C isotope standards IAEA-600, caffeine and IAEA-CH6, sucrose (Federherr et al., 2014; Kirkels et al., 2014).
DOM absorbance measurements (CDOM) were carried out immediately after sample filtration using a double-beam spectrophotometer (Shimadzu UV-1601PC). Absorbance spectra were determined in matched 1 cm quartz cuvettes over 200–750 nm, at 0.2 nm intervals, using fresh deminer-alized water as a reference. We calculated standard CDOM indices, SUVA254, SR, E2:E4 and E4:E6 ratios, and also present the specific absorption (a) at 240, 300 and 440 nm (Helms et al., 2008). Measured absorbance values were con-verted to absorption coefficients:
aCDOM(λ)=2.3×A (λ) / l, (1) where A(λ) is the absorbance at wavelengthλ (nm) and l
is cuvette path length (m). The slope coefficient, SCDOMin nm−1, is defined in the following equation (Helms et al., 2008):
aCDOM(λ)=aCDOM(λr) e−SCDOM(λ−λr)+K, (2) where aCDOM (λr) is the CDOM absorption at a reference wavelength λr, andK is the parameter that offsets baseline shifts unrelated to CDOM absorption.SCDOM was fitted for each sample over the wavelength ranges of 275–295 and 350–400 nm using linear regression of the log-transformed absorption coefficients. The ratio of these spectral slopes (SR) has been shown to provide insights into changes in DOM molecular weight (Helms et al., 2008).
2.4 DNA extraction and amplicon sequencing
At each sampling occasion, 20 mL of each sample was fil-tered to 0.2 µm (regenerated cellulose membrane, Whatman) using sterile syringes. These filters were subjected to DNA isolation for subsequent 16S amplicon community profiling. DNA was extracted from filters using the MoBio Powersoil DNA isolation kit (MoBio, Carlsbad, USA) following the
standard protocol. Successful DNA extraction was confirmed by visualization on agarose gel and quantification with Nan-oDrop (ThermoFisher, USA) in comparison to procedural blanks (sterile filters). Amplicons for sequencing were gen-erated by a two-step polymerase chain reaction (PCR). The first PCR was with universal bacterial and archaeal primers targeting the V3–V4 region of the 16S rRNA gene (341F and 806R). Reaction mixtures were 12.5 µL Phusion High-Fidelity Master Mix (ThermoFisher Scientific, USA), 1 µL of each primer at 10 nM concentration, 9 µL of nuclease-free water and 1.5 µL of DNA sample. The PCR programme was an initial step at 98◦C for 30 s; 30 cycles of 98◦C for 30 s, 55◦C for 30 s, 72◦C for 30 s; and a final step of 72◦C for 10 min. After confirming successful amplification, PCR products were purified and normalized using Sequal-prep plates (Thermofisher, USA) and subject to a second in-dexing PCR such that each sample received a unique combi-nation of 6-nucleotide barcoded forward and reverse primers. The reaction mixture was as above, and the PCR programme was an initial step at 95◦C for 30 s; 8 cycles of 95◦C for 30 s, 55◦C for 30 s, 72◦C for 30 s; and a final step of 72◦C for 5 min. PCR products were again purified and normalized with Sequalprep, then pooled, gel purified with QIAquick Gel Extraction Kit (Qiagen, USA), quantified with qPCR and the KAPA Library Quantification Kit, and sequenced on an Illumina MiSeq, with V3 chemistry, 2×300 cycles and a tar-get PhiX concentration of 20 %.
2.5 Bioinformatics
Our amplicon sequencing procedure produced 4.9 million pairs of raw reads. The original intention was to assemble contigs from the paired-end reads, but low read quality in the tail (last 150 cycles) made merging of paired-end reads im-possible. We therefore analysed single reads trimmed to 180 and 150 bases for forward and reverse reads respectively. We performed analysis on both forward (V3 region) and reverse (V4 region) reads in parallel using a common bioinformatics pipeline.
putative artefacts. All remaining OTUs were assembled into a phylogenetic tree using the FastTree algorithm (Price et al., 2009). Subsequent statistical analyses were performed on OTU tables rarefied to 8000 sequences per sample.
2.6 Statistics
The DOC concentration measurements exhibited complex temporal dynamics that differed between filtration treatment making it impractical to fit a single parametric model, so we analysed the data using generalized additive models (GAMs) (Wood, 2006; Catalán et al., 2017). We fit a series of mod-els, in every case modelling DOC concentration as a smooth function of time, but by either fitting (1) a single smoother for all treatments combined, (2) a separate smoother for each treatment or (3) a single smoother for P2 and UF and a sep-arate one for P7. For each model we also tested the effect of the choice of smoothing parameter (k=3 or 4, related to the degree of flexibility permitted in the curve fitting). Model selection using Akaike information criterion (AIC) (Johnson and Omland, 2004) was employed to identify the best-fitting model from these six candidate models.
For each of the seven DOM quality indices, we analysed the effects of incubation time and treatment, and their in-teraction, using a two-way ANOVA model. Since each ob-servation was from an independent incubation flask, no ad-justments for repeated measurements were made. Time was treated as a discrete factor.
Relationships between bacterial community profiles were visualized by Non-metric multidimensional scaling (NMDS) ordination of Unifrac distance matrices computed from the rarefied OTU table and associated de novo tree of OTU rep-resentative sequences. Unifrac is a pairwise phylogenetic similarity measure defined as the proportion of tree length shared by OTUs detected in any two samples (Lozupone and Knight, 2005). It therefore expresses the degree of similarity between samples, weighted by the phylogenetic distinctness of the differentiating taxa. We performed ordinations based on both the unweighted (taking into account only presence or absence of taxa) and weighted (also weighing taxa by their abundances in the OTU table) versions of Unifrac, as these provide complementary explorations of the relation-ships between community profiles (Lozupone and Knight, 2005). A more formal analysis of the difference in commu-nity profiles between treatments and sampling occasions was performed using permutational multiple analysis of variance (PERMANOVA) (Anderson, 2001; Oksanen et al., 2011), us-ing both the weighted and unweighted Unifrac matrices as the response variable, and filtration treatment and sampling time as fully crossed fixed factors. All statistical analyses were performed using the R software package (R Core Team, version 3.4.4).
3 Results
3.1 DOC dynamics
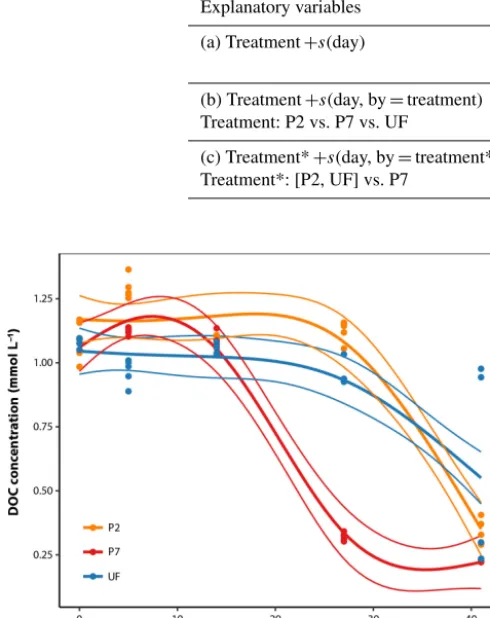
DOC concentrations in sample water measured directly af-ter field collection averaged 1.09 mmol L−1 (standard error [SE]=0.01, n=10; Fig. 1). Over the course of the incu-bation, there was a decrease in DOC concentrations with different dynamics between filtration strategies. P7 showed roughly negative exponential decay dynamics from the be-ginning (Fig. 1) and reached a final DOC concentration af-ter 41 days of 0.225 mmol L−1 (SE=0.001,n=5), equiv-alent to 21 % of initial concentrations. Both UF and P2 showed temporal dynamics with a clear lag phase: large decreases in DOC concentrations were not apparent after 28 days, but after 41 days they approached convergence with P7, with final values at 49 % and 31 % of initial con-centrations, respectively (Fig. 1). It is generally more com-mon to fit a negative exponential model to DOM biolabil-ity data. However, this function is strictly constrained to de-creasing trends and cannot be sensibly fit to data that show increases, as seen in this study (Fig. 1). We attempted to fit negative exponential models to the same data, but this re-sulted in a much poorer fit (AIC= −13; Fig. S1 in the Sup-plement). The difference in dynamics according to the fil-tration strategy was statistically significant when analysed with GAMs, since the best-fitting model included separate smoothers for each filtration treatment (adjustedR2=0.89, estimated d.f.=11.0, Table 1). Two points at UF day 41 could be considered outliers; however, removing them from the data set leads to qualitatively the same conclusions with regards to the best-fitting model by the AIC model compari-son and the following predicted values on day 27 (proportion DOC remaining, mean±standard error, n=5 in all cases; P2=98 %±3, P7=27 %±3, UF=86 %±3), and on day 41 (P2=31 %±3, P7=21 %±3, UF=24 %±4) (Table 1; Fig. 1).
Table 1.Analysis of temporal DOC concentration dynamics. Three candidate GAM models were fit including a non-linear smoothing term s. These models correspond to the following scenarios: (a) treatments differ in initial concentration but show identical temporal dynamics; (b) treatments differ in initial concentration but with unique temporal dynamics of DOC concentration for each treatment; (c) treatments differ in initial concentration but with separate dynamics for P7 relative to P2 and UF. For each model two possible fitting parameters (k) were tested. Higher values ofkallow more flexible model forms. Values reported are AIC with the percentage of deviance explained by the model in parentheses, followed by the estimated degrees of freedom. AIC is a measure of relative goodness of fit for each model to the observed data; lower AIC values indicate better fit. The best fit model is printed in bold and was used to generate the non-linear regression lines in Fig. 1.
Fitting parameter
Explanatory variables k=3 k=4
(a) Treatment+s(day) −33 −33 (73.7 %, d.f.=4.9) (74.2 %, d.f.=5.4)
(b) Treatment+s(day, by=treatment) −60 −97
Treatment: P2 vs. P7 vs. UF (83.1 %, d.f.=7.8) (90.4 %,d.f.=11.0)
[image:5.612.45.290.189.498.2](c) Treatment*+s(day, by=treatment*) −54 −82 Treatment*: [P2, UF] vs. P7 (80 %, d.f.=5.0) (87.3 %, d.f.=7.7)
Figure 1.DOC concentration dynamics over the course of the in-cubations for the three filtration treatments. The thicker smoothed lines represent the best-fit GAM as selected using AIC (see Sect. 2.6); thinner lines define the bounds of the 95 % prediction intervals derived from the model fits, with standard error estimates pooled across all observations (Table 1).
incubations). A likely candidate is nitrification, given the rel-atively large concentrations of ammonia in the water column (29–82 µmol L−1NO3+NO2, Ko van Huissteden, personal communication, 2017). This is supported by rapid growth in microbial cell counts over the same period (Logue et al., 2016) (Fig. S2 in the Supplement). However, the shifts in
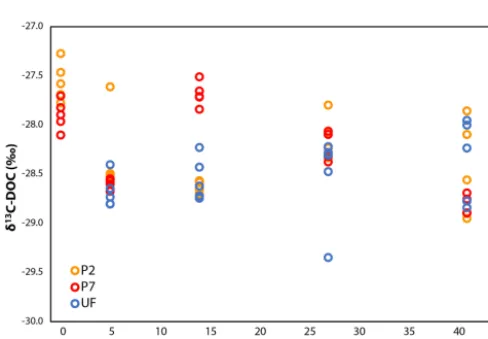
δ13C-DOC do not provide any clear line of reasoning for these differing DOC dynamics (for example a shift towards less negativeδ13C-DOC values due to chemoautotrophic fix-ation of ambient CO2on day 5).
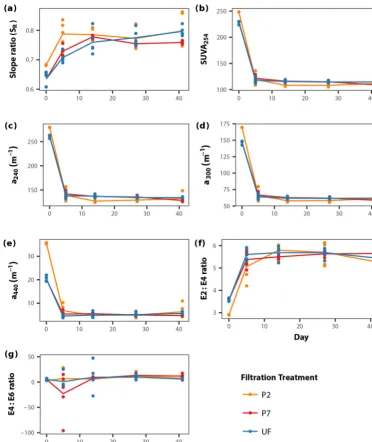
DOM quality showed a consistent pattern across filtration treatments. All the absorption parameters indicate a rapid shift from more aromatic and higher molecular weight DOM to much more degraded and smaller molecules by day 5 (Fig. 3). This is more pronounced in SUVA254, E2:E3 ra-tios and absorptions at 240, 300 and 440 nm compared to
SR, the latter of which shows greater scatter, but the same general trend. Moreover, factorial ANOVA analyses show that the temporal effect was always stronger than any effect of filtration treatment (Table 2). The E4:E6 ratios did not change significantly over the course of the experiment, nor did they differ between filtration strategy treatments. This shows that the DOC concentration dynamics are decoupled from DOM structural dynamics, indicating that microbial ac-tivity is playing an important role in DOC concentrations, but that overall molecular degradation was consistent across the treatments.
Based on the lack of a significant difference between DOC concentrations in the treatments at the initial time point (Fig. 1), there is very little DOC contained between the 0.2 and 0.7 µm size range; this is supported by previous work (Zsolnay, 2003; Bouillon et al., 2014; Denis et al., 2017). Most DOM molecules are very small, less than∼0.1 µm in size (Gustafsson and Gschwend, 1997), with very little in the 0.2 to 0.7 µm size range contributing to the overall DOC con-centration. This is also reflected in the DOM quality indices in this study, although the P2 treatment shows some differ-ences initially (Fig. 3). The lower E2:E3 ratio and higher
Table 2.Analyses of DOM spectral properties, with ANOVA values for each of the DOM spectral indices. Each row represents a different index. Each column indicates theF ratio for the corresponding term in a two-way factorial ANOVA model. Numerator and denominator degrees of freedom are given for each column. Within a row, larger values indicate relatively larger effects. Asterisks indicate significance levels.
Day Treatment Day×treatment Adjusted (d.f.=4,58) (d.f.=2,58) (d.f.=8,58) R2
Slope ratio (SR) 52.7∗∗∗ 9.5∗∗ 2.3∗ 0.76 SUVA254 1679.7∗∗∗ 0.1 7.4∗∗∗ 0.99 Absorbance 240 nm 1774.6∗∗∗ 0.2 6.4∗∗∗ 0.99 Absorbance 300 nm 1512.2∗∗∗ 2.1 10.9∗∗∗ 0.99 Absorbance 440 nm 546.5∗∗∗ 36.7∗∗∗ 32.9∗∗∗ 0.97 E2:E3 103.7∗∗∗ 2.6 1.8 0.85 E4:E6 2.8∗ 0.6 1.4 0.12
∗P <0.05,∗∗P <0.01,∗∗∗P <0.001
Figure 2.δ13C-DOC over the course of the incubation. UF values are the same as P7 for day 0 because the DOC subsamples were treated in the same manner, so a further set of technical replicates was deemed unnecessary (see Sect. 2.3).
structural indices converging by the first time point (day 5) across all treatments during incubation (Fig. 3). This suggests that what small initial structural differences existed between the P2 and P7 treatments appeared unimportant to the overall dynamics of the DOM pool, which is supported by the lack of difference in initial DOC concentrations (Fig. 1) and pre-vious work (Zsolnay, 2003; Bouillon et al., 2014; Denis et al., 2017).
3.2 Microbial community structure
Bacterial community analyses based on the V3 and V4 re-gions were qualitatively very similar. We here present results based on the longer and higher-quality V3 sequences. Fig-ure 4a and b display the relationships between bacterial com-munity profiles based on treatment and sampling time. There is a clear temporal shift in bacterial community composi-tion, the trajectory of which varies due to filtration treatment.
This interpretation is supported by the results of the PER-MANOVA, which show that for the abundance-weighted analysis both incubation time, treatment and their interac-tion significantly contribute to variainterac-tion in the community distance matrix (all permutationP <0.0001, proportion of variance explained: time=66 %, filtration treatment=8 %, time×filtration=15 %). For presence–absence-based anal-ysis, treatment and time effects were still significant but the latter was relatively weaker (all permutation P <0.0001, proportion of variance explained: time=29 %, filtration treatment=12 %, time×filtration=14 %).
The patterns described above are a result of complex tem-poral dynamics in the relative abundances of different bac-terial taxa (Figs. S3 and S4 in the Supplement). Focusing on the most abundant taxa, across all treatments the relative abundances of reads assignable toAlphaproteobacteria, Bac-teroidetes,Verrucomicrobia,Planctomycetesand Actinobac-teria all tended to increase over the course of the incuba-tion. Conversely, reads assignable to the candidate phylum
OD1andParvarchaeota,and unassignable reads, all showed negative trends in relative abundance over the course of the incubation. Reads assignable to the classesBeta-,
Gamma-,Epsilon-andGammaproteobacteriashowed more variable dynamics exhibiting large changes in relative abundance in the first 5 days, followed by stabilization for the remainder of the incubation. When comparing treatments, the major differences were due to the timing and magnitude of shifts in these general patterns. More specifically,Actinobacteria
showed a much stronger increase in relative abundance over the incubation in UF samples relative to the other treatments;
[image:6.612.46.290.265.434.2]Figure 3.DOM quality (structural proxies) dynamics during the course of the incubations for each filtration treatment, separated into the seven different DOM structural indices used in this study (a–g; see Sect. 2.3). Points represent individual replicates; lines connect mean values calculated for each day×treatment combination (Table 2).
abundances than the other two treatments, but for both taxa the abundances from 14 days onwards were broadly similar across treatments (Figs. 4, S3 and S4).
4 Discussion
Filtration prior to incubation is standard practice in DOM biolability assays. Our results show that the specific choice of filtration strategy can have persistent consequences for the community composition of bacterioplankton throughout the course of the incubation, as well as on the dynamics of DOM degradation.
4.1 How does filter treatment affect bacterial community composition?
differ-Figure 4.Bacterial dynamics for each of the filter treatments during the incubations.(a, b)NMDS ordinations based on presence–absence
(a)or abundance-weighted(b)UniFrac distances; clusters (convex hulls) for each day×treatment combination are plotted; the lines join the centre of each cluster following the sequence of sampling.(c)Relative read abundances of the nine most abundant bacterial (sub-) phyla, based on 16S rRNA gene amplicon sequence data, separated by sampling time and treatment. Each column represents an experimental replicate. “Other” contains both unassigned bacterial reads and reads assigned to less abundant taxa. See Supplement for univariate time series plots for the most abundant taxonomic groups.
ent growth rates, resource competition and, potentially, pre-dation.
In our study system, UF samples (unfiltered) and P2 ples (filtered to 0.2 µm and inoculated with unfiltered sam-ple) had similar bacterioplankton community compositions at the beginning of the incubation. During the course of the incubation, however, the bacterioplankton community com-positions of P2 and P7 (filtered to 0.7 µm but not inoculated) treatments became more similar, a pattern that persisted until the end of the incubation. When assessed with a presence– absence-based distance metric, the different treatments did
not converge (Fig. 4a), showing that for the timescales rele-vant for incubation, filtration strategy significantly alters bac-terioplankton community composition.
Filtration strategy is likely to have affected the bacterial community composition in our incubations through three dif-ferent mechanisms.
[image:8.612.110.489.65.483.2]0.7 µm were particularly enriched in candidate phylumOD1
andParvarchaeota, but depleted inBacteroidetes,Epsilon-,
Delta- andBetaproteobacteriaat the very beginning of the incubation relative to P2 and UF samples.OD1is a poorly characterized taxon, although some evidence points to its members being particularly abundant in the hypolimnion of lakes (Peura et al., 2012). Parvarchaeota are consid-ered amongst the smallest microorganisms currently known (Chen et al., 2018), so their higher relative abundance is not surprising given they would readily fit through the 0.7 µm filter pore. The variousProteobacteriaclasses encompass a wide range of ecological niches in freshwater environments (Newton et al., 2011). This large variety makes it difficult to relate the observed patterns in our study to specific func-tions, but the depletion of Betaproteobacteriaat the begin-ning of the incubation in P7 samples agrees with the obser-vation that members of this group tend to be fast-growing and therefore tend to have larger cell sizes (Newton et al., 2011). Of the other two treatments, it is interesting to note that the P2 samples more closely resembled the UF samples in the early stages of the incubation. This implies that, initially at least, the bacterial community in P2 was dominated by taxa introduced with the inoculum, despite the fact that members of some freshwater bacterial phyla can pass a 0.2 µm filter (Hahn, 2004). This is evidence for the efficacy of inoculation treatments in biolability studies.
A second mechanism by which filtration could affect terial community composition is through the activity of bac-terial grazers. Given the important role of bacbac-terial predation by ciliates, flagellates and other microeukaryotes in structur-ing bacterioplankton communities (Hahn and Hofle, 2001), it is logical to expect that any filtration strategy that reduces predator abundance would influence the development of the bacterioplankton community in an incubation (although we did not characterize the bacterivorous community in this study). For example, if UF samples contained a bacteri-ovore community closest to that found in the source system, then the higher relative abundances of Actinobacteria and lower peak ofBetaproteobacteriacould result from grazing-mediated selection;Actinobacteriaare generally considered defense specialists, whileBetaproteobacteria have been ob-served to be sensitive to grazing pressure (Hahn and Hofle, 2001; Newton et al., 2011).
A third possible mechanism by which filtration could in-fluence bacterial community composition is the effect of filtration on the quantity and chemical composition of the DOM pool. If DOM chemical composition is related to its size fraction, then filtration could potentially change the quality and structure of the substrate available to het-erotrophs leading to divergences in community composition due to differential specialization on carbon substrates (Logue et al., 2016). The different filtration strategies used in this study did not significantly affect the overall structural charac-teristics of the DOM pool (Table 2; Fig. 3), so this is unlikely to have influenced the bacterial community composition or
its evolution through time. Further, the shift in the bacte-rial community was observed to occur over longer timescales than any shift seen in the DOM structural properties, which all reached equilibrium by day 14 (Table 2; Fig. 3).
4.2 Does the change in bacterial community composition affect DOM biolability assays?
The DOM dynamics of P7 were distinct from P2 and UF, which in general behaved the same through the course of the incubation (Fig. 1). This is the opposite to what we see in the bacterial community composition dynamics in which UF was distinct from P7 and P2 (Fig. 4). DOM degradation dy-namics may therefore be driven by the bacterial community composition commonalities in P2 and UF, and the bacterial community in P7 (the most common treatment/experimental design for DOM biolability studies) (Vonk et al., 2015) is more efficient at degrading DOM. However, in this study there was no evidence for the presence of high-level taxa that clearly associate with variations in DOM dynamics. This is most likely due to the high diversity of ecological traits within the higher-level taxonomic groupings we analysed (Martiny et al., 2015). All the major groups observed, es-pecially Actinobacteria, Bacteriodetes and Proteobacteria, are known to be associated with the degradation of DOM in freshwater systems (Bauer et al., 2006; Gattuso, 2002; New-ton et al., 2011). The lack of clear connection between these taxa and observed DOM degradation leads to the conclusion that degradation was not driven by specific changes in the bacterial community composition. We propose that the fol-lowing two mechanisms could explain the observed dynam-ics:
1. Bacteriovores (grazers) limit the growth rate of bacte-rial communities (Baumgartner et al., 2016; Hahn and Hofle, 2001). This could explain the difference between P7 and UF, as the 0.7 µm filter pore size would likely ex-clude bacteriovores, which tend to be much larger than the bacteria they prey upon (Berdjeb et al., 2011). How-ever, bacteriovores are likely to be present in the UF and P2 treatments (in the latter case due to inoculation). 2. Filtration will severely limit the number of cells that
pass through specific filter pore sizes (Wang et al., 2008). In P2, DOM degradation rates may have been limited by the low initial population size caused by the size cut-off of the 0.2 µm filter, which would exclude the vast majority of bacteria (Hahn, 2004). The number of bacterial cells in the P2 treatments were consistently 31 %–75 % lower than in the UF treatments (Fig. S2 in the Supplement).
community composition, bacterial abundance and the pres-ence of their associated predators.
4.3 Wider implications, limitations and future work Using a universal bacterial inoculum could prevent the bio-lability comparison issues raised by this study (Pastor et al., 2018). However, such a universal inoculum could also suf-fer from changes in microbial community composition over time depending on the DOM source and available nutrients, and/or be affected by microbes that slip through a 0.2 µm fil-ter (Hahn, 2004). Further trials of universal inoculums across a range of aquatic environments would be beneficial in as-sessing these potential issues.
This study suggests that filter size has relatively little im-pact on DOC concentration and DOM structure, supporting previous studies (Zsolnay, 2003; Bouillon et al., 2014; De-nis et al., 2017). The choice of filter size for DOM sample storage, therefore, is relatively unimportant. What is more important for sample storage, and the subsequent degrada-tion of the DOM pool by latent microbes, is the immediate treatment and storage conditions. For example, acidification, storage in dark conditions, refrigeration and freezing can all reduce microbial activity and maintain the integrity of DOM samples, but the best method is to analyse the samples as soon as possible after collection (Gulliver et al., 2010; Pea-cock et al., 2015).
This study is from a single peatland site in the Nether-lands and therefore may not be representative of DOM bio-lability dynamics across a wider range of freshwater ecosys-tems. The organic carbon-rich nature of the study site and its water are consistent with temperate peatland character-istics elsewhere in the Northern Hemisphere (e.g. Billett et al., 2010), but the agricultural history of the site means that nutrient availability and the general chemistry of the sample waters are likely different from more pristine peatland sys-tems. Such environmental factors are important influences on microbial communities (Dean et al., 2018; Gulis and Suberkropp, 2003), which would have influenced the devel-opment of bacterial community composition during the ex-periment presented here.
It is important to note that the microbial community pat-terns described here are based on relative abundances; thus, apparent declines in particular taxa may be attributable to ei-ther real declines in population or (as is more likely) rela-tively slower growth relative to other taxa in the community. Moreover, PCR amplicon generation is known to introduce biases in the community profile (e.g. Sipos et al., 2007), so any interpretation of these data for particular taxa should be further confirmed by more reliable quantitative methods such as taxon-specific qPCR (Smith and Osborn, 2009), FISH (Amann et al., 1995) or PCR-free metagenomics methods (Handelsman, 2004).
Despite the lack of clear connection between bacterial community composition and DOM dynamics, the high
repro-ducibility of both measurements across the technical repli-cates suggests that this system could be a potentially useful model for further exploring the relationship between commu-nity structure and function. A central question in microbial ecology is to what extent information about the taxonomic composition of microbial assemblages allows prediction of their biogeochemical function (Bier et al., 2015; Graham et al., 2016). Future studies should seek to experimentally test the relative importance of initial population size and the pres-ence or abspres-ence of grazers in determining DOM utilization rates. Future work should also consider bacterial community composition dynamics, size selection and DOM structural characteristics across multiple sites and climate settings to confirm the degree to which filtration strategy affects DOM biolability assays across a wider range of catchment settings.
5 Conclusions
Filtration strategy was shown in this study to affect both mi-crobial community composition and DOM degradation dy-namics, but these two responses were disconnected from one another. There are two important conclusions from these re-sults for interpreting aquatic biolability assays. Firstly, our results suggest that care should be taken when comparing re-sults using different filtration strategies, especially for shorter incubations since we have shown that the DOM degradation and microbial community dynamics may not converge until after the commonly used 28-day length for long-term bio-lability assays, if at all (Figs. 1 and 4). However, in many cases the relevant parameter to be estimated from such long-term incubations is the total biolabile fraction (Guillemette and del Giorgio, 2011), and despite the divergent dynamics in the early part of our incubation it appears that all filtration strategies do eventually converge on a similar value for total DOM biolability. The P7 (0.7 µm filtration with no inoculum) treatment appeared to reach this point at the fastest rate.
Data availability. All sequence data are available on the NCBI Se-quence Read Archive under BioProject ID PRJNA507183. All DOC and DOM data are provided in the Excel spreadsheet in the Supple-ment.
Supplement. The supplement related to this article is available online at: https://doi.org/10.5194/bg-15-7141-2018-supplement.
Competing interests. The authors declare that they have no conflict of interest.
Acknowledgements. This work was carried out under the pro-gramme of the Netherlands Earth System Science Centre (NESSC), financially supported by the Ministry of Education, Culture and Science (OCW) (grant number 024.002.001). We thank the Systems Bioinformatics group at VU Amsterdam for the use of their flow cytometry equipment. We also thank the editor, Gerhard Herndl, and two anonymous referees for their comments and discussion which have improved this manuscript.
Edited by: Gerhard Herndl
Reviewed by: two anonymous referees
References
Amann, R. I., Ludwig, W., and Schleifer, K. H.: Phylogenetic identi-fication and in situ detection of individual microbial cells without cultivation., Microbiol. Rev., 59, 143–69, 1995.
Anderson, M. J.: A new method for non-parametric mul-tivariate analysis of variance, Austral. Ecol., 26, 32–46, https://doi.org/10.1111/j.1442-9993.2001.01070.pp.x, 2001. Aufdenkampe, A. K., Mayorga, E., Raymond, P. A., Melack,
J. M., Doney, S. C., Alin, S. R., Aalto, R. E., and Yoo, K.: Riverine coupling of biogeochemical cycles between land, oceans, and atmosphere, Front. Ecol. Environ., 9, 53–60, https://doi.org/10.1890/100014, 2011.
Baltar, F., Lindh, M. V., Parparov, A., Berman, T., and Pin-hassi, J.: Prokaryotic community structure and respiration during long-term incubations, Microbiologyopen, 1, 214–224, https://doi.org/10.1002/mbo3.25, 2012.
Bauer, M., Kube, M., Teeling, H., Richter, M., Lombardot, T., Allers, E., Würdemann, C. A., Quast, C., Kuhl, H., Knaust, F., Woebken, D., Bischof, K., Mussmann, M., Choudhuri, J. V., Meyer, F., Reinhardt, R., Amann, R. I., and Glöckner, F. O.: Whole genome analysis of the marine Bacteroidetes “Gramella forsetii” reveals adaptations to degradation of poly-meric organic matter, Environ. Microbiol., 8, 2201–2213, https://doi.org/10.1111/j.1462-2920.2006.01152.x, 2006. Baumgartner, M., Neu, T. R., Blom, J. F., and Pernthaler, J.:
Pro-tistan predation interferes with bacterial long-term adaptation to substrate restriction by selecting for defence morphotypes, J. Evol. Biol., 29, 2297–2310, https://doi.org/10.1111/jeb.12957, 2016.
Berdjeb, L., Pollet, T., Domaizon, I., and Jacquet, S.: Effect of graz-ers and viruses on bacterial community structure and produc-tion in two contrasting trophic lakes, BMC Microbiol., 11, 88, https://doi.org/10.1186/1471-2180-11-88, 2011.
Bier, R. L., Bernhardt, E. S., Boot, C. M., Graham, E. B., Hall, E. K., Lennon, J. T., Nemergut, D. R., Osborne, B. B., Ruiz-González, C., Schimel, J. P., Waldrop, M. P., and Wal-lenstein, M. D.: Linking microbial community structure and microbial processes: an empirical and conceptual overview, edited by G. Muyzer, FEMS Microbiol. Ecol., 91, fiv113, https://doi.org/10.1093/femsec/fiv113, 2015.
Billett, M. F., Charman, D. J., Clark, J. M., Evans, C. D., Evans, M. G., Ostle, N. J., Worrall, F., Burden, A., Dinsmore, K. J., Jones, T., McNamara, N. P., Parry, L., Rowson, J. G., and Rose, R.: Carbon balance of UK peatlands: Current state of knowl-edge and future research challenges, Clim. Res., 45, 13–29, https://doi.org/10.3354/cr00903, 2010.
Bouillon, S., Yambele, A., Gillikin, D. P., Teodoru, C., Dar-chambeau, F., Lambert, T., and Borges, A. V.: Contrast-ing biogeochemical characteristics of the Oubangui River and tributaries (Congo River Basin), Sci. Rep., 4, 5402, https://doi.org/10.1038/srep05402, 2014.
Caporaso, J. G., Bittinger, K., Bushman, F. D., DeSantis, T. Z., An-dersen, G. L., and Knight, R.: PyNAST: a flexible tool for align-ing sequences to a template alignment, Bioinformatics, 26, 266– 267, https://doi.org/10.1093/bioinformatics/btp636, 2010a. Caporaso, J. G., Kuczynski, J., Stombaugh, J., Bittinger, K.,
Bush-man, F. D., Costello, E. K., Fierer, N., Peña, A. G., Goodrich, J. K., Gordon, J. I., Huttley, G. A., Kelley, S. T., Knights, D., Koenig, J. E., Ley, R. E., Lozupone, C. A., McDonald, D., Muegge, B. D., Pirrung, M., Reeder, J., Sevinsky, J. R., Turnbaugh, P. J., Walters, W. A., Widmann, J., Yatsunenko, T., Zaneveld, J., and Knight, R.: QIIME allows analysis of high-throughput community sequencing data, Nat. Methods, 7, 335– 336, https://doi.org/10.1038/nmeth.f.303, 2010b.
Catalán, N., Casas-Ruiz, J. P., von Schiller, D., Proia, L., Obrador, B., Zwirnmann, E., and Marcé, R..: Biodegradation kinetics of dissolved organic matter chromatographic fractions in an intermittent river, J. Geophys. Res.-Biogeosci., 122, 131–144, https://doi.org/10.1002/2016JG003512, 2017.
Chen, L.-X., Méndez-García, C., Dombrowski, N., Servín-Garcidueñas, L. E., Eloe-Fadrosh, E. A., Fang, B.-Z., Luo, Z.-H., Tan, S., Zhi, X.-Y., Hua, Z.-S., Martinez-Romero, E., Woyke, T., Huang, L.-N., Sánchez, J., Peláez, A. I., Ferrer, M., Baker, B. J., and Shu, W.-S.: Metabolic versatility of small ar-chaea Micrarchaeota and Parvarchaeota, ISME J., 12, 756–775, https://doi.org/10.1038/s41396-017-0002-z, 2018.
Cole, J. J., Prairie, Y. T., Caraco, N. F., McDowell, W. H., Tranvik, L. J., Striegl, R. G., Duarte, C. M., Kortelainen, P., Downing, J. A., Middelburg, J. J., and Melack, J.: Plumb-ing the Global Carbon Cycle: IntegratPlumb-ing Inland Waters into the Terrestrial Carbon Budget, Ecosystems, 10, 171–184, https://doi.org/10.1007/s10021-006-9013-8, 2007.
Dean, J. F., Billett, M. F., Baxter, R., Dinsmore, K. J., Lessels, J. S., Street, L. E., Subke, J.-A., Tetzlaff, D., Washbourne, I., and Wookey, P. A.: Biogeochemistry of “pristine” freshwater stream and lake systems in the western Canadian Arctic, Biogeochem-istry, 130, 191–213, https://doi.org/10.1007/s10533-016-0252-2, 2016.
Dean, J. F., Middelburg, J. J., Röckmann, T., Aerts, R., Blauw, L. G., Egger, M., Jetten, M. S. M., de Jong, A. E. E., Meisel, O. H., Rasigraf, O., Slomp, C. P., in’t Zandt, M. H., and Dolman, A. J.: Methane feedbacks to the global cli-mate system in a warmer world, Rev. Geophys., 56, 207–250, https://doi.org/10.1002/2017RG000559, 2018.
Denis, M., Jeanneau, L., Pierson-Wickman, A.-C., Humbert, G., Pe-titjean, P., Jaffrezic, A., and Gruau, G.: A comparative study on the pore-size and filter type effect on the molecular composition of soil and stream dissolved organic matter, Org. Geochem., 110, 36–44, https://doi.org/10.1016/j.orggeochem.2017.05.002, 2017. DeSantis, T. Z., Hugenholtz, P., Larsen, N., Rojas, M., Brodie, E. L., Keller, K., Huber, T., Dalevi, D., Hu, P., and Andersen, G. L.: Greengenes, a Chimera-Checked 16S rRNA Gene Database and Workbench Compatible with ARB, Appl. Environ. Microbiol., 72, 5069–5072, https://doi.org/10.1128/AEM.03006-05, 2006. Drake, T. W., Wickland, K. P., Spencer, R. G. M., McKnight,
D. M., and Striegl, R. G.: Ancient low–molecular-weight or-ganic acids in permafrost fuel rapid carbon dioxide produc-tion upon thaw, P. Natl. Acad. Sci. USA, 112, 13946–13951, https://doi.org/10.1073/pnas.1511705112, 2015.
Edgar, R. C.: UPARSE: highly accurate OTU sequences from microbial amplicon reads, Nat. Methods, 10, 996–998, https://doi.org/10.1038/nmeth.2604, 2013.
Edgar, R. C. and Flyvbjerg, H.: Error filtering, pair as-sembly and error correction for next-generation se-quencing reads, Bioinformatics, 31, 3476–3482, https://doi.org/10.1093/bioinformatics/btv401, 2015.
Evans, C. D., Page, S. E., Jones, T., Moore, S., Gauci, V., Laiho, R., Hruska, J., Allott, T. E. H., Billett, M. F., Tipping, E., Freeman, C., and Garnett, M. H.: Contrasting vulnerability of drained trop-ical and high-latitude peatlands to fluvial loss of stored carbon, Global Biogeochem. Cy., 28, 1215–1234, 2014.
Federherr, E., Cerli, C., Kirkels, F. M. S. A., Kalbitz, K., Kupka, H. J., Dunsbach, R., Lange, L., Schmidt, T. C., Cerli, C., Feder-herr, E., Gao, J., and Kalbitz, K.: A novel high-temperature combustion based system for stable isotope analysis of dis-solved organic carbon in aqueous samples, I: development and validation, Rapid Commun. Mass Spectrom., 28, 2559–2573, https://doi.org/10.1002/rcm.7052, 2014.
Ferguson, R. L., Buckley, E. N., and Palumbo, A. V: Response of marine bacterioplankton to differential filtration and confine-ment., Appl. Environ. Microbiol., 47, 49–55, 1984.
Findlay, S. E. G. and Sinsabaugh, R. L., Eds.: Aquatic Ecosystems: Interactivity of Dissolved Organic Matter, Academic Press, Am-sterdam, 2003.
Gasol, J. and Morán, X.: Effects of filtration on bacterial activity and picoplankton community structure as assessed by flow cytometry, Aquat. Microb. Ecol., 16, 251–264, https://doi.org/10.3354/ame016251, 1999.
Gattuso, J.-P.: Changes in freshwater bacterial community composition during measurements of microbial and com-munity respiration, J. Plankton Res., 24, 1197–1206, https://doi.org/10.1093/plankt/24.11.1197, 2002.
Gilbert, J. A., Field, D., Swift, P., Newbold, L., Oliver, A., Smyth, T., Somerfield, P. J., Huse, S., and Joint, I.: The seasonal structure of microbial communities in the Western English Channel, Env-iron. Microbiol., 11, 3132–3139, https://doi.org/10.1111/j.1462-2920.2009.02017.x, 2009.
Graham, E. B., Knelman, J. E., Schindlbacher, A., Siciliano, S., Breulmann, M., Yannarell, A., Beman, J. M., Abell, G., Philip-pot, L., Prosser, J., Foulquier, A., Yuste, J. C., Glanville, H. C., Jones, D. L., Angel, R., Salminen, J., Newton, R. J., Bürgmann, H., Ingram, L. J., Hamer, U., Siljanen, H. M. P., Peltoniemi, K., Potthast, K., Bañeras, L., Hartmann, M., Banerjee, S., Yu,
R.-Q., Nogaro, G., Richter, A., Koranda, M., Castle, S. C., Goberna, M., Song, B., Chatterjee, A., Nunes, O. C., Lopes, A. R., Cao, Y., Kaisermann, A., Hallin, S., Strickland, M. S., Garcia-Pausas, J., Barba, J., Kang, H., Isobe, K., Papaspyrou, S., Pastorelli, R., Lagomarsino, A., Lindström, E. S., Basiliko, N., and Nemergut, D. R.: Microbes as Engines of Ecosys-tem Function: When Does Community Structure Enhance Pre-dictions of Ecosystem Processes?, Front. Microbiol., 7, 214, https://doi.org/10.3389/fmicb.2016.00214, 2016.
Guillemette, F. and del Giorgio, P. A.: Reconstructing the various facets of dissolved organic carbon bioavailability in freshwater ecosystems, Limnol. Oceanogr., 56, 734–748, https://doi.org/10.4319/lo.2011.56.2.0734, 2011.
Guillemette, F., Bianchi, T. S., and Spencer, R. G. M.: Old be-fore your time: Ancient carbon incorporation in contempo-rary aquatic foodwebs, Limnol. Oceanogr., 62, 1682–1700, https://doi.org/10.1002/lno.10525, 2017.
Gulis, V. and Suberkropp, K.: Leaf litter decomposition and microbial activity in nutrient-enriched and unaltered reaches of a headwater stream, Freshw. Biol., 48, 123–134, https://doi.org/10.1046/j.1365-2427.2003.00985.x, 2003. Gulliver, P., Waldron, S., Scott, E. M., and Bryant, C. L.: The effect
of storage on the radiocarbon, stable carbon and nitrogen isotopic signatures and concentrations of riverine DOM, Radiocarbon, 52, 1113–1122, https://doi.org/10.1017/S0033822200046191, 2010. Gustafsson, O. and Gschwend, P. M.: Aquatic colloids: Concepts, definitions, and current challenges, Limnol. Oceanogr., 42, 519– 528, https://doi.org/10.4319/lo.1997.42.3.0519, 1997.
Hahn, M. W.: Broad diversity of viable bacteria in ‘ster-ile’ (0.2 µm) filtered water, Res. Microbiol., 155, 688–691, https://doi.org/10.1016/j.resmic.2004.05.003, 2004.
Hahn, M. W. and Hofle, M. G.: Grazing of protozoa and its effect on populations of aquatic bacteria, FEMS Mi-crobiol. Ecol., 35, 113–121, https://doi.org/10.1111/j.1574-6941.2001.tb00794.x, 2001.
Handelsman, J.: Metagenomics: Application of Genomics to Uncul-tured Microorganisms, Microbiol. Mol. Biol. Rev., 68, 669–685, https://doi.org/10.1128/MMBR.68.4.669-685.2004, 2004. Helms, J. R., Stubbins, A., Ritchie, J. D., Minor, E. C., Kieber, D.
J., and Mopper, K.: Absorption spectral slopes and slope ratios as indicators of molecular weight, source, and photobleaching of chromophoric dissolved organic matter, Limonol. Oceanogr., 53, 955–969, https://doi.org/10.4319/lo.2008.53.3.0955, 2008. Hendriks, D. M. D., van Huissteden, J., Dolman, A. J., and
van der Molen, M. K.: The full greenhouse gas balance of an abandoned peat meadow, Biogeosciences, 4, 411–424, https://doi.org/10.5194/bg-4-411-2007, 2007.
Johnson, J. B. and Omland, K. S.: Model selection in ecology and evolution, Trends Ecol. Evol., 19, 101–108, https://doi.org/10.1016/j.tree.2003.10.013, 2004.
Kirkels, F. M. S. A., Cerli, C., Federherr, E., Gao, J., and Kalb-itz, K.: A novel high-temperature combustion based system for stable isotope analysis of dissolved organic carbon in aque-ous samples, II: optimization and assessment of analytical per-formance, Rapid Commun. Mass Spectrom., 28, 2574–2586, https://doi.org/10.1002/rcm.7053, 2014.
the ocean: a δ13C study, Biogeosciences, 11, 3707–3719, https://doi.org/10.5194/bg-11-3707-2014, 2014.
Le Quéré, C., Andrew, R. M., Canadell, J. G., Sitch, S., Kors-bakken, J. I., Peters, G. P., Manning, A. C., Boden, T. A., Tans, P. P., Houghton, R. A., Keeling, R. F., Alin, S., Andrews, O. D., Anthoni, P., Barbero, L., Bopp, L., Chevallier, F., Chini, L. P., Ciais, P., Currie, K., Delire, C., Doney, S. C., Friedlingstein, P., Gkritzalis, T., Harris, I., Hauck, J., Haverd, V., Hoppema, M., Klein Goldewijk, K., Jain, A. K., Kato, E., Körtzinger, A., Land-schützer, P., Lefèvre, N., Lenton, A., Lienert, S., Lombardozzi, D., Melton, J. R., Metzl, N., Millero, F., Monteiro, P. M. S., Munro, D. R., Nabel, J. E. M. S., Nakaoka, S.-I., O’Brien, K., Olsen, A., Omar, A. M., Ono, T., Pierrot, D., Poulter, B., Röden-beck, C., Salisbury, J., Schuster, U., Schwinger, J., Séférian, R., Skjelvan, I., Stocker, B. D., Sutton, A. J., Takahashi, T., Tian, H., Tilbrook, B., van der Laan-Luijkx, I. T., van der Werf, G. R., Viovy, N., Walker, A. P., Wiltshire, A. J., and Zaehle, S.: Global Carbon Budget 2016, Earth Syst. Sci. Data, 8, 605–649, https://doi.org/10.5194/essd-8-605-2016, 2016.
Logue, J. B., Stedmon, C. A., Kellerman, A. M., Nielsen, N. J., Andersson, A. F., Laudon, H., Lindström, E. S., and Kritzberg, E. S.: Experimental insights into the importance of aquatic bacterial community composition to the degra-dation of dissolved organic matter, ISME J., 10, 533–545, https://doi.org/10.1038/ismej.2015.131, 2016.
Lozupone, C. and Knight, R.: UniFrac: a New Phylogenetic Method for Comparing Microbial Communities, Appl. Environ. Micro-biol., 71, 8228–8235, https://doi.org/10.1128/AEM.71.12.8228-8235.2005, 2005.
Mann, P. J., Eglinton, T. I., McIntyre, C. P., Zimov, N., Davy-dova, A., Vonk, J. E., Holmes, R. M., and Spencer, R. G. M.: Utilization of ancient permafrost carbon in head-waters of Arctic fluvial networks, Nat. Commun., 6, 7856, https://doi.org/10.1038/ncomms8856, 2015.
Martiny, J. B. H., Jones, S. E., Lennon, J. T., and Martiny, A. C.: Mi-crobiomes in light of traits: A phylogenetic perspective, Science, 350, aac9323, https://doi.org/10.1126/science.aac9323, 2015. Massana, R., Pedrós Alió, C., Casamayor, E. O., and Gasol, J.
M.: Changes in marine bacterioplankton phylogenetic compo-sition during incubations designed to measure biogeochemi-cally significant parameters, Limnol. Oceanogr., 46, 1181–1188, https://doi.org/10.4319/lo.2001.46.5.1181, 2001.
McCallister, S. L. and del Giorgio, P. A.: Evidence for the res-piration of ancient terrestrial organic C in northern temperate lakes and streams., P. Natl. Acad. Sci. USA, 109, 16963–16968, https://doi.org/10.1073/pnas.1207305109, 2012.
Newton, R. J., Jones, S. E., Eiler, A., McMahon, K. D., and Bertilsson, S.: A Guide to the Natural History of Freshwa-ter Lake BacFreshwa-teria, Microbiol. Mol. Biol. Rev., 75, 14–49, https://doi.org/10.1128/MMBR.00028-10, 2011.
Oksanen, J., Blanchet, F. G., Kindt, R., Legendre, P., O’Hara, R. B., Simpson, G. L., Solymos, P., Stevens, M. H. H., and Wagner, H.: Vegan: community ecology package, 2011.
Pastor, A., Catalán, N., Nagar, N., Light, T., Borrego, C. M., and Marcé, R.: A univerisal bacterial inoculum for dissolved organic carbon biodegradation experiments in freshwaters, Limnol. Oceanogr.-Meth., 16, 421–433, https://doi.org/10.1002/lom3.10256, 2018.
Peacock, M., Freeman, C., Gauci, V., Lebron, I., and Evans, C. D.: Investigations of freezing and cold storage for the anal-ysis of peatland dissolved organic carbon (DOC) and ab-sorbance properties, Environ. Sci.-Proc. Imp., 17, 1290–1301, https://doi.org/10.1039/c5em00126a, 2015.
Peura, S., Eiler, A., Bertilsson, S., Nykänen, H., Tiirola, M., and Jones, R. I.: Distinct and diverse anaerobic bacterial communities in boreal lakes dominated by candidate division OD1, ISME J., 6, 1640–1652, https://doi.org/10.1038/ismej.2012.21, 2012. Price, M. N., Dehal, P. S., and Arkin, A. P.: FastTree:
Com-puting Large Minimum Evolution Trees with Profiles in-stead of a Distance Matrix, Mol. Biol. Evol., 26, 1641–1650, https://doi.org/10.1093/molbev/msp077, 2009.
Raymond, P. A., Hartmann, J., Lauerwald, R., Sobek, S., Mc-Donald, C., Hoover, M., Butman, D., Striegl, R., Mayorga, E., Humborg, C., Kortelainen, P., Dürr, H., Meybeck, M., Ciais, P., and Guth, P.: Global carbon dioxide emissions from inland wa-ters, Nature, 503, 355–359, https://doi.org/10.1038/nature12760, 2013.
Rösel, S., Allgaier, M., and Grossart, H.-P.: Long-Term Character-ization of Free-Living and Particle-Associated Bacterial Com-munities in Lake Tiefwaren Reveals Distinct Seasonal Patterns, Microb. Ecol., 64, 571–583, https://doi.org/10.1007/s00248-012-0049-3, 2012.
Sipos, R., Szekely, A. J., Palatinszky, M., Revesz, S., Marialigeti, K., and Nikolausz, M.: Effect of primer mismatch, anneal-ing temperature and PCR cycle number on 16S rRNA gene-targetting bacterial community analysis, FEMS Microbiol. Ecol., 60, 341–350, https://doi.org/10.1111/j.1574-6941.2007.00283.x, 2007.
Smith, C. J. and Osborn, A. M.: Advantages and limita-tions of quantitative PCR (Q-PCR)-based approaches in microbial ecology, FEMS Microbiol. Ecol., 67, 6–20, https://doi.org/10.1111/j.1574-6941.2008.00629.x, 2009. Spencer, R. G. M., Mann, P. J., Dittmar, T., Eglinton, T. I.,
McIn-tyre, C., Holmes, R. M., Zimov, N., and Stubbins, A.: Detecting the signature of permafrost thaw in Arctic rivers, Geophys. Res. Lett., 42, 2830–2835, https://doi.org/10.1002/2015GL063498, 2015.
Traving, S. J., Bentzon-Tilia, M., Knudsen-Leerbeck, H., Man-tikci, M., Hansen, J. L. S., Stedmon, C. A., Sørensen, H., Markager, S., and Riemann, L.: Coupling Bacterioplank-ton Populations and Environment to Community Function in Coastal Temperate Waters, Front. Microbiol., 7, 1533, https://doi.org/10.3389/fmicb.2016.01533, 2016.
Vähätalo, A. V. and Wetzel, R. G.: Long-term photochemical and microbial decomposition of wetland-derived dissolved organic matter with alteration of13C:12C mass ratio, Limnol. Oceanogr., 53, 1387–1392, https://doi.org/10.4319/lo.2008.53.4.1387, 2008.
Vonk, J. E., Tank, S. E., Mann, P. J., Spencer, R. G. M., Treat, C. C., Striegl, R. G., Abbott, B. W., and Wickland, K. P.: Biodegradability of dissolved organic carbon in permafrost soils and aquatic systems: a meta-analysis, Biogeosciences, 12, 6915– 6930, https://doi.org/10.5194/bg-12-6915-2015, 2015.
Wang, Y., Hammes, F., Düggelin, M., and Egli, T.: Influence of Size, Shape, and Flexibility on Bacterial Passage through Micro-pore Membrane Filters, Environ. Sci. Technol., 42, 6749–6754, https://doi.org/10.1021/es800720n, 2008.
Wood, S.: Generalized Additive Models, Chapman and Hall/CRC, New York, 2006.