1-1-1991
Computer simulation of arterial blood flow under
external acceleration
Douglas A. Cornet
Iowa State University
Follow this and additional works at:
https://lib.dr.iastate.edu/rtd
Part of the
Engineering Commons
This Thesis is brought to you for free and open access by the Iowa State University Capstones, Theses and Dissertations at Iowa State University Digital Repository. It has been accepted for inclusion in Retrospective Theses and Dissertations by an authorized administrator of Iowa State University Digital Repository. For more information, please [email protected].
Recommended Citation
Cornet, Douglas A., "Computer simulation of arterial blood flow under external acceleration" (1991).Retrospective Theses and Dissertations. 17996.
1
f
Computer simulation of arte rial blood flow unde r external acceleration
by
/
Douglas A. Cornet-
.
A Thesis Submitted to the ·G raduate Faculty in Partial Fulfillment of the
Requirements for the Degree of
.YIASTER
0 F'
SC' I E ~C'EMajor: Biomedical Engi neeri ng
Signatures have been redacted for privacy Signatures have been redacted for privacy
Iowa State University Ames, Iowa
TABLE OF CONTENTS
NOMENCLATURE ... .
CHAPTER 1. IN TRODUCTIO N
CHAPTER 2. LITERATU RE REVIEW
Gravitational Lo s of Consciousness .. ... Physiological Response to -G:: Acceleration
Systemic circulation . Cerebral circulation Improving G-TOL Stenoses .. .
CHAPTER 3. THE COMPU TER MODEL
Mathematical Model ... Governing equations Boundary conditions Stenosis ..
Acceleration P hysiological Model .
Centrifuge experimental data -:'fomerical Solution
Xll
l
6 6
9 10 1
21
2
30 31
31
33
3,5
Compensatory ~1echani sms ... .
CHAPTER 4. SENSITIVITY TO I N P UT PARAMETERS .
Heart Rate and Card iac Out put
Peripheral Resist ance .
External Acceleration .
CHAPTER 5. EFFECTS OF -r G :: ACCELERATION AND
COM-PENSATION ...
upine versus tanding .
Hyper-G ravity ... .
Acceleration of - 2 G::
Accelerations of + 3
C:::
Effects of Anti-G Suits
Effects of tenosis . . .
C HAPTER 6. C ONCLUSIONS AND RECOMMENDATIO NS
AC K N OWLEGEMENTS
BIBLIOGRAPHY . . .
APPENDIX. PROGRAM SOUR CE CODES PQYPLOT
FLOW ...
C'ONTROLO
'*
-!9
.so
.56
62
70
70
11
71
2
3
9
93
96
97
102 102
Table 2.1:
Table 2.2:
Table 3.1:
Table 3.2:
Table 3.3:
Table 3.4:
Table 3.5:
Table 3.6:
Table 3. 7:
Table 4.1:
Table 4.2:
Table 4.3:
Table 4.4:
LIST OF TABLES
USAF S l\I G- LO C incapacitation times
Effect of seat back angle on G-TO L . . .
Fourier coefficients for the proximal flow wa\·eform
Arterial geometric data .
Terminal impedance data
24
34
3 -lO
Human physiological response to - G.: acceleration in literature 42
Animal physiological response to
+ G.:
acceleration . . . 44Human response to + G.: acceleration while wearing anti-G suits 45
The Standard .\Ian in - G.: acceleration . . . 45
.\lean pre sures and flows in the L. external carotid and
fem-oral arteries with varying heart rate . . . .52
.\lean pre sures and flows in the L. external carotid and
fem-oral arteries with varying st roke volume . . . ,59
Mean pressures and flows in t he L. external carotid and
fem-oral arteries with varying systemic periperal resistance . . . . .59
Mean pressures and flows in the L. external carotid and
Table 4 .. 5: Mean pressures and flow s in the L. external carotid and
fem-oral arteries with varying -G:: accele ration . . . 6.S
Table .5.1: lean pressures and flows in the L. external carotid a nd
fem-oral arteries during - 1 G:; . . . ... 73
Table .5.2: L. external carotid artery pressure waveforms in the fully com
-pensated - 2 G:: model . . . 79
Table 5.3: L. external carotid artery pressure waveforms in the -,--3 G :;
Figure 1.1:
Figure 1.2:
Figure 1.3:
Fiaure 2.1:
Figure 2.2:
F igure 2.3:
F igure 2.4:
Figure 2.5:
Figure 2.6:
Figure 2. 7:
LIST OF FIGURES
Turn forces versus bank angle
Aircraft and pilot coordinate fram e
Effects of u tained G-forces ....
Turn rate. velocity. and G-force nomogram . .. ..
Hydrost atic col umn effect during - G.: acceleration .
Effect of + G .: induced hydrostatic pressure gradients on mean
arterial blood pressure in a seated man
C hange in calf rnlume with - G.: ... .
'.\eural pat hways for regulatina y temic blood pressure
Pressure drop in arterial circulat ion .
Function of the precapillary sphincter
2
3
4
7
9
10
11
13
16
17
Figure 2. : Total peripheral resist ance versu - G.: 1
Fiaure 2.9: Cerebral blood flow versus mean arte rial blood pres ure 20
Figure 2.10: Temporal flow \·elocity. eye-level blood pressure. and + G.:
acceleration versus t ime 22
Figure 2.11 : Head-tilt and PALE seats 23
Figure 2.13: l\Iean arterial blood pressure versus posi tive pressure
breath-ing and G-suit s
Figure 3.1: Coefficients of wall shearing stress for simple harmonic flow in
a straight , rigid tube
Figure 3.2:
Figure 3.3:
Figure 3.4:
Figure 3 .. 5:
Figure 4.1:
Figure 4.2:
Figure 4.3:
Figure 4.4:
Modified windkessel model
Geometry of an arterial stenosis
Geometric model . . . .
Outputs of the initial boundary flow condition F LO W and
PQYPLOT for a heart rate of 120 bprn . . . .
Pressure waveforms in the R. and L. external carotid arteries
Flow waveforms in the R. and L. external carotid arteries
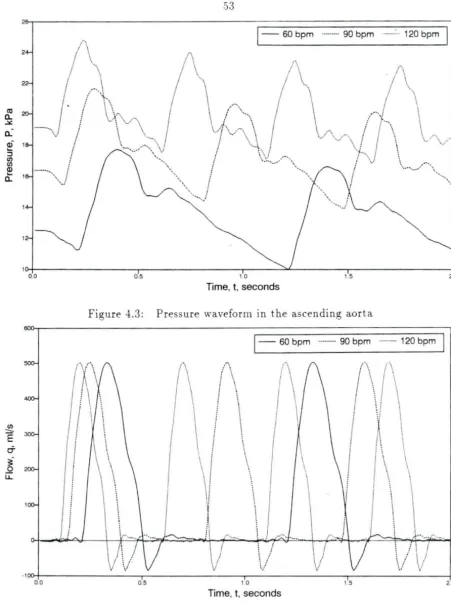
Pressure waveform in the ascendi ng aorta .. .
Proximal flow condition in the ascending aorta
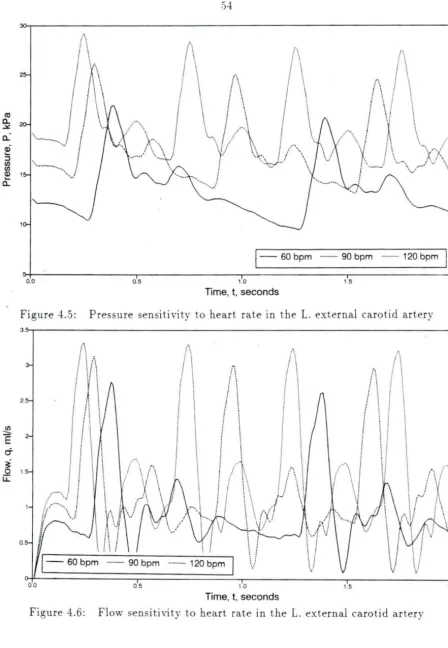
Figure 4.5: Pressure sensiti vity to heart rate in the L. external carotid
artery ... . . ... . . . .
27
32
34
35
37
47
.51 .51
,53 ,53
54
Figure 4.6: Flow sensitivity to heart rate in the L. external carotid artery .)4Figure 4. 7: Pressure sensitivity to heart rate in the femoral artery .5.5
Figure 4. : Flow sensi ti vi ty to heart rate in the femoral artery . . .).)
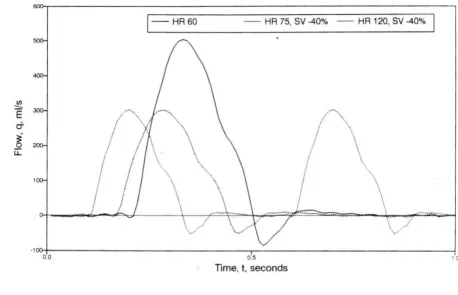
Figure 4.9: Input A.ow boundary condition with decreased stroke volume .56
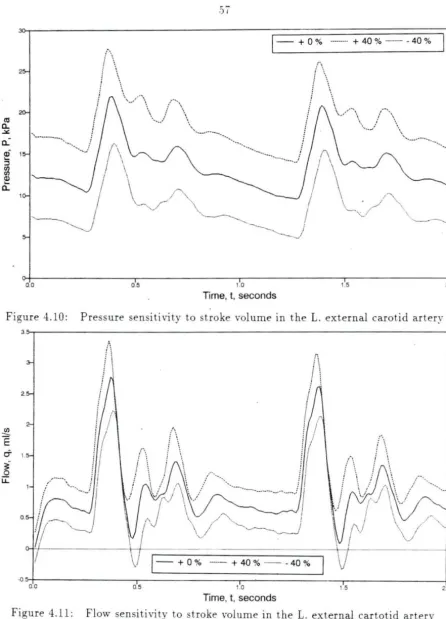
Figure 4.10: Pressure sensitivity to stroke volume in the L. external carotid
artery . . . .5 ·7
Figure 4.11: Flow sensitivity to stroke volume in the L. external cartotid
Figure 4.12: Pressure sensitivity to stroke volume in the femoral artery .J
Figure 4.13: Flow sensiti vity to stroke volume in the femoral artery . . .5
Figure 4.14: Pressure sensitivity to systemic peri pheral resistance in the L.
external carotid artery . . . 60
Figure 4.15: Flow sensit ivity to systemic peripheral resistance in the L.
external carotid artery 60
Figure 4.16: P ressure sensitivity to systemic peripheral resistance in the
femoral artery . . . 61
Figure 4.17: Flow sensitivity to systemic peripheral resistance in the
fem-oral artery . . . 61
Figure 4.1 Pressure sensitivi ty to cerebral peripheral resistance in the L.
external caro tid a rtery 63
Figure 4.19: Flow sensitivity to cerebral peripheral resistance in the L.
ex-ternal carotid artery . . . 63
Figure 4.20: Pressure sensiti vity to cerebral peripheral resista nce in t he
femoral artery . . . 64
Figure 4.21: Flow sensitivity to cerebral peripheral resistance in the
fem-oral artery . . . 64
Figure 4.22: Effect of J..G= acceleration on the pressure waveforms in the
ascending aorta . . . 66
Fig ure 4.23 : Effect of -rG
=
accele ration on the flow waveform s in t heas-cending aorta (proximal boundary con di ti on ) . . . 66
Figure 4.24: Effect of ..L G= acceleration on the pressure waveforms in the
Figure 4.2.5: Effect of - G:: acceleration on the flow waveform tn the L.
external carotid artery 67
Figure 4.26: Effect of -r- G:: acceleration on the pressure wa\·eforms in the
femoral a rtery . . . 6
Figure 4.27: Effect of
-r-G::
acceleration on the flow waYeforms in thefem-oral artery . . . 6
Figure 5. 1: Effect of literature values of 1 1 G:: compensation on t he
pres-ure wa\·eforms in the L. external carotid artery 72
Figure .S .2: Effect of literature values of 11 G.: compensation on the flow
wa\·eforms in the L. external carotid artery . . . 12
Figure .) .3: L. external carotid artery pres ure waveforms in t he - 1 G.:
fully com pe n sated model . . . 'i 4
Fi au re .S.4: L. external carotid artery flow waveforms in the - 1 G.: fully
compen ated model ..
Figure .S .. 5: Femoral artery pressure waveforms in the - 1 G.: fully
com-pensated model . . . 7.5
Figure .5 .6: Femoral a rtery flow waveforms in the -1 G:: fully com pe
n-sated model
Figure -5.7: Effect of literature rnlues of ...L2 G.: compensation on pressure
waveforms in the L. external carotid artery .. . ..
Figure .S. Effect of literature values o f - 2 G.: compensation on flow
waveforms in the L. external carotid artery ...
Figure -5.9: L. external carotid artery pressure waveforms in the - 2 G.:
( .)
7
Figure .5.10: L. external carotid artery fl.ow wa\·eforms in the -'-2 G.: fully
compensated model . . . 0
Figure 5.11: Femoral arter y pressure waveforms in the - 2 G.: fully
com-pensated model 1
Figure .5.12: Femoral artery flow waveforms in the ..L2 G.: fully
compen-sated model 1
Figure 5.13: Effect of 2 psi inflation of a five bladder G-suit and a 9·73
abdominal occlusion on pressure waveforms in the ascending
aorta at - 1 G.: 5
Figure .5.14: Effect of 2 psi inflation of a five bladder G-suit and a 97%
abdominal occlusion on fl.ow waveforms in the ascending aorta
at ..L l
G.: ...
,5Figure .5.15: Effect of 2 psi inflation of a fi ve bladder G-suit and a 97%
abdominal occlusion on pressure waveforms in the L. external
carotid artery at
+
1 G .: . . . 6Figure .5 .16 : Effect of 2 psi inflation of a five bladder G-suit and a 97%
ab-domina.l occlusion on fl.ow waveforms in the L. external carotid
artery at + 1 G .: . . . 6
Figure .5.17: Effect of 2 psi inflation of a five bladder G-suit and a 97%
ab-dominal occlusion on pressure waveforms in the femoral artery
at , 1
G.: .... . . . .
~I
Figure .5 .1 Effect of 2 psi inflation of a five bladder G-suit and a 97%
abdominal occlusion on flow waveforms in the femoral artery
Figure .5.19: Mean pressures in the L. external caro tid artery versus
per-centage stenosis and - G.: accelera tion . . . 90
Figure .5.20: Mean flows in the L. external carotid arte ry versus percentage
N OMENCLATURE
a cross-sectional a rea
.40 cross- ectional a rea at reference pres ure
A s cro s- ectional lumen area in stenosi
bx body-force vector component in axial direction
Ct• ,·iscous term coefficient in wall shearing stres equat ion
cu inertial term coefficient in wall shear stre s equation
C a rterial compliance
c6
modified linear compliance coefficientC'~ modified non-linear compliance coefficient
Cy volume compliance of terminal impedance
D arteri al diameter
G gra \·itational acceleration
Kt turbulence coefficient in tenosis equation
K u unsteady flow coefficient in stenosis equation K c vi cous coefficient in ste no is equation
L
segment lengthLs
stenosis lengthP.
p
mean pressureq instantaneous flow
ij mean flow
R segment radius
R1 proximal resistance of terminal impedance (small vessel term )
R2 distal resistance of terminal impedance (arterioles and capillaries)
RT
total resistance of terminal impedancetime
.r
Jl
II
p
Subscripts:
a
segment axial coordinate and body ventral coordinate
body sagittal coordinate
dimensionless frequency ( Wormersley parameter ) time increment
dimensionless velocity profile coefficient fluid dynamic viscosity
fluid kinematic viscosity
fluid density
basic circular frequenc y of a pulse
arterial
CHAPTER
1.INTRODUCTION
Ce n'est pas la resistance de la matiere qui sera la limite des performances aerobatiques de l'oiseau artificiel , mais bien la resistance physiologique de
l'homme, qui en est le cerveau. 1
-Louis Bleroit
During World War I, t he study of gravitational loss of consciousness ( G-LOC' ) was born. In 1918, Henry Head reported on a test pilot that had blacked out after
pulling + 4.5 Gs in his Sopwith Triplane (Voge, 1980 ). In an attempt to prevent further episodes, researchers at that time primarily concerned themselves with physi-ological compensation of acceleration stress. The anti-gravitational suit (G-suit ) was created to directly oppose the downward movement of blood under external
accel-eration by forcing blood that pooled in the lower extremities back into the thoracic cavity. This was accomplished by the pilot wearing a pair of t rousers that inflated when he experienced
+
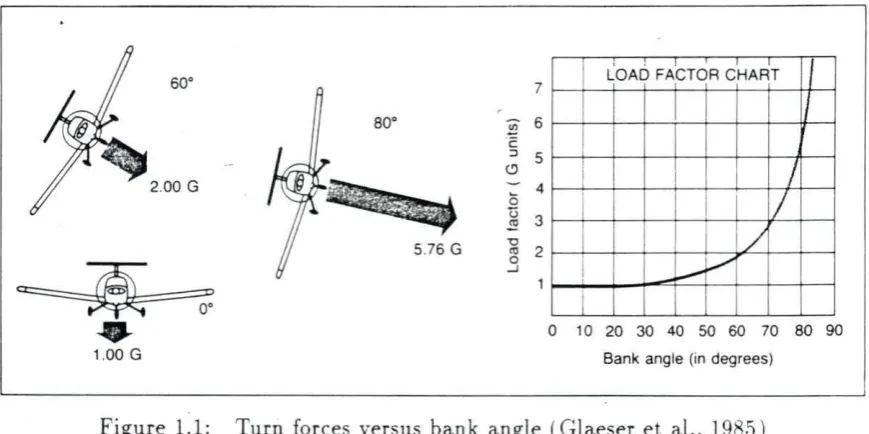
G.:: (head-to-foot) acceleration.Modern high-performance aircraft are capable of high speed , altitude , turn rates. and G-loading. For example , at Mach 2 (twice the speed of sound ), a General
nam1cs F-16 Fighting Falcon can bank 83.6° and turn 1 0° in just over 16 seconds .
.-\s shown in Figure 1.1 centripetal acceleration on the airframe is nine times that of
gravity. In other words, the pilot weighs nine times that which he weighed standing
on the surface of the earth.
1 • I I I
so·
7 LOAD FACTOR CHARTso·
~ 6c ::J 5 (.'.)
a 4
u 3
~
5.76 G -0
'° 2
0
_J
J
I
/
I
-~v
2.00 G
~
.... 0 10 20 30 40 50 60 70 80 901.00 G Bank angle (in degrees)
Figure 1.1: Turn forces versus bank angle (Glaeser et al., 198.5 )
Traditionally, the loading of an airframe is stated in multiples of gravitational
force called G-forces or Gs. By this convention , positive acceleration (in excess of
lG) is when an airframe is accelerated upward and negative acceleration when an
airframe is accelerated downward. as shown in Figure 1.2. The gravitational load
acts in t he opposite direction; a positive acceleration as shown in Figure 1.2 creates
a positive G-load in the opposite direction.
The acceleration due to earth's gravitational field acts in the positive direction
as well , creating a gravitational force (load) towards the center of the earth. An
object resting on the surface of the earth does not fall to the center of the earth
[image:16.572.82.517.197.414.2]Roll about the longitudinal
axis.
Positive G
Pitch about the lateral
Yaw about the vertical
axis. Negative G
Figure 1.2: Aircraft and pilot coordinate frame (Glaeser et al. , 198.5 )
direction. This load is, by definition, + 1
G.: .
During positive acceleration, hydrostatic pressure is increased in the arteries, hampering cerebral circulation. Blood pools in the lower extremities as shown in Figure 1.3. If induced hydrostatic pressure becomes greater than head-level arterial blood pressure, cerebral flow ceases and a loss of consciousness results.
Gravitational loss of consciousness, or G- LO C, is one of t he leading causes of pilot fatality and loss of aircraft. At Mach 2. an aircraft travels over 2000 feet per second. If a pilot is unconscious for only 24 seconds, (a conservative time) she will regain control of t he aircraft 10 miles away from where she blacked out.
(a)
Effects on pilot
(b)
As acceleration starts. blood begins to pool
,,
...
Blood pools 1n the head: face feels flushed
Pooling increases. vision begins to fade (grayout)
Effect continues: Foot
to head
Blackout occurs at about 5 Gs because of lack of blood in brain.
v1s1on begins "Red out" occurs: with to redden. feeling of eyes popping out
Figure 1.3: Effects of sustained G-forces (Glaeser et al.. 19 .) )
straining techiniques such as the Valsalva and .\I-1 maneuvers are techniques used in modern fighter aircraft. As aircraft become faster and more maneuverable. such as the YF-22 Advanced Tactical Fighter proposed by Lockheed and General Dynamics, new techniques and/ or expansion of t he existing techniques will be required. Only a thorough underst anding of the effect of acceleration on the cardiovascular system will allow the development of new techniques and devices.
qual-itative press ure and flow endpoints of a pilot's consc10usness. computer models are
being developed to study the hemodynamics of - G.:: acceleration. The present study integrates the findings of acceleration physiologist s into a previously developed com-puter model of the human arterial system. The several purposes of this study are:
• Integrate - G.:: acceleration physiological data found in literature into an arterial flow computer simulation.
• Evaluate the sensitivity of the model to various physiological parameters.
• Investigate the manner in which the human body compensates for -G.:: accel-eration loads.
• Compare simulated - 0 G.: {supine ) and + l G.:: (standing ) models with exper-imental data found in literature.
• Compare high-G.:: (greater than ..J... l G.::) models with human centrifuge data found in literature.
• Investigate ways to model an anti-G sui t and compare models with human centrifuge data.
• Determine the effect of stenoses on blood flow under external acceleration.
CHAPTER 2. LITERATURE REVIEW
Posit ive acceleration ( headwards) of a human increases hydrostatic pressures
within the arterial tree as the apparent weight of every part of the person inc reases
proportionally wit h the magnitude of the acceleration. Conversely. acceleration down·
wards (foot.wards) decreases hydrostatic pressures and apparent weight. Positive
upwards acceleration (+G.:) crushes a pilot into his seat while a negative upwards
acceleration (-G.:) pushes a pilot off his seat and into his harness . A - 1 G.:
accelera-tion is that which is felt while standing on the earth 's surface at sea-level. Figure 2.1
is a nornogram relating aircraft velocity, turn rate. and G-forces developed.
Gravitational Loss of Consciousn ess .
High sustained + G.: acceleration ( HSG) is defined as T 6 G.: or higher
accel-eration for 1.5 seconds or longer at maximum G (Burton et al.1 1974) . HSG drops
head-level blood pressure sufficiently to cause a loss of consciousness (G-LOC' ) in the
unprotected. relaxed pilot. G-suits. straining maneuvers. and pilot conditioning can
raise a pilots tolerance to G-LOC' (G-TOL).
Symptoms prior to G-LOC may include (in order ): fatigue, perspiration . cough
(especially if the pilot is breathing a high oxygen mixture), a feeling of warmth, calf
Figure 2.1: Turn rate. velocity. and G-force nomogram (Gaur. 196lb )
called tunnel-vision or grayout (Burton et al., 19i4; Gauer. 196l ~a] ; Gilles. 196.5;
Gillingham. 19 : Glaister. 1990; Krutz et al.. 1973; Sandler et al., 1971; Voge. 19 0: Whinnery. 19 ). PLL begins as the retinal beds become starved for oxygen due to impaired cerebral circulation. Tunnel-vision becomes more pronounced with -G.: duration of up to 5 seconds or an increase in ..J..G.: . PLL progresses until LO~\IIA ( Limitation of Ocular Iobility under Acceleration ). loss of hearing and1or Central Light Loss ( CLL ), also called blackout. occur. Shortly following LO~IA and C'LL is
G-LOC . During HSG, G-LOC' follows CLL by 4- 5 seconds (Glaister, 1990 ).
search efforts to determine man·s G-TOL and finding ways to improve it. As aircraft
turn rates continue to improve, finding more effective methods of raising G-TO L
be-comes paramount. Most research conducted by the United States Air Force School of
Aerospace Medicine (US AFSA.M) and the Naval Air Development Center (N ADC )
includes cent rifuge experiments on man and animals to determine how long a
pi-lot can maintain consciousness. T hese same st udies have also yielded data on how
long a pilot remains incapable of controlling his aircraft after G- LOC (\rVhinnery,
1988). Table 2.1 shows the results of the lTSA. F SAM and NADC studies on
inca-pacitation times. ROR stands for Rapid Onset Run, meaning a high rate of turn
and G-force development . ROR is freque.ntly encountered in fighter aircraft. GOR
stands for G radual Onset Run meaning a slow. gradual G-force development.
usu-ally of low magnit ude. GOR is encountered in the Space Shuttle during its reentry.
Incapacitation times are listed in seconds . Two forms of incapacitation were found:
unconsciousness (absolute incapacitation ) followed by a period of disorientation and
confusion ( relative incapacitation ).
Table 2.1 : USAF SAM G- LOC incapacitation times (Whinnery, 19 8 )
lncapacitation(s)
Group /\'
Absolute Relative Total
All 55 16 15 31
GOR 34 19 16 35
ROR 21 12 12 24
Type I G-LOC 38 15 13
28
Physiological Response to +G :: Acceleration
As hydrostatic pressures increase with
+G::
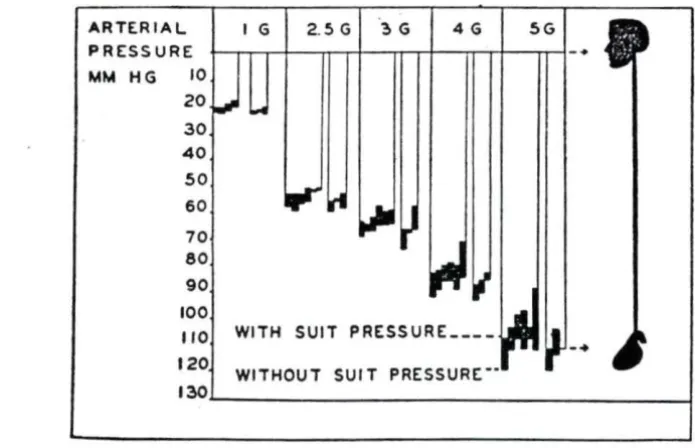
acceleration. blood tends to pool atthe feet, reducing head-level blood pressure without any change in ventricular pres-sure. The heart must develop a higher output pressure to maintain cerebral pressure against the hydrostatic gradient. Figure 2.2 dramatically shows the hydrostatic effect on a seated pilot at + l G:: and at + 6 G:; . Without any other changes in the arterial circulation. man would lose consciousness at - .) G:: (Burton et al.. 19i4 ). However. many physiologic changes occur, both adverse and beneficial. to change the G- LO C' point of the unprotected man .
ARTER I AL IG 2.5 G ~ G 4G SG
PRESSURE
MM HG 10
zo
30 40
50
60 70 80 90 100
110 WITH SUIT PRESSURE ___ _ 120 WITHOUT SUIT PRESSURE: --130
Figure 2.2: Hydrostatic column effect during -G:: acceleration (Gaur. 196la)
During HS G, blood pools in the lower extremities, reducing cardiac output. Heart rate and total peripheral resistance rise to try to raise cerebral blood pressure.
-r
[image:23.572.100.448.344.568.2]\·en-tricular v:olume. central blood vessel diameter. and arterial p02 start to fall. Cerebral peripheral resistance falls to improve cerebral circulation. A complete description of these HSG effects and the body's compensa tory mechanisms follows.
Syst emic circulation
In 1886, Wagner introduced the Hydrostatic Indifference Point (HIP ): a natural reference point for measuring changes in hydrostatic pressure. The pressure at this
point is constant and not a function of position or G acceleration (Gaur. 196la: Glaister , 1990). The HIP for the human body arterial system is located at about the level of the aortic valve. Figure 2.3 shows the HIP in a seated man as a function of
-G=· It can be seen that the eye-level mean arterial blood pressure in an unprotected man will drop to zero mm Hg at just over + 5 G
=.
This is siightly lower than Burton ·s observation of - 6 G= .'Wtfflc al 01tance from heat! Cm l
o~
0
· •O '--~..._~__.~...__._~__.~~....__..~
-100 0 100 200 300
[image:24.572.159.439.420.620.2]"'4 .. n .,,.,,., ptHoure !mm Hg)
e
0
Q
'
e
0 20 40 60 80 100
TIME, sec
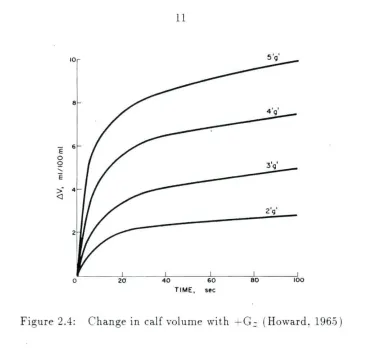
Figure 2.4: Change in calf volume with + G.: (Howard, 196.5)
Although this hydrostatic pressure drop occurs instantaneously with the onset
[image:25.570.113.492.55.403.2]Hypotension and hypornlemia trigger sec retion on arginine vasop ressin (an
anti-diuretic ) by the posterio r pituitary gland (Ganong, L9 9). Thee hormones may
not counteract fluid lo in acute -G.: exposure. but may increa e G tolerance with
repeated expos ures ( Glaister. 1990 ).
Positi\·e G.: fo rces compress the heart muscle along its longitudinal axis. reducing
ventricular volume (stroke vol ume) and furth er reducing cardiac output (Erickson.
1976; Burton et al., 1974). Leverett et al. (197.5) found a drop in conlractility
(dP dt) of t he left vent ricle in dogs during centrifuge experiments.
Located in the walls of the aortic arch and the carotid sinu are stretch receptors
known as baroreceptors. t retch receptors are very sensitive to change in
arte-rial blood pressure. l"nder normal a rteri al pressure ( nominally 100 mm Hg) . these
baroreceptors send impulses to the brain at a basal frequency. T hese impulses inhibit
discha rge of vasoconstricti ve neurons a nd excite the cardiac vagus nerve. which
af-fect s a drop in heart rate (bradycardia ). Any reduction in arterial pressure lowers the
firing frequenc y of baroreceptor cells causing less in hibition of sympathe tic neurons
that increase heart rate ( tachycardia) and less excitat ion of neurons that produce
bradycardia. S timulation of the vag us nerve lower s heart rate. The reflex reduction
in inhibition ( relati\·e increase in stimulation ) of the sympathetic adrenergic efferents
(vasocons trictive nerves) stimulates t he vasomotor center of the brain (VMC) and
increa es heart ra te and cont ractility (Figure 2 .. 5 ). These factors lead to a rise in
ar-terial flow and systolic pressure (Chien, 19 .5; Forster and Whinnery. 19 ; Ganong .
19 9; Gaur and alzman. 1961; Glaister, 1990; \ 'oge . 19 0 ).
Occasionally, a drop in heart rate occurs just a t
+
G.: onset a nd precedes t heIX
Aortic
arch
Baroreceptor afferents
IGlul
x
Bulbospinal pathway (E)
NTS
Thoracic cord
( 1976) both observed t his phenomenon in canrne centrifuge studies. Two p ossible explanations have been offered by Erickson et al. and Glaister ( 1990). Glaister notes that the carotid sinus is located at a lower hydrostatic pressure point than the aortic arch during -G.:; . At + 9 G.:;, the pressure difference between these two baroreceptor sites could be as much as 100 mm Hg. Immediately following +G.: onset , the carotid sinus stretch receptor senses t he pressure drop and would stimulate the VMC. The
aortic arch stretch receptors, however, would not see a hydrostatic change, being near the HIP, nor would they see a pressure change due to a blood volume loss t his soon and would act to counteract the stimulation of the YMC'. o change in blood
pressure would occur.
Erickson's centrifuge experiments ( 1976) involved cineradiographic (X-ray mo-tion pictures) studies which revealed a marked diameter reducmo-tion and elongamo-tion in the blood vessels central to the heart. This mechanical stretching of the artery t riggers the stretch receptors in the aortic arch to increase their discharge frequency which stimulates the cardiac vagus nerve and produces what Leverett calls "high G bradycardia," (Burton et al., 197 4). The carotid sinus receptors and cerebral ischemia would eventually (about .5 seconds post-G onset ) sense t he blood pressure drop and trigger the YMC , increasing heart rate and contractility. This suggests why this brad ycardia is never seen at or beyond maximum G. Dogs who did not exhibit this behavior tended to develop higher cerebral pressures at + Gz and compensated better (Erickson, 1976 ).
duration of systole decreases from 270 ms at a heart rate of 7.5 bpm to 160 ms at a heart rate of 200 bpm - a 413 drop . Diastolic duration. however. drops from .530 ms to 140 ms for heart rates of 7.5 bpm and 200 bpm, respectively - a 633 drop
(Ganong, 19 9).
Another function of t he baroreceptor's relative stimulation of the sympathetic nervous system is t he increase of peripheral resistance (Ganong, 1989; Glaister, 1990 ). Peripheral resistance is a measure of the pressure drop across a blood Yessel or cap-illary bed for a given flow rate. For any vascular bed, peripheral resistance (PR) is measured by:
PR =
q
(J!ABP -
.ui·P ) ( 2.1)where MABP
=
mean arterial blood press ure, MVP=
mean venous blood pressure, andq
= mean flow.Pressure drop is greatest across the arterioles (Figure 2.6), up to 603 of the total 100 mm Hg drop th at normally occurs in t he human arterial t ree (Caro. 1978; IcDonald. 1974; Milnor, 1982). In studies of hypertensive and hypotensive cats, Fung ( 1984) found that the pressure drop across the arterioles varied most with variations in central arterial pressure. He concluded that the arterioles function to maintain a const ant capillary pressure. The control mechanism is believed to be primarily t he contraction and dilatation of t he metarterioles and precapillary sphincters as shown in Figure 2.7 (Ganong, 1989; Martini . 19 9).
Glais-120
Ol :r 90
-E
E
0
-..
~~
0 ~!
...
~
"'
_..,
..
~-> 0 ;:; ~
-;o G> ~ a
E::
.,
...
..
u. F igure 2.6: Pressure drops in arterial circulation (_Caro et al. , 191 )
ter, 1990). Norepinephrine (NEph) and epinephrine (Eph) increase heart rate and ·
contractility. Eph produces vasoconstriction in most organs and muscles . Eph.
however, causes skeletal muscle vessels to dilate and t hus lower peripheral resistance
(Ganong, 19 9 ). Since human centrifuge studies have shown that peripheral resis-tance does increase, one could conclude t hat Eph is not secreted by the adrenal
medulla in great amounts. One explanat ion for the higher than normal levels of Ep~
in the blood is leakage from sympathetic synapses that utilize Eph (Glaister. 1990 ). Such neurons are found in the inhibitory pathway of t he baroreceptors (Figure :2..5 ).
Peripheral resistance rise as a function of G:: up to 1 G but has been found to rise linearly with G.: after 1 G as shown in Figure 2.8 (Howard, 1965 ).
Precap1llary sphineter
I
2'
VI
I-z IOO
::>
-
.... u..9 z
::> !1=
I
.... u 7~
z
~
VI
iii
....
a:: a::
~
...J
50 ::>
u VI
~
Figure 2. Total peripheral resistance versus
,G:
(Howard , 196.S)unchanged or even increased. Total cardiac output was down .543 , but 33% of the
cardiac output went to the myocardium. HoweYer, even coronary circulation may be compromised at higher
-G:
levels.Cerebral circulation. the improvement of which is the entire purpose for
increas-mu central arterial pressure. is not inhibited by any systemic vasoconstriction. In
fact, cerebral blood vessels dilate to improve cerebral flow.
Cerebral circulation
During acceleration. Peripheral Light Loss ( PLL ). or tunnel vision. occurs when
no longer perfu e the retina when the mean eye-le,·el blood pressure is less than 20
mm Hg (Burt on et al.. 197-1; Burns et al.. 19 6: Glaister. 1990; Krutz et al.. 1973 :
Leverett et al. , 1973).
Researchers in the 1950s and 1960s concluded that retinal flow ceases at 20 mm
Hg because the intraocular pressure of 20- 25 mm Hg set up an occlusive pressure
gradient. However. transcutaneous Doppler ultrasound studies ha Ye shown that flow
in the superficial temporal a rtery stops at an arterial mean pressure of 20 mm Hg.
This suggests flow cessation occurs at the critical closing pressure oft he artery rather
than because of an occlusive pressure gradient in the capillary bed .
The uperficial temporal artery is frequently used in - G.: physiology re earch
because it is close to t he skin and flow is easily measured by ultraso und . It is at
eye-level a nd therefore has the same hydrostatic pressures as the eye. Flow cessation
in this artery coincides with PLL, and flow cessation always precedes G- LO C by 2- 20
seconds unde r constant and increasing - G.: (Sandler et al.. 1977).
The response of the cerebral vascular bed to variations in arterial pressure
main-tai ns a constant cerebral blood flow. Similar to systemic capillary regulation,
dilata-tion of the cerebral vessels occurs during hy potension and constri cdilata-tion during
hy-pertension. Figure 2.9 shows cerebral blood flow ( C BF ) versus mean arterial blood
pressure (\IABP). At -Ll G.:, constant flow is maintained over an arterial pressure
range of 50- 144 mm Hg (Chien. 19 .5; McCulloch, 19 ). Below .SO mm Hg, cerebral
blood flow falls in direct proportion to drops in p erfusion pressure (difference between
arterial pressure and veno us pressure). Decreasing cerebral blood rlow increases the
partial pressure of C'02 (p C02) in the brain and reducing its p02. An increase in
of 02 per unit volume of blood {Ganong. 19 9 ).
C OF
100
'
Hypoxia
o>---~----..---...-0 100
MABP
Figure 2.9: Cerebral blood fl.ow versus mean arterial blood pressure ( McC ulloch. 198 )
In studies of humans in hypotension induced by hemorrhage (assumed to be at
-0 G
=
).
unconsciousness occurs at a head-level mean arterial pressure of .=)Q mm Hg (Glaister. 1990). However. during high-G acceleration. perfusion pressure ismain-tained below .jO mm Hg. vVhat allows a pilot to retain consciousness down to a mean
pressure of 20 mm Hg is attri buted to venous drainage. During -G
=
acceleration.jugular pressure at the base of the skull drops .)- mm Hg to subatmospheric. which
maintains perfusion pressure and, in effect. siphons blood from the brain despite the fact that the vein has already collapsed. Cerebral ,·ascular resistance drops fur ther
because the decreased venous blood and cerebrospinal fluid pressures reduces
periph-eral pressure on the cerebral vessels (Chien, 198.5; Ganong, 1989; Glaister 1990 ).
Blood fl.ow to the brain will eventually stop if the gravitational acceleration is
great enough, despite the autoregulatory mechanisms of the cerebral vasculature.
Hg (Burns et al., 19 6 ).
Figure 2.10 shows a typical data set for a human centrifuge experiment using Doppler ultrasound (Sandler et al., 1977). During + G.: acceleration. eye-level blood
pressure drops, allowing retrograde fl.ow in the temporal artery. Flow ceases when the pressure drops even further. C'LL will occur .5- 7 seconds after fl.ow cessation (Glaister , 1990 ; Krutz et al., 1973; Sandler et al. , 1977).
Im proving G-T OL
Seatback A ngles Presently, there are three methods of increasing G-TOL, the first being the reclining (supinating ) seat. As a pilot's head is lowered or his or her hips and legs raised (Figure 2.11), the hydrostatic difference between the heart and head decreases. Most aircraft seat back angles are in the 13°-15 ° from vertical range except the F-16 (30° ) and the YF-22 ATF (rumored to be greater than 30° and variable). Burns ( 1988) found no significant changes in G-TO L until the seat back angle increased beyond 30° . At angles from 45° to 5.5° , G-TOL increased by 0.063 G / degree. A 0.146 G/ degree G-TOL increase was observed for seatback angles between 65° and 75° .
G-TOL will decrease as seatback angles are increased from 0° (upright) to around
15° -17° . In addition to the average 28- 30 cm heart-to-head hydrostatic column (Glaister , 1990; O'Bryan, 1991), there is an 8-9 cm eye-to-brain hydrostatic column in the + x (ventral) direction. The resultant hydrostatic column , about 31 cm, lies 15° - 17° ventral from vertical (heart-to-eye). With a seat back angle of 15°-17° , this resultant column, greater in length than the anatomical heart-to- head distance, is
{{_+Gz-PERIPHERAL VISION
OEGAIEES FROM CENTtR
FLOW VELOCITY TEMPORAL
A~TEAY
-. i\11llll
l
1l
1 ll it
11
1
,11.
1\\
1
."1~\\\\'
-0 '
~
.+\-41.
,i
li-l
',·~----_,__
. -'---·-,\
EYELEVEL BLOOD PRESSURE;
mm Hg
EKG
llililll!llllJ!1-W.uH •.
{ JlJ~!J~J-1;.!ll1l
-··
n
I i·· ·~
: I
TILT· BACK SEAT PALE (PELVIS AND LEGS ELEVATING) SEAT
Figure 2.11: Head-tilt and PALE seats (Burton et al.. 1974 )
around 30° , the hydrostatic column in line with the G .: vector is the same length as that of sitting upright. G- protection will only occur with seatback angles of greater than 30° . Seatback angles greater than 7.5° do not afford any additional G-T O L
since the eye-to-brain column in line with the G.: vector will be greater t han the heart-to-head column at this point (Burns. 19 8). Table 2.2 shows various seat back
angles and the protection they provide.
Problems occur with having large seatback angles. Reduced visibility aft and below the aircraft prohibit the pilot from functioning properly. G-LOC' becomes a
possibility during +Gx accelerations such as takeoffs and landings. Positioning of flight controls and instruments becomes difficult to place and not obstruct vision and
Table 2.2: Effect of seat back angle on G-TO L ( Burton. 197-f )
Subjects
Relaxed G tolerance
13°
30°
45o
55°
65°
1
4.0
4.0
5 . 3
6.2
2
4 .4
4 . 0
4.8
5 . 0
7 .4
3
3.5
3 . 7
4.3
5 . 5
6.3
4
3 . 5
3 . 5
4.2
4 . 9
5.9
5
3.5
3.5
4.3
4.9
7.0
6
4.9
4 . 5
4.5
5.0
7.5
7
4.0
4. 3
4.8
5 . 2
6. l
Mean
3.97 3 .93 4.48a 5 . 11b 6.48c
±Std . error
0 . 20 0 . 15 0. 11 0.09 0.24
Significantly different from value s at 130 :
a
=P
< .05; b
=P
< .005; c
=
P
< .001.
could prove to be hazardous.
75°
8.0
8.5
7.0
7. 3
10.0
8.0
7 . 0
7,97C
0.40
Incr easing intrath o r acic pressure Anti-G Straining .\Ianeu\·ers ( AGS:\I ) and Positive Pressure Breathing (PPB) are two methods used to increase
intratho-racic pressure. AGS.\I such as the Valsalva ( L-1) and the .\.fodified Valsalva or .\lueller
[image:38.572.92.515.101.431.2]Anti- G s ui t Today's Gsuit is a garment that applies external counterpre
-sure to a pilot' 1 gs and a bdomen to counteract t he effects of + G::; acceleration.
O riuinally de igned to combat ,·enou pooling. the G-suit ha been found to help
counte ract the primary cause of C -LOC - t he drop in arterial pressure (Wood.
19 7 ).
Ideally, a C:-sui t would apply counterpre su re to the legs, a bdomen, and arms
to temporarily occlude arterial flow du ring -"-G.: st re s. uch suits were te ted prior
to WW II. P ilot refused to wear t hem because they were very uncomfor table even
though they provided and additional -t- 3 Gs of protect ion.
T he G-sui t used du ring WvV II were a clo e fi t ti na pair of trouser containing
five inter-connected bladders: two calf, two thigh, a nd one abdominal. The e
blad-de rs begin to inflate at T 2 G.: and continue to inflate at 1..5 psi/ C: (7 mm Hg/ G )
to a maxim um of 10.5 psi (.545 mm Hg) (B urton et al. . 1974). W hile thee suits
do not generate counterp ressures high enough to occlude femoral arterial flow , the
pressures developed increase femoral fl ow and can occlude flow in some vascular beds
and therefore increase peripheral resi tance. Other effects are a reduction of venou
pooling, a reduction of the heart-to- head hydrostatic colum n somewha t by raising
the diaphragm . and promot ion of Yenou return by increasing the abdominal venous
pressure to cent ral venous pressure gradient. T he G-TO L increase of t hese suits are
about 1.9 G . 75o/c of which is being provided by the abdominal blad der. (Burns et
al., 19 6 ).
Experime nts conducted by Gray et al. (1969) and Seawor th et al. (19 5) agree
with Burns that G-suits combat venous pooling and promote venous ret urn by raising
tand-ing men weartand-ing G-suit.s. they observed a drop in peripheral resistance upon G-suit inflation. Arterial pressure increased upon inflation and fl.ow diminished. By Equa-tion 2.1, this is a net drop in peripheral resistance.
The G-suits used today are nearly identical to the WW II versions except that
in modern suits, the coverage is not as complete. There are cutouts in the suit for pilot comfort. The standard USAF CSU-12/ P cutaway suit, shown in Figure 2.12. provides an increased G-TOL of only 1.0 G (Figure 2.13 ). The suit was designed to counteract the G-forces generated by aircraft such as the P-.51 :\Iustang and the P--17 Thunderbolt. not the high-Gs generated by modern fighter aircraft. Yet it is the most widely used G-suit in the world (Wood , 1987).
Figure 2.12: The USAF CSU- 12/ P five bladder G-suit (Burton et al. , 1974)
160 O None
)( Chest
•
Trunk6 Trunk & Lower limb 6
0. ::c
6
E
.§ 120
"'
~., .,
"'
it
..
~ 80
<
c:6
..
"'
j
~
0 x
"'
"'
..
40 x"' u
.f
0 40 80 120
Pos1!1ve Br ea1h1n1i Pr essure (mmHg )
Figure 2.13: Mean arterial blood pressure versus positive pressure breathing and G-suits (Glaister, 1990 )
legs and abdominal bladders. They also have faster responding control mechanisms (Burton. 19 O'Bryon , 1991 ; Wood. 1990 ). :\Ioore et al. ( 19 ) have been
Ste noses
Arterial stenosis are caused by atherosclerotic plaques built up on t he arterial
wall. As they develop in size, they begin to project into the lumen of t he artery,
narrowing the diameter. Flow accelerates and may become t ur bulent through the
stenosis . Distal capillary beds can respond to a growing stenosis by decreasing their
resistance in order to maintain perfusion ( 'tergiopulos, 1987 ). When the occlusion
becomes 0- 903 of the cross-sectional area (critical stenosis ). flow diminishes rapidly
a the distal beds cannot compensate any further.
Pressure drops across a stenosis are measureable but because of the complexity
of the turbulence present and non- linear terms appearing as a function of geometry,
analytical methods have failed to completely model flow behavior.
Young and T sai ( 1973a,b) studied hydraulic models of stenoses with steady and
pulsating flows. They found an empiri cal relationship between the pressure drop and flow as
K i·µ f\t p
[.-1.
0 ] 2 dq(t)!:lp(t ) = - - q(t) - - 2 - - 1 q (t ) - K u p Ls
-D
2 A.0 .-ls dt (2.2 )where
non-occluded cross-sectional area
minimum cross-sectional area inside stenosis
D diameter of non-occluded tube
em pirical viscous coefficient
empirical turbulence coefficient
q instantaneous flow in the unocduded tube fluid viscosity
p fluid density
eeley and Young ( 1916) found that for varying geometries of blunt-ended stenoses.
two empi rical coefficients, f\-t and J\11 • depended little on geometry and could be
ap-proximated as constants.
Kt
=
1..52 andKu
-
1.2. The third term. Ki .. was found to be a function of geometry by the relationshipr. • _O ._3_ L_s_ - _l _.6_4_D_s ( Ao )
J\ l'
=
32D
:-1 1 ( 2.3)CHAPTER 3. THE COMP UTER M ODEL
The computer model used in thi tudy wa developed by Nikolaos
tergiopu-los at Iowa tate [ni\·ersity . .-\complete derirntion of the governing equation and
bound a ry conditions can be found in hi Ph.D. dissertation (1990 ) and by other
re-lated work by Porenta ( 19 6 ). R o oz ( 19 2 ). Young ( 1979 ), Young and T ai ( 1973a.b ).
and Youn11 et al. (19 1). A brief synop is of the model is given in this chapter.
The following derivation is based on the fol lowing a sumptions:
• Arteries are modelled as linear , lightly tapered. straight tubes with circular
cro s sections.
• Arterial walls are incompressible. thin. and disten ible. Their material
proper-tie assumed homogenous over the lengt h of the segment.
• e11ments are con trained in the longitudinal direction.
• Blood is considered an incompressible, homogenous, isotropic. Newtonian fluid.
• Flow is laminar, except possibly near localized constrictions; axisymmetric, and
without secondary flows.
\Vhile these assumptions may not hold for all arterial flow cases. they have been
proven to be reasonably valid for most studies and tend to give good approximations
(Stergiopulos, 1990 ).
Mathematical Model
Governing equations
The mathematical model is based on the integral momentum approach.
Assum-mg axial symmetry and no seepage, the conti nuity equation can be integrated to
yield
8A.
_
oq
=
Oat ax
Similarly, the momentum equation becomesoq
_
j_
(.x
q2)=
_ Aop
_
27i Rrw _ A.bxat
ox A pox p( 3.1 )
( 3 .2 )
where
(A~)
is the convective acceleration. rw 1s t he wall shear , and .-lbx 1s theexternal body force term.
The momentum flux coefficient ,
A
.
is a fun ction of t he cross- ectional velocityprofile. A = 1.0 for a flat velocity profile and A
=
4/ 3 fo r a parabolic profile. For arterial flow in major arteries.A
can be reasonably approximated at 1.0.Shear stress, rw, is app roximated by
p
[
C'i•rrµ
,
oql
ru·
= - -
q - ( C u - 1 )as developed by Young and Tsai ( 1973b ), where
Cu
andCu
are functions of the Wormersly parameter. 0: = RGg,
where ..,; is the pulse frequency and v is thekinematic viscosity. For simple harmonic fl.ow in a straight, rigid tube. Young and
Tsai found values for
Cv
andCu
as plotted in Figure 3.1.6 ·0
5·0
"4 ·0 .
< .. }
3·0
I..)~
2 ·0 - c"
1 ·0
O·O . . . _ _ _ . . . _ _ .._J _ 1.__._I _ __,.I L_J___.___.__~~
0 1 2 4 6 8 1·0 2 4 6 " 10· 0 2 3
a
Figure 3. 1: Coefficients of wall shearing stress for simple harmonic flow in a straight . rigid tube (Young and Tsai. 1973b)
A non-linear pressure-area relationship is modelled by
[ I ,/
2]
.-l(x)
=
Ao(.r) l -C0(p - Po) -C
i(p- Po) (3.-!)where
Cb
andCi
depend on the properties of the artery. ~Iany different p-A re-lationships can be simulated using this non-linear form by judicious selection of c~A(p. x) = A(p0, x)
[1
+
K ln:alBy series expansion of Equation 3.5,
Cb
andCi
tan be evaluated asB o undary conditions
Ct o --
Po
I\c'
1 - I\2 2
Po
( 3 .. 5)
( 3.6)
(3. 7)
For t he proximal boundary condition, a pressure or flow input waveform is pre-scribed at the root of the ascending aorta. For this st udy, a proximal flow condition is prescribed because of the availability of stroke volume data. Waveforms are ap-proximated by a mean flow term and ten Fourier harmonics. The flow waveform for a heart rate of 60 bpm in t he supine condition ( + 0 G.:) is shown in Table 3.1.
It was intended to use t he same Fourier coefficients to simulate the higher heart rates experienced in + G.: acceleration. From the mathematical standpoint, changing the frequency of the arguments in the Fourier expansion is all that would be necessary. However, from a physiological standpoint, the entire waveform does not change with frequency. As heart rate increases, the systolic wavefrom remains essentially intact while the diastolic waveform is drastically altered. The basal Fourier coefficient s must be modified to reflect t he new waveform at different heart rates.
Table 3.1: Fourier coefficients for the proximal flow waveform
Harmonic Cosine term Sine term
3
(~) (~) 3
0 0.86393£-4 0.00000E + O
1 -0.8845.S E-4 0.13368E-3
2 -0.52515E-4 -0. 12280E-3
3 0. 6471E-4 0.22459E-4
4 -0.26395E-4 0.22693£-4
5
I
-0.129 7£-4 0.2239 E-.s6 0.20133E-5 -0.223 1.5£-4
I 0.70 96E-5 0.10065£-4
I 0.32.517£-5 -0.21066E-5
I
9 -0 .. 56513 E-5 0.90633£- 5 II
10 -0.19302£-.s -0 .. S-!22£-5.I
R,
Cr
R2
Figure 3.2: .\lodified windkessel model (Stergiopulos. 19!:JO)
A modified windkessel model ( Figure 3.2) is used for terminal impedances which relates pressure and fl.ow by
( 3. )
Total peripheral resistance for any vascular bed, Ry , is the sum of R1 and R2 for that bed.
The simplif};ng boundary condition is merely that pressures rema.rn const ant and flows a re conserved across a branch or bifurcation.
Sten osis
Arterial stenoses (Figure 3.3) create a pressure drop that is empirically predicted by t he equation developed by Young and Tsai ( 1973b)
!ip(t )
=
4Kuµ q(t) +Kt ~
[Ao
- l] q2(t) + Ku p l s dq(t) (3.9)1T'D3
2 A~As
.4o dtwhere
I\ v -_ 3 0. 2 ___
3 Ls - l.64Ds (Ao)
D___ .-11 (3.10)and K t = 1.52, and K u 1.2.
!
I-1
A2"'"«
=zL22
/z?~
f
tu;:c,,o~~//~ ~/7~01
Accele r atio n
External acceleration i defined by the model a the dot product of the
exter-nal body force vector and the segment position vector (a vector from the root of
the ascending aorta to the arterial segment under consideration). For convenience.
acceleration loads are input a multiples of gra\·ity. or Gs. Axial component of
acceleration are the momentum equation body force term.
P hysiological Model
The model i an arterial tree with fifty-five arterial segment s in 239 nodes. The
first segment is the root of the a cending aorta at the aort ic valve. Terminal segments
are at the level of the tibial, radial. carotid. renal. and mesenteric arteries.
Vascula-ture in the ha nds. feet, thoracic cavity. abdominal cavity and cranium as well as the
coronary arteries are not modelled.
The model i a two dimensional projection of a 3- D arterial tree. The ··per on··
is represented in a fl.at (supi ne or standing) position with the arms and legs out and
flat as shown in Figure 3.4. Each of the segment is st raight with a circular. but
lightly tapering. cross-section.
Segment aeometrical data (le ngth. mean radius. and orientation. presented in
Table 3.2. i adapted from Sud a nd Sekhon ( 19 6). Estimation of the
physio-logical parameters of volume compliance, terminal resistance, and terminal
capac-itance are given complete treatment in Stergiopulo ( 1990 ). Table 3.3 hows terminal
Table 3.2: Arterial geomet ric data ( Stergiopulos. 1990)
Seg. . ame Length \ P rox. R Distal R Angle Vol. com pliance
5
(cm) (cm ) (cm ) (deg ) (l o- 6 cm )
Tune
1 Ascending Aorta 4.0
I
1.470 1.440I
90 104.4002
1
Aortic Arch A 2.0 1.120 1.120 0 29.600
3 Innominate 3.4
I
0.620 0.620 135I
13 .. 5004 R. Subclavian A 3.4 0.423
0.423 1
1 0 .5.6005 R. Carotid 17.7 0.370 0.370 90 21.360
6 R. Vertebral 14. 0.1 0. 1 3 120 1.6 2
7 R. Subclavian B 42.2 0.403 0.236
I
240 33. 70R. Radial 23.5 0.17-! 0.1-!2
I
240 1. 779 R. Ulnar A 6.7 0.21.5 0.21 .5 240
I
1.11010 R. Interosseous 7.9 0.091 0.091 240 o.o9o
I
11 R. Ulnar B 17.1
I
0.203 0.1 3 240 2.2 1012 R. Internal Carotid 17. 7 0.177 0.0 3 90 0.943
13 R. External Carotid
I
17. 7I
0.177 1 0.083 135 0.94314 Aortic Arch B 3.9 1.070 1.070 0 .52.100
15 L. Carotid 20. o.370
I
o.370I
60I
25.10016 L. Internal Carotid 17. 7 0.177 0.0 3 90 0.943
17 L. External Carotid 17. 7 0.177 0.083 1 45 0.943
1
1
Thoracic Aorta A .5.2 0.999 0.999 270 -59. 700
19 L. Subclavian A 3.4 0...123 0...123 45 5.600
20 L. Vertebral 14. 0.1 0.1 3 60 1.6 2
21 L. Subclavian B 42 .2 0.403 0.236 1 300 33. 70
22 L. Radial 23 . .5 0.174 0.142 300 1. 77
23 L. l'lnar A 6.7
I
0.215 0.21 5 1 300I
1.11024 L. Interosseous 7.9 0.091 0.091 300 0.090
25 L. Cinar B 17 .1 0.203 0. 1 3
30~
I
2.21026 Intercos tals .0 0.200 0. 1.50 3.000
27 Thoracic Aorta B 10.4 0.675 0.64.5 270 47.600
2 Abdominal Aorta A .5.3 0.610 0.61 0 270 20.400
29 1 Celiac A 1.0
I
0.390 0.390I
0 1.36030 Celiac B 1.0 0.200 0.200 0 i.ooo
I
31 Hepatic 6.6 0.220 0.220
I
315 2.30032 Gast ric 7.1 0.1 0 0.1 0 4.SO 1.510
33 Splenic 6.3 0.275 0.275 0 3.740
Table 3.2 (Continued)
Seg. Name Length Prox. R Distal R Angle Vol. compliance
5
(cm) J (cm ) (cm) (deg ) (lo-6cm )
Tvne
3.5 Abdominal Aorta B 1.0 0.600 0.600 270 4.000
36 L. Renal 3.2 0.260 0.260 I 0 1.670
I
37 . Abdominal Aorta
C'
1.0I
0 .. 590 o.590I
210I
3. 00~1
3 R. Renal 3.2 0.260 0.260 0 1.670
39 Abdominal Aorta D
10.6 1
o .. 5 o 0 .. 54 270 33.90040 Inferior Mesenteric 5.0 0.160 0.160 270 0.792
41 Abdominal Aorta E 1.0 0.520 0 . .520 270 3 .. 500
42 L. Common Iliac .5.
I
0.3 6 0.3.50I
225 4 .. s o I43 R. Common Iliac .5 .8 0.386 0.350 225 4 .. 5 0 ;
44 L. External Iliac 14.4 0.320 0.270 315 1.5.620
4,5 L. Internal Iliac .5 .0 0.200 0.200 270 3.300
46 L. Femoral 44.3 0.259 0.190 210
I
13.64047 L. Deep Femoral 12.6 0.2.S5 0.1 6 31.5 1.130
48 L. Posterior Tibial 32.1
I
0.247 0.141I
270 2.20649 L. Anterior Tibial 34.3 0.130 0.130 270 0. 42
50 R. External Iliac 14.4 0.320 0.270 225 15.620
.51 R. Internal Iliac .5.0
I
0.200 0.200 270 t 3.30052 R. Femoral 44.3 0.259 0.190 270 13.640
,53 R. Deep Femoral 12.6 0.255 0.1 6 225 1.130
,54 R . Posterior Tibial 32.1 0.247 0.141 270 2.206
Table 3.3: Terminal impedance data (Stergiopulos, 1990)
Segment
I
Total Resistance Terminal Compliance(~)
('N)
.56 0.60100E + l0 0.3095.SE-10
8 0.52800£ + 10 0.3523.SE-10
10 0.84300E + ll 0.22069E-ll
11 0 .. 52800E + l0 0.3.523.SE-10
12 0.13900E + ll 0.13384E-10
13 0.13900E + ll 0.13384E-10
16 0.13900E +ll 0.1 3384E-10
17
I 0.13900E + ll 0.13384E-1020 I 0.60100E + 10 0.309.5.SE-10
22 0.52800E + 10 0.3523.SE-10
24 0.84300E + ll 0.22069E-11
25 0.52800E + l0 0.3523.5E-10
26 0.13900E + l0 0.13384E-09
31 0.36300E + l0 0.51251E-10
32 0.54100E+ 10 0.34389E-10
33 0.23200E + 10 0.80191E-10
34 0.93000E + 09 0.20005E-09
36 0.11300E+ 10 0.16164E-09
38 0.11300E + 10 0.16464E-09
40 0.68800E + 10 0.27041E-10
45 0.79360£ + 10 0.23443E-10
47 0.47700E + 10 0.39003E-10
48 0.4770QE...t..1Q 0.39003E-10
49 0.55900E + 10 0.33281E-10
51 0.79360E + l0 0.23443E-10
.53 0.47700E + 10 0.39003E-10
54 0.47700E + 10 0.39003E-10
Centrifuge experimental data
Since the model does not include physiological control mechanisms. the
appro-priate mechanisms compensating for
- G:;
acceleration must be supplied externally.Human cent rifuge data have been compiled to be used in the model as an input
pa-rameter file. Acceleration physiologists frequently discuss four major physiological
changes during -G:; acceleration: stroke volume. cardiac output. heart rate, and
peripheral resistance.
Cardiac output is a function of stroke volume and heart rat e (C'O = SY* HR)
and is therefore not an independent parameter. 'troke vol ume is not a compensatory
mecha nism but is a indicator of venous pooling. By Starling·s Law of the Heart . the
less venous return , t he less stroke volume. If the model included a venous system
and a heart, stroke volume would be represented in the governing equations. Here,
it is a measure of the predicted venous dynami cs of the human circulatory system.
This st ud y only examines the teady-state of the arterial system after the onset
of
-G:;
acceleration. Physiological responses to ...1... G.:: acceleration tend to vary wit hthe rate of
- G:;
onset. For figher aircrew. rapid onset of - G:; acceleration is of primeconcern. For this study. only RO R (Rapid Onset Run ) data are used. rather than
GO R (G radual Onset Run) data. The reasons a to why t he physiological control
mechanisms differ from ROR to GO R are beyond the scope of this study.
Human data compiled from Wood ( 19 7), Howard ( 1965 ), and Ganong ( 1989)
are shown in Table 3.4. Supine (+ O G:::) data used by Stergiopulos (1990) in the
original model ( Appendix ) will be considered accurate for t he Standard !\Ian. All
centrifuge data in the form of percentage change from supine will be referenced to
Table 3.-l: Human phy iological re pone to - G.: acceleration in literature
-G.:
Heart rate, bpm 0 1 2 3 4 Cardiac output (m£s) 0 1 2 3 4
Stroke vol.. (me)
Stergiopulos Ganong
60
51
4
- -a ' .)
-3 a
0 6.393
1 2 3 4 Peripheral Resistance 0 1 2 3 4
Ba eline
..L2.53 Wood gob 9.5° 112a 12711 3616a 31 a
3033a
39.4a 32.66a 26.44a
-173c (. 463 )
I
- 41%c (+ 763 ) - .593c ( - 993)Howard Gotshall
4b
1076
I .
1266
1336
3 a
32. 3a
+ 253 - .503 ..L 0% - 1093 69 6200 4.)00 -.54%
I
II
a Data listed as percent change from ...-Q G.: or - 1 G.: . . umbers listed a re taken from average values of - 0 G.: or -r l G.: .