International Journal of Innovative Technology and Exploring Engineering (IJITEE) ISSN: 2278-3075, Volume-9 Issue-1, November 2019
Abstract: The musi river historically provided farmers downstream of hyderabad with irrigation water for the cultivation of paddy for the duration of and after the monsoon rains. Through the construction of weirs, river water is retained in large and small reservoirs on the river from wherein it is diverted thru irrigation canals to village tanks and agricultural fields. This paper focuses on the sample description and corrective requirements after the survey samples at unique black points alongside musi. The presence heavy metals and microbiological pollutants have made the groundwater dangerous for consuming at diverse places in hyderabad. It has also proved that there is large issue of city groundwater recharge in this region. The internet urban recharge factor of groundwater in this region changed into anticipated to be about 567. 51 mm/a and natural recharge element turned into observed to be 52. 78 mm/a. The combination of tools carried out, the outcomes received and the recommendations provided in this have a look at will be helpful for neighborhood planners and selection makers to shield and restore the water assets on this location. The existing work also makes a speciality of the scope of infection by float water immersion at 2d part of musi river in ground as nicely agriculture. The consequences taken into consideration from 2017 june to may additionally 2019 for the actual identifications, the parameters are y18 and y19 for graphical enter.
Key words: Musi, water quality assessment, ground water
I.INTRODUCTION
On a first visit to the musi river inside the heart of the city one might without difficulty finish that the boom of the metropolis and the consequent big-scale disposal of wastewater into the river has been an ecological catastrophe. Yet the river had lengthy been dry, and one ought to argue that huge scale wastewater disposal has given the river a brand new life. The origins of the wastewater are in large part home and do concentrations improved hastily after 17 km. A benthic survey alongside the river determined that habitat situations for macro-invertebrates improved unexpectedly, and consequently greater taxa richness turned into determined with increasing distance from the metropolis. In a few elements of the city, it is dynamically more active and, in different components, it suggests much less development or expansion sports (deng and huang, 2004). In lots of megacities in india, it has been noticed that in city increase of cities, the encircling place of city built up which had herbal flora cowl or agriculture or water bodies, and so forth. Becomes the victim of urban encroachment. Spatial growth of cities results in to exchange in previous land use kind. Such
Revised Manuscript Received on November 06, 2019.
Mohammed Zakir Hussain, Research Scholar, Shri JJT University,
Jhunjunu, Rajasthan. zakirafroz@gmail.com
Dr. PVS Vara Prasad, Principal, GIET ENG CLG,RAJAMANDRI .
Dr. Yamini S Verma, Assistant Professor, Shri JJT University,
Jhunjunu, Rajasthan
phenomenon of city sprawl is characterized by using haphazard patchwork of improvement, which results in an unsuitable development in towns. To save you this form of sprawl inside the destiny, it is important to monitor the increase of the city (vinoth kumar et al., 2007). Mapping and monitoring the city sprawl, due to city decay inside the centres of cities, at normal durations may be very vital for city planners to understand the trend of improvement on the city outer edge and eventually to regulate it (Lv et al., 2012). However, the impact of UV light at the first six sample points has probably been minimal, as a consequence of the high turbidity which prevents effective penetration of UV light into the water column (Otaki et al. 2003). Recontamination of Musi-water with E. coli downstream of irrigation weirs should be considered, and would suggest and even higher treatment performance as currently But, the impact of uv mild at the first six sample factors has probably been minimum, on account of the excessive turbidity which prevents effective penetration of uv light into the water column (otaki et al. 2003). Recontamination of musi-water with e. Coli downstream of irrigation weirs should be taken into consideration, and could advise and even higher treatment overall performance as presently reported, as the river is frequently utilized by water buffaloes for bathing and drinking. The growth in salinity from 2. Zero ds m−1 to 2. 3 ds m−1 can not be explained by way of evaporation by myself and the most likely clarification is the inflow of saline drainage water from irrigated fields. Soil irrigated with wastewater turned into determined to more or less gather 34 kg/ha/yr(mccartney et al. 2008).
II.PROBLEM DEFINITION
The adjustments in land use and human manipulation of environment have severely affected the water resources of this place. But, targeted studies about its urban growth trend the usage of remote sensing and gis techniques in addition to evaluation of effect of urbanization on water resources are scarce and now not to be had in an included setup for hyderabad. The evaluation of groundwater in hyderabad is essential with a purpose to examine the interaction between urban land use and groundwater within the subsequent step. Finally, the relation and interplay among urban increase and the groundwater assets could be examined within an effect evaluation. The final results of this study can be an efficient tool for water assets management in addition to to support making plans tactics and formulate regulations to manual or redirect spatial increase in incipient mega city- hyderabad.
Possibility on Contamination of Upper MUSI
Ground Water for Flow Water at River End
Estimation of the natural and urban components of groundwater recharge and approximation of all the inflow as well as outflow components of urban water balance for Hyderabad city.
IV.STUDY AREA AND MAPPING
The present study occupying the area of MUSI first half session metro city Hyderabad urban and sub-urban areas for
[image:2.595.61.273.243.440.2]primary conceptual frame work, the below map shows the urban addition of contaminants to river basin.
Figure: 1.1 Monitoring points with reference code, lat, log and Altitude.
Code Sampling Points Latitude N Longi tude -E Alt. M L01 River Musi at
Osmansagar lake
17°22' 51" 78°18' 59"
595
L02 River Esi at Himayatsagar Lake
17°19' 55" 78°21' 49"
569
R01 River Musi at Moosarambagh bridge
17°22' 46" 78°31' 00"
581
R02 River Musi at Nagole bridge
17°22' 58" 78°33' 29"
510
R03 River Musi at Culvert,
Pratapasingaram
17°22' 49" 78°40' 03"
442
R04 River Musi at Culvert,
Pillaipalli
17°23' 07" 78°44' 14"
434
R05 River Musi at Weir,
Narayanarao Katwa, Peerjadiguda
17°23' 18" 78°35' 52"
465
R06 River Musi reservoir at
17°22' 46" 78°31' 00"
405
V.RESULTS AND DISCUSSIONS
Table 2: Limit as per BIS/ IS:11624 (1986), IS 10500:1991, IS 10500:2018
S. No. Parameter (expressed as mg/L except pH) Acceptable Limit Permissible Limit in absence of alternate source Observed values
1 pH 6.5 – 8.5 6.5 - 8.5 6.9-9.0
2 TDS 500 2000 595-142
0 3 Calcium as
Ca)
75 200 20-345
4 Chloride as Cl
250 1000 135-260
5 Magnesium as Mg
30 100 68-299
mg/L 6 Sulphate as
SO4
200 400 67-101
7 Total Alkalinity (TA as CaCO3)
200 600 132-304
8 Total Hardness (TH as CaCO3)
200 600 140-414
This study is on two lakes, six River Musi points in downstream, one River Krishna downstream point after confluence with River Musi from more than 270 samples.
[image:2.595.43.294.472.785.2]Figure 5.1 Trends of TDS in the year 2018-2019
Figure 5.2 Trends of sulphate in the year 2018-2019 The rough and wild terrain of river course on downstream sequence points supports self purification at R03, R04, R06 and R07 as shown in a
[image:2.595.318.530.510.702.2]International Journal of Innovative Technology and Exploring Engineering (IJITEE) ISSN: 2278-3075, Volume-9 Issue-1, November 2019
Figure 5.3 Trends of Percent Sodium in the year 2018-2019
Figure 5.4 Show increase order towards downstream in percent sodium and SAR
(a)
[image:3.595.56.282.51.513.2](b)
Fig. 5.5: photographic view of (a) L01 and (b) L02 Lakes The L01 u/s of Musi at Gandipet and L02 u/s of Esi a tributary of River Musi are almost equal trends of all the parameters as their catchments are part of river bed, overlapped and adjacent.
(a)
(b)
Fig.5.6: (a) Trends of TDS and (b) DO of L01 and L02 during 2018 – 2019
Trends for L01 and L02 during 2018-2019 shown at Figures are similar trends for all parameters. Trends of TDS are with in acceptable limit, little fluctuations and few pollution sources in the catchment. The TDS of these lakes ranges 160–320 mg/L. Averages of TDS, TSS Chloride, Sulphate, DO and COD are far below the standards, and of 245, 11, 33, 19, 5.1 and 24, respectively, ranging 162-320, 4-47, 19-65, 9-59, 1.6-77 and 8-78 mg/L.
(a)
[image:3.595.317.533.284.522.2](b)
Figure 5.7 Percent Sodium of L01 and L02, (b) SAR of L01 and L02
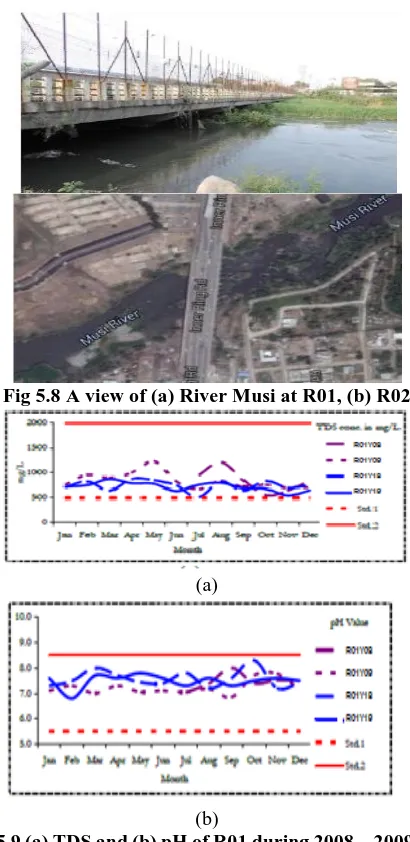
[image:3.595.65.263.578.707.2]Fig 5.8 A view of (a) River Musi at R01, (b) R02
(a)
(b)
Fig 5.9 (a) TDS and (b) pH of R01 during 2008 – 2009 and 2018 – 2019
The averages of TDS, TSS, Chloride, Sulphate, DO and COD are 733, 140, 163, 89, 0 and 316, respectively, ranging 510-877, 20-345, 132-204, 61-136, 0 and 51-677 mg/L. The range and average of pH is 6.8-8.3 and 7.5 respectively, shown at Figures 5.1, 5.2, 5.3.-5.9,5.10)
(a)
Fig.5.10: (a) TSS and (b) COD of R01 during 2008 – 2009 and 2018 – 2019.
Fig.5.11: (a) Chloride and (b) Sulphate of R01 during 2008 – 2009 and 2018 – 2019
The Chloride is crossing desirable limit on August 2009 and Sulphate is in limit (Fig.5.11). R01 shows heavy organic pollution and needs diversion of drains through Amberpet STP. Percent sodium is medium and high hazard class and SAR is low hazard class of Ir. HWQR as shown at Fig.5.12.
Fig.5.12: (a) Percent Sodium and (b) SAR of R01 during 2008 – 2009 and 2018 – 2019.
River Musi at Nagole bridge (R02)
[image:4.595.65.270.46.467.2] [image:4.595.318.528.107.284.2] [image:4.595.316.533.369.517.2] [image:4.595.62.274.543.758.2]International Journal of Innovative Technology and Exploring Engineering (IJITEE) ISSN: 2278-3075, Volume-9 Issue-1, November 2019
Fig.5.13: (a) TDS, (b) pH of R02 during 2008 – 2009 and 2018 – 2019
Averages of TDS, TSS, Chloride, Sulphate, DO and COD are 783, 80, 156, 72, 0.1 and 220, respectively, ranging 548-979, 12-242, 95-204, 11- 162, 0-2.2 and 75-596 mg/L shown at Figs.5.13-5.15
Fig.5.14: (a) TSS, (b) COD (c) Chloride, (d) Sulphate of R02 during 2008 – 2009 and 2018 – 2019
TSS exceeded the desirable limit in May 2018. The Chloride and Sulphate crossed desirable limit in June 2008 (Fig 5.14). Range and averages of pH, Percent Sodium and SAR at R02 and high hazard class and SAR is low hazard class of Ir. HWQR as shown at Fig.5.15.
Fig.5.15: (a) Percent Sodium, (b) SAR of R02 during 2008 – 2009 and 2018 – 2019
River Musi at Weir, Narayanarao Katwa (R05)
Photographic views of River Musi at R05 shown at Fig 5.16(a) the silt with water hyacinth, (b) encroachment with municipal dump and construction activities
Fig.5.16: View of River Musi at R05 (a) the silt with water hyacinth, (b) encroachments.
Fig.5.17: (a) TDS, (b) pH of R05 during 2008–2009 and 2018–2019.
Trends of R05 during 2008 – 2009 and 2018 – 2019 for TDS, pH, TSS, Chloride, Sulphate, COD, percent sodium and SAR are at Figs.5.17–5.19. Range and averages of pH shown at Fig.17(b).
Averages of TDS, TSS, Chloride, Sulphate and COD are 847, 59, 168, 85 and 182, respectively, ranging 595-1414, 13-133, 135-213, 67-101 and 68-299 mg/L, shown at Fig.5.17(a), 5.18, 5.19.
low hazard class of Ir. HWQR shown at Fig.20.
Fig.20: (a) Percent Sodium, (b) SAR of R05 during 2008 – 2009 and 2018 – 2019
River Musi at Pratapasingaram (R03)
Fig.5.21 is a photographic view of River Musi at R03 at immediate downstream of the R05. Trends for R03 for parameters during 2008 – 2009 and 2018 – 2019 are at Figs.5.21b, 5.22–.25.
Fig.5.21: (a) A view of River Musi at R03, (b) TDS of R03 during 2008 – 2009 and 2018 – 2019
Averages of TDS, TSS, Chloride, Sulphate, DO and COD are 804, 48, 174, 73, 0.4 and
International Journal of Innovative Technology and Exploring Engineering (IJITEE) ISSN: 2278-3075, Volume-9 Issue-1, November 2019
17-102, 0-3.4 and 49-199 mg/L.
Fig.22: (a) pH (b) TSS of R03 during 2008 – 2009 and 2018 – 2019
DO during 1998-1999 is ranging 4-6 and during 2018-2019 is near “0” indicate deterioration of River and not supporting fresh water fish. Chloride fluctuates and exceeds the desirable limit frequently and high in 2008 – 2009 and 2018 – 2019 show efficiency of treatment systems (Fig5.24).
Fig.23: (a) DO (b) COD of R03 during 2008 – 2009 and 2018 – 2019
The Sulphate exceeds the desirable limit in June and August 2008 and show higher concentrations during 2008 – 2009 and 2018 – 2019 and would be the result of CETP/STP facilities.
Fig.24: (a) Chloride (b) Sulphate of R03 during 2008 – 2009 and 2018 – 2019
Range and averages of pH, Percent Sodium and SAR are 7-8.4, 7.5; 39-62, 52 respectively. Percent sodium is in medium and high hazard class and SAR is low hazard class of Ir. HWQR shown at Fig 5.25
Fig.25: (a) Percent Sodium (b) SAR of R03 during 2008 – 2009 and 2018 – 2019
Fig.26: A photographic view of River Musi at R04 (b) TDS during 2008 – 2009 and 2018 – 2019
Averages of TDS, TSS, Chloride, Sulphate, DO and COD are 804, 25, 200, 77, 2.9 and 110, respectively, ranging 514-1346, 4-146, 138-480, 55-92, 1.2-8.8 and 36-288 mg/L.
Fig.27: (a) pH (b) DO of R04 during 2008 – 2009 and 2018 – 2019
The range and average of pH at Fig 5.27 a) DO is 4-7 and 1-3 mg/L during 2008 – 2009 and 2018 – 2019, respectively, as shown at Fig 5.27(b). Chloride exceeds the desirable limit frequently on 2008- 2019, and July 2019 and with-in limit during 2019 except June. The Sulphate exceed in June to August 2008.
Fig 5.28: (a) COD (b) Chloride of R04 during 2008–2009 and 2018–2019
Musi reservoir (R06) and River Krishna after confluence with River Musi at Vadapalle (R07)
Fig 5.29 is a photographic view of R06 at Kasaniguda, Suryapet, Nalgonda. R06 is the River Musi point representing storage after the confluence of a Tributary Bikkeru. Trends are prepared for R06 and R07 from the monitoring data during 2018–2019 at Figs 5.30–5.32.
Fig 5.29: (a) A view of R06 (b) TDS, of R06 and R07 during 2018–2019.
[image:8.595.57.283.50.167.2] [image:8.595.57.277.217.488.2] [image:8.595.317.534.288.492.2] [image:8.595.69.271.574.715.2]International Journal of Innovative Technology and Exploring Engineering (IJITEE) ISSN: 2278-3075, Volume-9 Issue-1, November 2019
Fig 5.30: (a) pH (b) TSS of R06 and R07 during 2018–2019.
Chloride exceeds desirable limit very frequently at R06 and Percent Sodium frequently reaches to very high hazard with respect to Ir. HWQR (Fig. 5.33a and 5.34a). Range and averages of pH, Percent Sodium and SAR at R06 are 7.4-8.4, 7.9; 45-66, 56 and 3.2-6.8, 4.7, respectively (Figs 5.30a, 5.33).
Fig 5.31: (a) DO (b) COD, of R06 and R07 during 2018–2019.
R07 is the River Krishna point after the confluence of River Musi. Averages of TDS, TSS, Chloride, Sulphate, DO and COD at R07 are 576, 20, 110, 74, 5.2 and 15, respectively, ranging 310- 1173, 8-60, 38-370, 28-151, 0-6.1 and 4-35 mg/L (Figs 5.29b, 5.30–32). COD attained high value in August 2018. The pH and Chloride exceeds desirable limit frequently in 2018-201 9at R07 (Figs. 5.30a, 5.31b).
Fig 5.32: (a) Chloride (b) Sulphate of R06 and R07 during 2018–2019.
Range and averages of pH, Percent Sodium and SAR at R07 are 7.8-9.0, 8.4; 16-47, 32 and 1.0- 3.5, 1.9 respectively (Figs. 5.30a, 5.34). The flow of River Krishna at R07 is meager except few months and village drains joined it resulting to low DO, higher values of COD, TSS, TDS, Chloride and Sulphate.
Fig 5.33: (a) Percent Sodium (b) SAR of R06 and R07 during 2018–2019.
Health indicator bacteria and nematode species
A look at throughout the direction of the survey (january 2008 – december 2009), 143 (66%) water samples from various points have been observed to be positive for helminthes eggs. Three exceptional helminth species had been detected; hookworm changed into the most not unusual (65%) of all samples, observed via ascaris (forty five%) and trichuris (nine%). Hookworm and ascaris concentrations were located to be similar at the first sample points, whilst trichuris concentrations have been determined to be tons lower. Concentrations of all three helminths decreased swiftly at sampling points after the primary weir ( r05) at peerjadiguda and reduced similarly with every additional weir as much as 30 km stretch on down flow of river musi consisting thirteen weirs finally musi reservoir. Trichuris eggs were the primary to disappear from river water, followed by means of ascaris, even as hookworm eggs have been the remaining to vanish from the river. The E. coli and F. coli concentrations during 2008-09 and 2018-2019 at the first weirs were high and comparable with those in raw sewage though they decreased rapidly with increasing distance from the city.
VI.CONCLUSIONS
Interpretation of Hydro geochemical data shows that category hard, slightly acidic nature. This reveals that the groundwater samples of study area fall in hard to very hard category, trilinear diagram shows that all of the samples fall in the field of SO42-, Cl-, Mg2+ type water. There are many ways to describe the quality of water. Depending on how the water is used and what you are looking for, different parameters are important. Here follows a short description of the parameters used in this work. PH is an indicator of the acidity or basicity of water. The normal pH range for irrigation water is 6.5 to 8.4. The pH is seldom a problem in itself. The main reason for pH measuring is to detect abnormal water, which may contain toxic ions or cause a nutritional imbalance. The study also reveals the scope of carrying these hard metals to the bottom area of Musi river and its effects in the next study.
REFERENCES
1. Adewuyi, Y.G., (2001). Sonochemistry: Environmental Science and Engineering Applications. Ind.
[image:9.595.318.533.47.224.2] [image:9.595.57.275.124.360.2] [image:9.595.64.272.448.687.2]4. Barth, J. and Hahne, W., (2002). Review article. Aliment. Pharmacol. Ther. 16:suppl. 1, pp. 31-33.
5. Butler, R.; Ehrenberg, S.; Godley, A R.; Lake, R., Lytton, L.; Cartmell, E., (2006). Remediation of bromate-contaminated groundwater in an ex situ fixed-film bioreactor. Science of The Total Environment Volume: 366, Issue: 1, Pages: 12-20.
6. Hadjer, K., T. Klein., M. Schopp., Water consumption embedded in its social context, north-western Benin.Physics and Chemistry of the Earth, 30, 357-64 (2005)
7. Sujatha T., Shatrugna V., Vidyasagar P., Begum N., Padmavathy N.S., Reddy G.C.K. and Rao. G.V.N. Timed activity studies for assessing the energy expenditure of women from an urban slum in South India. In Food and Nutrition Bulletin 24(2), 193-99 (2003) 8. Chen, X. and Chen, X. 2003. Sensitivity Analysis and Determination
of streambed leakance and Aquifer Hydraulic properties Journal of Hydrology, Vol.284, pp.270-284
9. Abdullah and Tamer Al-Assa’d 2006. ―Modelling of Groundwater flow for Mujib aquifer in Jordon‖, p. 289-297. Brodie, R.S. 1998. 10. Integrating GIS and RDBMS technologies during construction of a
regional groundwater model. Environ Modell Software 14:119–128. 11. Xu, X., Huang, G.H. and Qu, Z.Y. 2009. Integrating MODFLOW and
GIS technologies for assessing impacts of irrigation management and groundwater use in the Hetao Irrigation water flow process. US Geological Survey OpenFile Report 00-92.