International Journal of Innovative Technology and Exploring Engineering (IJITEE) ISSN: 2278-3075, Volume-8, Issue-6S4, April 2019
Abstract: Amongst various social networking platforms available in this digital millennium, Twitter facilitates a huge platform to accomplish analysis on data with respect to trends, events, personalities etc. Twitter facilitates the analysts in fetching essential information of the population based on their likes and preferences. Clustering technique is one of the prominent techniques available to fetch the essential data from the massive data being populated. Several clustering methods are available to achieve the objective of grouping the data. This paper throws light on the performance and efficiency of several algorithms used in determining the trending pulses effectively. The clusters of data obtained after clustering are further subjected to classification based on the topics for real time analysis. This paper discusses the flaws obtained in the classification of the data. The data is again subjected to an optimized classification technique and analyzed against the clusters of data.
Keywords: Data Classification, K-means Clustering, Affinity Propagation Technique, Centroid, Euclidian Distance, Classification of Medical Data, TF/IDF
INTRODUCTION
The data sets are available from various sources. The data can be obtained from offline sources namely newspapers, magazines and online sources such as blogs, official databases, social networking platforms etc. The data collected from such sources is usually raw and unformatted. The granularity of the obtained data can range from seconds, minutes, hours, days, weeks, months and so on and this detailed data results in the mammoth sized data. An efficient storage mechanism is necessary to sort and arrange the data and this storage plays a crucial role as it is required to retrieve the data later. The time to retrieve and type of data collected are very important.
The K-means clustering algorithm [1] offers a quick and consistent method for classifying the streaming data into numerous groups based on the attributes of the available data. The primary advantage of the K-means clustering algorithm is that it works efficiently to group the raw and unformatted data into multiple groups called as clusters. The number of clusters required is predetermined based on the number of clusters stated in problem definition. The cluster groups are obtained for each datasets with respect to the topic of interest. The metadata tags such as labels for the datasets are not necessary for prior processing using
Revised Manuscript Received on April 12, 2019.
P N Varalakshmi K, Research Scholar, Department of Computer Science and Engineering, M S Ramaiah Institute of Technology, Bangalore, India ([email protected])
Jagadish S Kallimani, Associate Professor, Department of Computer Science and Engineering, M S Ramaiah Institute of Technology, Bangalore, India ([email protected])
unsupervised learning techniques. The input data used here is the raw unformatted streaming data from the user source. The un-necessary whitespaces and data patterns could be removed using pre-processing techniques.
The Centroid [2] which is randomly placed inside the group is the locus of concentration with that data population. The data point is the representation of every input sentence. The data point is associated with certain mathematical values which are calculated using vectorization techniques namely term frequency and inverse document frequency [3]. The vector is computed by performing the dot product on scalar quantities such as the parameter value considered and the mathematical value of the text used during the procedure of classification.
Every data point is represented as a vector and every vector is characterized by distinct set of features. Euclidean algorithm is used to compute the distance between each vector and centroid of the vector [4] and this distance calculated is called as Euclidean distance [5]. The nearest centroid for each vector is obtained using the calculated Euclidean Distance. The vector which has the minimum Euclidean distance value to the centroid of each group is allocated to the corresponding cluster containing the centroid. The Euclidean distance computed plays a crucial role in assigning the vector to each individual cluster groups thus aids in dataset classification.
Among several social networking platforms available, Twitter provides updates on several topics ranging from sports to politics and politics to tech news in the form tweets. These tweets deliver the brief update on current events to its users in lightening speed. These tweets which get re-updated in the form of re-tweets become real time in nature. Users on Twitter can follow or non-follow personalities, political figures of their choice. Also, the usage of twitter is fueled due to the availability of smart phones under low cost.
In contrast to other social networking platforms, twitter allows its users to use its APIs to retrieve the tweet data based on metadata tags such as keywords. Several applications are available which fetch the twitter data in various customized format using OAuth mechanism.
The tweets retrieved using on the search keyword is based on the number of times the keyword is being searched and the keyword used to tweet and re-tweet. The tweets usually contain the keywords in the form of hash-tags. In order to refer a famous personality who himself/herself has a twitter
Research and Optimization of Data
Classification using K-means Clustering and
Affinity Propagation Technique
handle are referred using ‘@’ symbol followed by their twitter profile name. Such conventions followed in tweets help to fetch the essential information seamlessly.
There exist several techniques in data mining to find the patterns hidden inside huge data collected from tweets. Amongst them, classification and clustering approaches seem to be more efficient to analyze the current trends among user groups. The number of sentences used to
[image:2.595.137.462.158.300.2]perform classification in order to determine the trends existing among the users is random. Also, the size of the data is influences the performance of algorithm on the computing machine. It is expected to have high performance computing machines with increase in size of data. The current study involves the datasets consisting of 8, 22 and 50 sentences for clustering and classification.
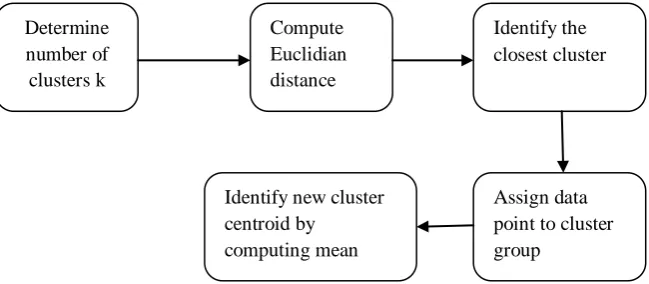
Figure 1: K-Means Clustering Flow Diagram
IMPLEMENTATION DETAILS IDENTIFY NEW CLUSTER CENTROID BY COMPUTING MEAN The tweet data retrieved from twitter are highly unstructured in nature due to the presence of metadata along with the fetched information. The irrelevant information such as proper nouns beginning with ‘@’ symbol followed by the twitter handle user name, smileys, stop-words, digits, whitespace within the retrieved data has to be removed. The removal of the irrelevant data out of the tweets retrieved and this is done as the part of pre-processing. Also, the data collected has to be subjected to spell checks in order to improve the content quality of the data. In addition to this, it is advisable to have a uniform alphabet case throughout the collected data. Normalization [6] has to be performed to reduce the randomness coefficient before proceeding with data analysis and this process reduces the percentage error rate in each iterations.
The important words in the tweet are bifurcated into nodes after normalization. The nodes which carry the same meaning are grouped into a same cluster. Words which sense different are not clustered into the same group. The relative distance between the words would increase if the words have a different context or if the words completely mean different. Words which mean the same or the words which have same context are placed with minimal separation. The words which belong to different clusters will have a different context. The distance between the words belonging to the same cluster is known as intra-cluster distance [7]. This intra-cluster distance will always be less. The distance between to two different clusters is termed as inter-cluster distance [8] and this distance will always have larger magnitude/value than the average larger distance within the same cluster.
The efficiency of the clustering process can be concluded by these properties. There are some scenarios where some words might belong to a wrong cluster. As the iteration
process continues, all the words with similar context start surrounding the centroid of the cluster. Through this procedure, the error rate is reduced when compared to keyword based searching technique.
The interchangeable ability among the words in the cluster is determined by the Cluster homogeneity [9]. The word belonging to a cluster could be replaced with the word belonging to the same cluster only if the cluster homogeneity rate is high and vice versa. This is because of the same context existing between the words and this is computed as the distance between words. There are several techniques available to compute the distance such as Euclidean distance, Manhattan distance [10], Chebychev distance [11], Spearman distance [12], Euclidean square distance [13], Pearson square distance [14] and Pearson correlation distance [15]. These techniques are used to calculate the distance between text data which belong to the same cluster. Among these techniques, Euclidean distance method is the most prominent method due to its technical simplicity and ease of application to the most of real world data set objects.
The methods such as average, single-link and complete link are used to calculate inter cluster distance. The average distance of all points within the cluster is given by average link. The distance between the most adjoining data points across the cluster is given by single-link. The distance between two farthest data points in two cluster groups is given by complete link. The complete link and single link are quite opposite to each other.
Clustering algorithms namely Agglomerative Hierarchical clustering, K-means clustering [16] and Jarvid-Patrick clustering can be applied to the data points in the clusters obtained from twitter data. Naïve-Bayes [18], a popular Determine
number of clusters k
Compute Euclidian distance
Identify the closest cluster
Identify new cluster centroid by
computing mean
International Journal of Innovative Technology and Exploring Engineering (IJITEE) ISSN: 2278-3075, Volume-8, Issue-6S4, April 2019
classification technique can also be used. But, the clustering techniques provide more extensibility and flexibility when compared to the classification techniques.
The K-Means clustering is mathematical grouping of data points. The number of clusters formed in K-means clustering algorithm is fixed and it is specified by the value ‘k’. The data is not clustered into two different clusters at a given space and time. This demonstrates the non-convergence of clusters in K-means clustering. The mathematical background of K-means clustering algorithm makes it more efficient and accurate when compared to other clustering techniques. The value of K mentioned in K-means clustering often causes ambiguity which is not desirable. This makes it hard to deduce the features/traits of each cluster group.
The Jarvis-Patrick clustering is centered on the similarity of the data content points defined by the distance measure between the content objects. Contrary to the K-means clustering algorithm, Jarvis-Patrick clustering technique does not involve much mathematical computation. Also, this method is deterministic in the number of clusters.
The agglomerative hierarchical clustering is inspired by the biological process of gene merging process in living beings. The clustering algorithm begins with each data point associated with a separate cluster and then they are clustered into dame clusters upon finding conducive data partner. This clustering algorithm yield minimum number of clusters and hence the time taken to iterate through each cluster becomes minimal. This algorithm does not re-group upon finding a data point which is wrongly being clustered. This is the major undesirable property associated with agglomerative hierarchical clustering approach.
The code snippet below is used to convert word corpus into a term document frequency matrix. This frequency matrix is used during K-means clustering technique. Euclidean distance algorithm is used to compute the distance between the data points.
TEST CASE 1:
Consider the following eight sentences with k=3 for the word accident:
[1] "TheCitizen_in: There is nothing accidental about it, these threats, and horrendous efforts to intimidate artists.",
[2] "I spend half of my sleepless night trying to find the sleeping position from my accidental afternoon nap. #SleeplessNights",
[3] "Campfire safety is key to preventing injuries and forest fires. Keep these #campfire #safety tips in mind during ", [4] "rhettandlink talk about their visit to Aussie and accidental HCFC cameo!\n\nOriginally shared by @Bluzae ",
[5] "The accidental hilarity of the self own is just too perfect.\nCohen worked for Trump for over a decade.", [6] "Congressman Louis T. MacFadden, Chairman of the
House Banking & Currency Committee: It was not accidental",
[7] "There is Nothing Accidental About These Threats, It Is a Pattern: T.M.Krishna",
[image:3.595.316.538.288.396.2][8] "I met her accidentally and it was all fun"
Table 1: Clustering 8 sentences with k=3
Cluster # Sentence #
1 3
2 1,2,4,5,6,7
3 8
TEST CASE 2:
By increasing the sample sentences to 50, with k=5 for the word accident:
Table 2: Clustering 50 sentences with k=5
Cluster # Sentence #
1 49,50
2 1,7,23,25,31,,32,37,39,45
3 48
4 43
5 2,3,4,5,6,8,9,10,11,12,13,14,15,16,17, 18,19,20,21,22,24,26,27,28,29,30,33,3 4,35,36,38,40,41,42,44,46,47
TEST CASE 3:
[image:3.595.342.512.465.561.2]Similarly, by performing clustering to sentences containing word collapse with k =4, we have:
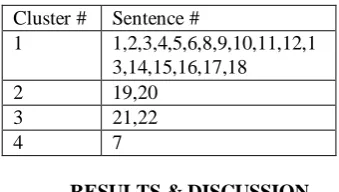
Table 3: Clustering 22 sentences with k=4
Cluster # Sentence #
1 1,2,3,4,5,6,8,9,10,11,12,1 3,14,15,16,17,18
2 19,20
3 21,22
4 7
RESULTS & DISCUSSION
The word accident which is used in different contexts has led to unexpected cluster formation. The sentences numbered 1, 7, 23, 25, 31, 32, 37, 39 and 45 are grouped under cluster 2. The meaning of these sentences with the usage of the term accident does not cause any physical damage to the subject/meaning of the sentences. It is observed that most of the sentences in cluster 2 comprised of sentences which were philosophical in nature. The occurrence of the term accident along with the phrases such
as ending of life, crossing of paths, catching up with people
changes the perseverance of the sentence from being physically harmful to being philosophical. The sentences grouped under cluster two could be named as the group of sentences which incline to be philosophical. In the first and
tdm<- TermDocumentMatrix(wordcorpus)
tdm<- as.matrix(tdm)
distMatrix<- dist(tdm, method="euclidean")
[image:3.595.50.251.509.606.2]seventh sentence, the occurrence of the term threat along with the term not, cancels the negativity of the context in the sentence, thus validates the inclusion of both the sentences under cluster group 2.
[image:4.595.49.289.150.282.2]The sentence 48 which includes the term accident in its context expresses about the scenario of extreme tragedy and this sentence is grouped under cluster 4.
Figure 2: Clustering 8 sentences with 3 cluster groups containing word ‘accident’
[image:4.595.308.544.151.258.2]The sentences which convey that there is some physical harm is depicted by the term accident are grouped under cluster 5. In normal context, the term accident refers to getting wounded physically but not deliberately. The phrases such as injuries, sleepless nights, hurt etc indicates getting harmed physically. The sentences 49 and 50 convey the meaning of meeting with some object are categorized under cluster 1. The cluster 1 could be labeled for meeting. Even though the sentence 48 conveys the meaning of meeting with some object but also at the same time it means philosophical because of which it is clustered under a different group. The classification has not been performed accurately since the sentences which convey the meaning of physical damage/wound have been classified under cluster group 5. The sentences numbered from 4 to 6 and 8 to 13 which do not convey the meaning of physical wound are grouped under cluster 5.
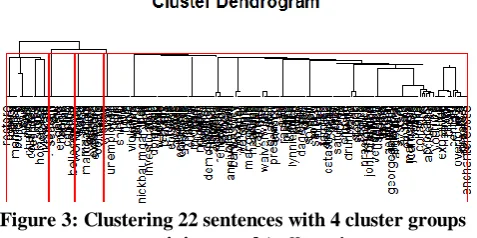
Figure 3: Clustering 22 sentences with 4 cluster groups containing word ‘collapse’
On the whole, the classification techniques provide a brief outline of the gist of the context of the sentences but we cannot entirely depend on the classification methods to ascertain the exact meaning of the sentence. Thus, classification could be used as the primary step during the sentence processing.
For the sentences containing the term collapse, the sentences containing the term collapse are grouped into 4 cluster groups. The sentences classified under cluster 1 convey the meaning – to fall down, suddenly, to give way etc. Most of the sentences under cluster 1 tend to give a
negative meaning. The sentence numbered 7 consisting of the term collapse along with the term rescue gives a positive meaning to the sentence and it is classified into the cluster 4. The sentence 21 and 22 expresses about the objective that never went wrong with the presences of terms ‘never’ and ‘not’. The sentence 20 is grouped into separate cluster group 2.
Figure 4: Clustering 50 sentences with 5 cluster groups containing word accident
The negativity conveyed by the term collapse gets negated when it occurs along terms such as not, never,
rescue and about. Thus it gives a positive context to the
sentence. The classification results obtained above conclude that the emotions which have occurred, which never occur, which bound to occur and which never occurred could be clustered into separate clusters.
OPTIMIZATION TECHNIQUE& RESULTS It is necessary to choose the number of centroids initially for K-means clustering algorithm. The number of clusters could be chosen as per the requirement provided that the user has a sound knowledge on the application domain. Otherwise, the number of clusters obtained in the results would be too many or too less in number which might not be helpful in achieving the objective of the problem. As the number of clusters formed increase the time required to iterate through clusters will also increase. This poses a negative impact on the performance of the algorithm.
Affinity propagation algorithm [19] is used to identify the exemplars [20] among the data points. It is not required for the user to choose the number of clusters. The numbers of clusters to be formed are chosen by the algorithm automatically. In contrast to the centroid used in K-means clustering technique, Affinity propagation algorithm uses exemplar which is the mean value of the cluster but which is not the centroid. The exemplar is itself a data point in the cluster. Initially each of the data points asserts to be the exemplars for the cluster groups. The data points commute with each other using messages till an optimal set of exemplars and clusters are obtained. There are two types of messages exchanged across the data points.
1. Responsibility r(i,k) is a message that is exchanged among data points to indicate the precision of the data point to be the member of exemplar’s cluster.
[image:4.595.52.291.519.638.2]International Journal of Innovative Technology and Exploring Engineering (IJITEE) ISSN: 2278-3075, Volume-8, Issue-6S4, April 2019
2. Availability a(i,k) is the message exchanged by the data points to indicate the suitability of k to be an exemplar to the data point i.
The preference value p(i,k) which provides clustering information for a given data point is calculated by the sum of responsibility and availability.
The preference value for exemplar k at ith data point -
p(i,k) = r(i,k) + a(i,k)
As the preference value k to the data point i increases, the chances of it to become the exemplar of the cluster group increases provided the preference values of other data point must be lower than the kth preference value. When the numbers of clusters are not optimal, user can change it using the preference values. The number of clusters can be set according to our preference by adjusting the preference values. The probability of a point to become an exemplar for a cluster group is directly proportional to the preference values.
[image:5.595.111.228.384.441.2]The code snippet below depicts Term Document Frequency matrix used in the implementation of Affinity Propagation technique for classification.
Table 4: Classifying 8 sentences using Affinity Propagation technique resulting in 3 clusters
Cluster # Sentence #
1 3
2 1,2,4,5,6,7
3 8
[image:5.595.68.271.611.714.2]The Affinity propagation algorithm is used here for classification without specifying the number of clusters during initialization. The classification results obtained using Affinity propagation algorithm on eight sentences with the context of ‘accident’ yielded three clusters where the third and eighth sentence belong to the different cluster groups. With the keen analysis on the results obtained, it can be deduced that the result achieved is analogous with the results obtained in K-means clustering technique using three clusters. The result of both the algorithms doesn’t show any significant difference.
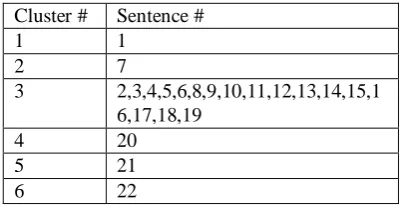
Table 5: Classifying 22 sentences using Affinity Propagation technique resulting in 6 clusters
Cluster # Sentence #
1 1
2 7
3 2,3,4,5,6,8,9,10,11,12,13,14,15,1 6,17,18,19
4 20
5 21
6 22
Affinity propagation technique produced six clusters for twenty two sentences involving collapse as the context word. Sentences numbered 1, 7, 20, 21 and 22 form a separate exemplar. The K-means clustering algorithm was implemented by initializing the number of clusters k=4. The results obtained using Affinity propagation and K-means
clustering approach produce almost same result where the sentences numbered 7, 20, 21 and 22 belong to the same cluster.
Table 6: Classifying 50 sentences using Affinity Propagation technique resulting in 3 clusters Cluster # Sentence #
1 1,3,4,5,6,7,8,9,11,12,13,14,15,17,18,20,21,2 2,23,24,25,27,28,30,34,35,36,37,38,39,40,4 1,42,43,44,45,46,47,48,50
2 2,10,16,19,26,29,31,49
3 32,33
The classification performed using Affinity Propagation method for the fifty sentences containing the context word
accident produces a completely distinct result when
compared to K-means clustering algorithm which produced five clusters. The Affinity propagation technique delivers only three unique cluster groups.
CONCLUSION
The K-means clustering algorithm works best when the centroids are chosen initially and the centroids chosen are close to the optimal solution. The algorithm iterates through every data item in each group. Thus the algorithm performs worst larger cluster groups and performs the best in smaller cluster groups. The initial number of clusters needs to be specified for which the centroids are initialized randomly. The centroid value can be either the data value or the space value on which the end user has no control over the centroid scalar value. Also there is the possibility of decrease in the specification of outrage values with the increase in number of clusters.
The exemplars could be efficiently identified among the data points among the data points using Affinity propagation technique. Also this technique helps in forming the clusters of data points around the exemplars. Exemplar is actually a data value. The specification of cluster group number would be done by the algorithm by making use of preference value to uniquely indicate the outrage values for given set of data points by inherently determining the number of cluster groups.
REFERENCES
1. Quing Yang, Ye Liu, Dongxu Zhang, Chang Liu, Improved
k-means algorithm to quickly locate optimum initial clustering
number K, Proceedings of the 30th Chinese Control
Conference, 2015.
2. Md. Sohrab Mahmud, Md. Mostafizer Rahman, Md. Nasim
Akhtar, Improvement of K-means clustering algorithm with
better centroids based on weighted average, 7th International
Conference on Electrical and Computer Engineering, 2016.
3. Farid Bourananni, Mouhcine Guennoun, Ying Zhu, Clustering
Relational Database Entities Using K-means, Second International Conference on Advances in Databases, Knowledge, and Data Applications, 2015.
4. Shuang Chen, Junli Li, Xiuying Wang, A Fast Exact
Euclidean Distance Transform Algorithm, Sixth International Conference on Image and Graphics, 2016.
5. Abhay B. Rathod, Sanjay M. Gulhane, Shailesh R. Padalwar, A comparative study on distance measuring approaches for permutation representations, IEEE International Conference on Advances in Electronics, Communication and Computer Technology (ICAECCT), 2016.
6. Shruti Gupta, Abha Thakral, Shilpi Sharma, Novel technique
for prediction analysis using normalization for an improvement in K-means clustering, International Conference on Information Technology (InCITe) – The Next Generation IT Summit on the Theme – Internet of Things: Connect your Worlds, 2016.
7. Sarra Ben Hariz, Zied Elouedi, IK-BKM: An incremental
clustering approach based on intra-cluster distance,
ACS/IEEE International Conference on Computer Systems and Applications – AICCSA, 2015.
8. Chellamal Surianarayanan, Gopinath Ganapathy, An
Approach to Computation of Similarity, Inter-Cluster Distance and Selection of Threshold for Service Discovery Using Clusters, IEEE Transactions on Services Computing, 2017.
9. M. Sato-IIic , On evaluation of clustering using homogeneity
analysis, Smc 2000 conference proceedings. 2000 ieee international conference on systems, man and cybernatics. ‘cybernatics evolving to systems, humans, organizations and their complex interactions, 2015.
10. Shruti Kapil, Meenu Chawla, Performance evaluation of
K-means clustering algorithm with various distance metrics, IEEE 3rd International Conference on Power Electronics, Intelligent Control and Energy Systems (ICPEICES), 2017.
11. Senem Kumova Metin, Bahar Karaoglan, Tarik Kisla, Text
similarity analysis using IR lists, 21st Signal Processing and
Communications Applications Conference (SIU), 2016.
12. Yaqin Xie, Yan Wang, Armugam Nallanathan, Lina Wang,
An Improved K-Nearest-Neighbor Indoor Localization Method Based on Spearman Distance, IEEE Signal Processing Letters, 2017.
13. Lu Liu, Jianqin Zhou, A route-like demand location problem
based on squared-Euclidean distance, International
Conference on Logistics, Informatics and Service Sciences (LISS), 2016.
14. Mehmet Yesilbudak, IIhami Colak, Ramazan Bayindir,
k-Means Partition of Monthly Average Isolation Period Data for
Turkey, 15th IEEE International Conference on Machine
Learning and Applications (ICMLA), 2016.
15. G. Chen, Yang Dai, A new distance measurement for
clustering time-course gene expression data, The 36th Annual
International Conference of the IEEE Engineering in Medicine and Biology Society, 2014.
16. Yu Jiankun, Guo Jun, An Improved Agglomerative Levels
K-Means Clustering Algorithm, International Conference on Management of e-Commerce and e-Government, 2014.
17. Xi-xian Niu, Guo-bin Han, Li-li Zhao, Clustering algorithm
research and realization based on Local Gathering Features, Eleventh International Conference on Fuzzy Systems and Knowledge Discovery (FSKD), 2014.
18. G. Santafe, J,A. Lozano, P.Larranaga, Bayesian Model
Averaging of Naïve Bayes for Clustering, IEEE Transactions on Systems, Man, and Cybernetics, Part B (Cybernetics), 2016.
19. Preeti Arora, Deepali Virmani, Shipra Varshney,
Substantiation of K-means and Affinity Propagation
algorithm, 7th International Conference on Cloud Computing,
Data Science & Engineering, 2017.
20. Shenping Xia, Jianjun Liu, Edwin Hancock, Mining
Exemplars for Object Modelling Using Affinity Propagtion,