RESEARCH NOTE
Comparison of methylation patterns
generated from genomic and cell-line
derived DNA using the Illumina Infinium
MethylationEPIC BeadChip array
L. J. Smyth
*, J. Kilner, A. P. Maxwell and A. J. McKnight
Abstract
Objectives: Genomic DNA (gDNA) is the optimal source of DNA for methylation analysis. This study compared meth-ylation patterns in gDNA derived from blood with cell-line derived DNA (clDNA) from the same individuals. The clDNA had been generated via an Epstein-Barr virus transformation of the participant’s lymphocytes. This analysis sought to determine whether clDNA has the potential to be utilised in lieu of finite/unavailable gDNA in methylation analyses using Illumina Infinium MethylationEPIC BeadChip arrays that assess 862,927 CpG sites.
Results: DNA samples were divided into two groups with eight gDNA and eight matched clDNA samples compared in each group (n = 16 individuals with 32 samples in total). Methylation patterns for gDNA samples generated for both groups were compared to the clDNA equivalent samples using Partek® Genomics Suite® to assess whether the significantly different CpG sites were consistent between both groups. In total, 28,632 CpG sites with significantly different levels of methylation (p < ×10−8) were common to both groups while 828,072 CpG sites assessed by the MethylationEPIC array were not significantly different in either group. This indicates that there is potential for clDNA to be used as a replacement for finite gDNA samples when absolutely necessary in DNA methylation studies.
Keywords: Cell-line, Diabetes, DNA, Epigenetics, Genomic, Methylation, MethylationEPIC
© The Author(s) 2019. This article is licensed under a Creative Commons Attribution 4.0 International License, which permits use, sharing, adaptation, distribution and reproduction in any medium or format, as long as you give appropriate credit to the original author(s) and the source, provide a link to the Creative Commons licence, and indicate if changes were made. The images or other third party material in this article are included in the article’s Creative Commons licence, unless indicated otherwise in a credit line to the material. If material is not included in the article’s Creative Commons licence and your intended use is not permitted by statutory regulation or exceeds the permitted use, you will need to obtain permission directly from the copyright holder. To view a copy of this licence, visit http://creat iveco mmons .org/licen ses/by/4.0/. The Creative Commons Public Domain Dedication waiver (http://creat iveco mmons .org/publi cdoma in/ zero/1.0/) applies to the data made available in this article, unless otherwise stated in a credit line to the data.
Introduction
DNA methylation is a key epigenetic feature, defined as the covalent addition of a methyl group to the 5-carbon position of a cytosine nucleotide at cytosine-phosphate-guanine (CpG) sites. These CpG sites frequently cluster within CpG islands that are repetitive sequences often located near gene promoters. DNA methylation has been associated with several complex diseases including chronic kidney disease (CKD) and diabetes [1–9].
The current gold-standard method of assessing DNA methylation patterns is through whole-genome
bisulphite sequencing (WGBS), a method which provides single-nucleotide resolution and whole-genome cover-age of approximately 95% of all CpG sites. However, this method requires large quantities of input DNA [10] and is financially prohibitive for many large-scale research studies. Illumina’s Infinium methylation arrays provide a user-friendly, cost-effective alternative, which require a lower input concentration of DNA [11, 12]. The Infinium MethylationEPIC array contains the most modern avail-able technology and provides coverage of 862,927 CpG sites [13].
The aim of this study was to compare blood-derived genomic DNA (gDNA) and DNA derived from Epstein– Barr virus (EBV) transformed cell-lines (clDNA) from the same participants using data generated using Illumina’s
Open Access
*Correspondence: laura.smyth@qub.ac.uk
Infinium MethylationEPIC BeadChip array. This pro-vided an opportunity to evaluate methylation data gen-erated from the more readily available clDNA samples compared to gDNA samples.
Main text Methods
Sample cohort
All participants were of White ancestry from the British Isles and provided written informed consent for research. Each participant was recruited as part of the All Ireland-Warren 3-Genetics of Kidneys in Diabetes (GoKinD) UK Collection. DNA was frozen in multiple aliquots having been extracted from whole blood using the salting out method and normalised following PicoGreen quanti-tation. EBV transformation of participants’ peripheral blood leukocytes was performed by the European Col-lection of Authenticated Cell Cultures (ECACC) to create clDNA [14].
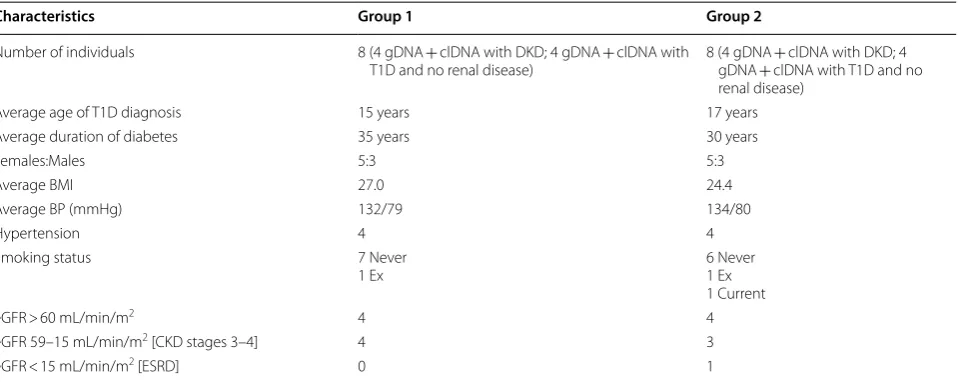
This study was conducted on 16 participants (with both gDNA and clDNA available for analyses). Eight partici-pants were individuals with ≥ 10 years duration of type 1 diabetes (T1D) who had also been diagnosed with dia-betic kidney disease (T1DKD) defined as persistent mac-roalbuminuria (≥ 500 mg/24 h), estimated glomerular filtration rate (eGFR) < 60 mL/min/m2 and hypertension (blood pressure ≥ 135/85 mmHg). The remaining eight individuals had ≥ 15 years duration of T1D and no evi-dence of renal disease on repeat testing (eGFR > 60 mL/ min/m2). Duration of diabetes differed by ≤ 2 years and age at diagnosis ≤ 5 years. Participants were divided into two groups of eight and the overall characteristics are
included within Table 1. Both gDNA and clDNA sam-ples were analysed for all included individuals. Each case and control gDNA sample was compared to the matched clDNA sample generated from blood taken from the same individual.
Infinium MethylationEPIC BeadChip array
Blood-derived DNA for each individual, both gDNA and clDNA (800 ng), was bisulphite treated (BST) using the EZ DNA Methylation™ Kit (Zymo Research, USA) using the manufacturer’s instructions. All samples were analysed together by the same individual, in the same laboratory.
To assess the methylation status of the CpG sites, the Infinium MethylationEPIC BeadChip array was used fol-lowing the manufacturer’s instructions. This array quan-titatively targets 862,927 CpG sites across the genome. Cases and controls were randomly distributed across each array. This high throughput platform evaluated individual methylation levels (β values) for each CpG site, ranging from 0 for unmethylated to 1 for complete methylation.
Quality control and statistical analyses
Raw methylation data was assessed for dye bias and quantile normalised as previously reported [1]. Quality control (QC) included evaluation of the bisulphite treat-ment conversion efficiency, dye specificity, hybridisation, and staining. This was assessed using GenomeStudio v2011 and BeadArray Controls Reporter software plat-forms (both Illumina).
Table 1 Characteristics of the individuals present within the Infinium MethylationEPIC BeadChip array analysis
BMI body mass index, BP blood pressure, CKD chronic kidney disease, eGFR estimated glomerular filtration rate, ESRD end-stage renal disease, mmHg millimetres of mercury, T1D type 1 diabetes
Characteristics Group 1 Group 2
Number of individuals 8 (4 gDNA + clDNA with DKD; 4 gDNA + clDNA with
T1D and no renal disease) 8 (4 gDNA gDNA + clDNA with T1D and no + clDNA with DKD; 4 renal disease)
Average age of T1D diagnosis 15 years 17 years
Average duration of diabetes 35 years 30 years
Females:Males 5:3 5:3
Average BMI 27.0 24.4
Average BP (mmHg) 132/79 134/80
Hypertension 4 4
Smoking status 7 Never
1 Ex 6 Never1 Ex
1 Current
eGFR > 60 mL/min/m2 4 4
eGFR 59–15 mL/min/m2 [CKD stages 3–4] 4 3
[image:2.595.60.540.516.707.2]MethylationEPIC analysis was performed using Partek® Genomics Suite® v7.19.1018. Only significant methylation values (p ≤×10−8) alongside a fold change of ± 2, generated in the analysis between gDNA and clDNA sample groups were included in the comparative analysis. Partek® Genomics Suite® was employed to com-plete Gene Ontology (GO) analysis and pathway enrich-ment analysis using the Kyoto Encyclopedia of Genes and Genomes (KEGG) database.
A schematic view of the methods undertaken in this manuscript is provided in Additional file 1: Appendix S1.
Results
This research note is focused on the comparison of Infin-ium MethylationEPIC results for gDNA and clDNA sam-ples, to determine whether clDNA has potential to be used in methylation array studies, in place of finite sam-ples of gDNA. Each resulting.idat file generated from the iScan was assessed using Illumina’s BeadArray Controls Reporter software. This software assessed the data in connection with a pre-set standard set of controls. These QC results are included in Additional file 2: Table S1.
The resulting.idat files were analysed using Genome Studio v2011 and Partek® Genomics Suite® v7.19.1018. The total number of CpG sites examined by the Infinium MethylationEPIC array was 862,927. No significant dif-ference in intensity levels was detected.
Differential methylation analysis between matched gDNA and clDNA samples for group 1 and group 2
Initially, the methylation patterns identified in the gDNA samples were directly compared to the clDNA equivalent samples within sample group 1 and then independently within sample group 2. Differentially methylated sites within each group were compared to assess whether the significantly different CpG sites were consistent between the two groups (p value ≤×10−8, fold change ≥±2). In total, 30,566 CpG sites were significantly differ-ent between the gDNA and clDNA samples within group 1 (n = 8 vs. n = 8, Additional file 2: Table S2), and 32,921 within group 2 (n = 8 vs. n = 8, Additional file 2: Table S3).
Furthermore, > 86% (28,632) of the CpG sites with sig-nificantly different levels of methylation were common to both groups. Only 6223 individual CpG sites differed in their level of methylation between groups 1 and 2, these are included in Additional file 2: Table S4. There-fore, 828,072 CpG sites assessed by this methylationEPIC array were not statistically different.
Differential methylation analysis between matched gDNA and clDNA samples for all samples
In the second analysis, all gDNA samples from groups 1 and 2 (n = 16) were directly compared to all clDNA
sam-ples from groups 1 and 2 (n = 16). These samples were
matched (n = 16 vs. n = 16). Overall, 6.2% of the CpG
sites covered by the array (53,764) were identified as hav-ing significantly different levels of methylation between the two groups (p ≤×10−8, fold change ≥±2). These
results are included within and Additional file 2: Table S5 and an additional breakdown is available within Fig. 1.
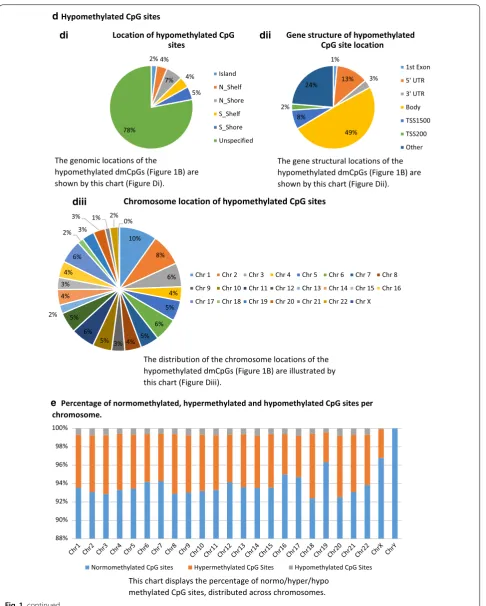
In summary, of the 53,764 CpG sites which have shown differential methylation (1438/142,137 (1%) probe I; 52,326/720,790 (7.3%) probe II on this array), 89% were hypermethylated in the gDNA sample group. Of the hypermethylated CpG sites, 15% are located within islands (1%), shelves (6%) and shores (8%), and 38% within gene bodies. In comparison, 22% of the hypo-methylated CpG sites were located within islands (2%), shelves (8%) and shores (12%) and 49% within gene bod-ies (Fig. 1). The chromosome location breakdown is simi-lar for both hypermethylated and hypomethylated CpG sites. Additional file 3: Figure S1a–d are included to illus-trate the pattern of average beta values, for each of the experimental groups.
GO and KEGG pathway analyses of differentially methylated genes
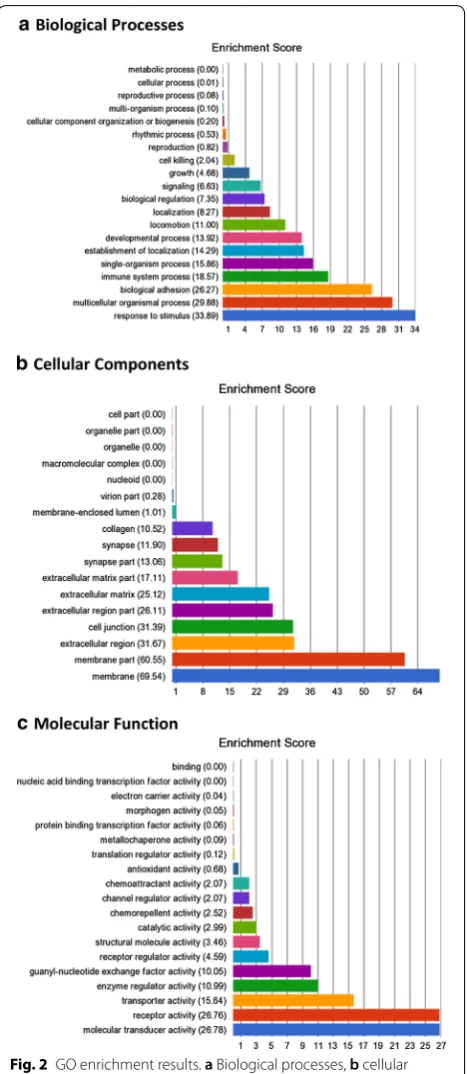
In order to assess the functional significance of the sig-nificant DNA methylation alterations between gDNA and clDNA, a GO enrichment analysis was undertaken. This assessed the biological processes, cellular compo-nents and molecular functions of the genes within which the top-ranked CpG sites were located. A total of 54 GO functions were found to have an enrichment score ≥ 10,
alongside p ≤×10−8 and these are included within
Addi-tional file 2: Table S6 and Fig. 2. The processes with the top enrichment scores included signal transduction, sig-nalling transduction activity, calcium ion binding, cell adhesion and immune system processes.
89% 11%
Percentage of hypermethylated or hypomethylated CpG sites
Hypermethylation in gDNA Hypomethylation in gDNA 6%
94%
Altered methylation status of CpG sites
Altered methylation between gDNA and clDNA No change in methylation between gDNA and clDNA a
b
c ci
ciii
cii
This chart depicts the percentage of dmCpGs found by the analysis undertaken during which gDNA samples from groups 1 and 2 (n=16) were directly compared to all clDNA samples from groups 1 and 2 (n=16). Only 6% of CpG sites covered by this array were shown to be differentially methylated, thus demonstrating that this EPIC array provides consistent results for 94% of probes using clDNA as a viable alternative to the gold standard, but not always available gDNA.
Of the dmCpGs shown in Figure 1A, 89% were hypermethylated and 11% were hypomethylated in the gDNA sample group.
Hypermethylated CpG sites
2%
9% 2%
38%
8% 2% 39%
Gene structure of hypermethylated CpG site location
1st Exon 5' UTR 3' UTR Body TSS1500 TSS200 Other
10% 8%
7%
5% 5% 6% 5% 5% 3% 5% 6% 5% 3%
3% 3%
3% 4% 2% 3%3% 1%
2% 1%
Chromosome location of hypermethylated CpG sites
Chr 1 Chr 2 Chr 3 Chr 4 Chr 5 Chr 6 Chr 7 Chr 8 Chr 9 Chr 10 Chr 11 Chr 12 Chr 13 Chr 14 Chr 15 Chr 16 Chr 17 Chr 18 Chr 19 Chr 20 Chr 21 Chr 22 Chr X
1% 3% 4% 3% 4%
85%
Location of hypermethylated CpG sites
Island N_Shelf N_Shore S_Shelf S_Shore Unspecified
The genomic locations of the
hypermethylated dmCpGs (Figure 1B) are shown by this chart (Figure Ci).
The gene structural locations of the hypermethylated dmCpGs (Figure 1B) are shown by this chart (Figure Cii).
The distribution of the chromosome locations of the hypermethylated dmCpGs (Figure 1B) are illustrated by this chart (Figure Ciii).
Fig. 1 Comparison of differentially methylated CpG sites (dmCpGs) between gDNA and clDNA. a Altered methylation status of CpG sites between gDNA and clDNA; b Percentage of hypermethylated or hypomethylated CpG sites in gDNA; c Hypermethylated CpG sites; d Hypomethylated CpG sites; e Percentage of normomethylated, hypermethylated and hypomethylated CpG sites per chromosome. CpG cytosine-phosphate-guanine,
[image:4.595.60.535.80.670.2]d Hypomethylated CpG sites
1%
13% 3%
49% 8%
2% 24%
Gene structure of hypomethylated CpG site location
1st Exon 5' UTR 3' UTR Body TSS1500 TSS200 Other 2% 4%
7% 4%
5%
78%
Location of hypomethylated CpG sites
Island N_Shelf N_Shore S_Shelf S_Shore Unspecified
10%
8%
6%
4% 5%
6% 5% 4% 3% 5% 6% 5% 2%
4% 3% 4%
6% 2% 3%
3% 1% 2% 0%
Chromosome location of hypomethylated CpG sites
Chr 1 Chr 2 Chr 3 Chr 4 Chr 5 Chr 6 Chr 7 Chr 8 Chr 9 Chr 10 Chr 11 Chr 12 Chr 13 Chr 14 Chr 15 Chr 16 Chr 17 Chr 18 Chr 19 Chr 20 Chr 21 Chr 22 Chr X
The genomic locations of the
hypomethylated dmCpGs (Figure 1B) are shown by this chart (Figure Di).
The gene structural locations of the hypomethylated dmCpGs (Figure 1B) are shown by this chart (Figure Dii).
The distribution of the chromosome locations of the hypomethylated dmCpGs (Figure 1B) are illustrated by this chart (Figure Diii).
Percentage of normomethylated, hypermethylated and hypomethylated CpG sites per chromosome.
88% 90% 92% 94% 96% 98% 100%
Normomethylated CpG sites Hypermethylated CpG Sites Hypomethylated CpG Sites
This chart displays the percentage of normo/hyper/hypo methylated CpG sites, distributed across chromosomes.
di dii
diii
e
[image:5.595.58.545.84.691.2]Assessment of differential methylation between sample groups of the same origin
Lastly, the methylation status was quantitatively deter-mined between the two sample types within groups 1 and 2; the gDNA (n = 8) samples in group 1 were directly compared to the gDNA samples (n = 8) in group 2. This was then repeated for the clDNA (n = 8 vs. n = 8) sam-ples. Reassuringly, no CpG sites were significantly differ-ent between the two analysis groups.
Discussion
This study reports a comparison of the data generated by Illumina’s Infinium MethylationEPIC BeadChip array technology for gDNA from peripheral blood leukocytes from 16 individuals and clDNA, derived from EBV trans-formation of the same samples into cell lines performed by the ECACC. The methylationEPIC BeadChip array covers 862,927 CpG sites, which makes this the largest gDNA and clDNA methylation profiling study using this array [15].
DNA methylation plays a key role in epigenetic gene regulation and is the most well studied epigenetic fac-tor [16]. It has been shown to alter with age and smok-ing status and therefore it was important to align the two analysis groups for age of T1D diagnosis and duration of diabetes [17–19].
Through this analysis, we have established that approx-imately 6% of the CpG sites covered by the Methylatio-nEPIC array provided significantly different p-values between gDNA and clDNA based on their methylation beta values. We have not addressed potential causes of the observed differences in methylation [20]. This may be due to the method through which the cell-line trans-formation occurs [21–23]. One study assessing oral keratinocytes [24] has shown that EBV infection itself affects methylation levels, resulting in alterations to gene expression. Consistent with Sugawara and colleagues, they also demonstrated that the epigenetic alterations were retained following removal of the virus [24, 25].
Furthermore, the cell-line passage number has been demonstrated to affect epigenetic modifications. Gra-fodatskaya et al. [26] compared methylation patterns in blood cells with lymphoblastoid cell-lines (LCLs) of different passage numbers. They showed that low pas-sage numbers and one freeze–thaw cycle does not affect methylation, but identified that LCLs can be prone to alterations in the DNA methylation at sporadic genomic locations when at high passage numbers.
Two genes AGXT and INS which have CpG sites included within the 6223 CpG sites with a significant dif-ference in methylation levels between gDNA vs. clDNA (groups 1 and 2), had previously also been shown to be differentially methylated in an investigation which
[image:6.595.58.292.86.624.2]assessed 25,000 CpG sites from six individuals by Bren-nan and colleagues between gDNA and clDNA [21].
We have also shown that the CpG sites with differen-tial methylation were not due to differences between the individuals within the two groups. Neither compari-son, gDNA (group 1 vs. group 2), nor clDNA (group 1 vs. group 2) provided any significantly different levels of methylation.
We have previously shown that clDNA is a suitable replacement for gDNA in SNP-based analyses [27] and it is evident from these results, that the clDNA has poten-tial to be an alternative material source for assessment of DNA methylation using the methylationEPIC array.
Limitations
A potential limitation is that the methylation data was generated for only 16 matched gDNA and clDNA sam-ples, compared in groups of eight samples. It would be advantageous to repeat this on a larger sample size. As the cell line DNA was prepared off-site, it is possible that the number of freeze–thaw cycles of the two differ-ent collections could have been differdiffer-ent, but we believe there were less than three freeze–thaw cycles for each aliquot.
Supplementary information
Supplementary information accompanies this paper at https ://doi. org/10.1186/s1310 4-019-4853-4.
Additional file 1: Appendix S1. Illustration of methods.
Additional file 2: Table S1. Illumina Bead Array Controls Reporter for the gDNA and clDNA samples. Table S2. Top-ranked differentially methylated CpG sites for gDNA vs. clDNA (group 1). Table S3. Top-ranked differentially methylated CpG sites for gDNA vs. clDNA (group 2). Table S4. Top-ranked CpG sites which differed between groups 1 and 2 (gDNA vs. clDNA - ST2 and ST3). Table S5. Top-ranked CpG sites which were common between groups 1 and 2 (gDNA vs. clDNA - ST2 and ST3). Table S6. GO enrichment analysis for genes where top-ranked CpG sites are located. Table S7.
Enriched pathways (KEGG) for genes where top-ranked CpG sites are located.
Additional file 3: Figure S1. Illustration of the average methylation beta value patterns generated for each of the four groups. A) Group 1 (gDNA); B) Group 1 (clDNA); C) Group 2 (gDNA); D) Group 2 (clDNA).
Abbreviations
BMI: body mass index; BP: blood pressure; BST: bisulphite treated; CKD: chronic kidney disease; clDNA: cell-line derived DNA; CpG: cytosine-phosphate-gua-nine; DCs: diabetic controls; DKD: diabetic kidney disease; DNA: deoxyribose nucleic acid; EBV: Epstein–Barr virus; ECACC : European Collection of Authenti-cated Cell Cultures; eGFR: estimated glomerular filtration rate; ESRD: end-stage renal disease; gDNA: genomic DNA; GO: gene ontology; GoKinD: Genetics of Kidneys in Diabetes; KEGG: Kyoto Encyclopedia of Genes and Genomes; LCLs: lymphoblastoid cell-lines; mmHg: millimetres of mercury; QC: quality control; T1D: type 1 diabetes; T1DKD: type 1 diabetes and kidney disease; WGBS: whole-genome bisulphite sequencing.
Acknowledgements
We acknowledge the support of the funding bodies listed.
Authors’ contributions
LJS, APM and AJM conceived the study and participated in its design and coordination. LJS and JK performed the analysis. LJS drafted the manuscript. All authors read and approved the final manuscript.
Funding
LJS is the recipient of a Northern Ireland Kidney Research Fund Fellowship (NIKRF). Funding was also provided by GEnetics of Nephropathy an Interna-tional Effort (GENIE) and Science Foundation Ireland and the Department for the Economy, Northern Ireland (15/IA/3152). This work has been partly funded by the Medical Research Council (Award Reference MC_PC_15025) and the Public Health Agency R&D Division (Award Reference STL/4760/13). None of the funding bodies had a role in the study design or analysis.
Availability of data and materials
The datasets generated and/or analysed during the current study are available from the corresponding author on reasonable request.
Ethics approval and consent to participate
Ethical approval for research involving the ECACC samples was granted by the Office for Research Ethics Committees Northern Ireland (ORECNI)—reference number ORECNI 175/23: RO321. Research ethics approval for the GoKinD sam-ples was obtained from the South and West Multicentre Research Ethics Com-mittee (MREC/98/6/71). All participants provided written informed consent for research. No individual level data is being reported in this manuscript.
Consent for publication
Not applicable.
Competing interests
The authors declare that they have no competing interests.
Received: 25 October 2019 Accepted: 10 December 2019
References
1. Smyth LJ, McKay GJ, Maxwell AP, McKnight AJ. DNA hypermethylation and DNA hypomethylation is present at different loci in chronic kidney disease. Epigenetics. 2014;9(3):366–76.
2. Bansal A, Pinney SE. DNA methylation and its role in the pathogenesis of diabetes. Pediatr Diabetes. 2017;18(3):167–77.
3. Chu AY, Tin A, Schlosser P, Ko Y-A, Qiu C, Yao C, et al. Epigenome-wide association studies identify DNA methylation associated with kidney function. Nat Commun. 2017;8(1):1286.
4. Zhang H, Cai XU, Yi B, Huang J, Wang J, Sun J. Correlation of CTGF gene promoter methylation with CTGF expression in type 2 diabetes mellitus with or without nephropathy. Mol Med Rep. 2014;9(6):2138–44. 5. Gu T, Falhammar H, Gu HF, Brismar K. Epigenetic analyses of the
insulin-like growth factor binding protein 1 gene in type 1 diabetes and diabetic nephropathy. Clin Epigenetics. 2014;6(1):1–6.
6. Marumo T, Yagi S, Kawarazaki W, Nishimoto M, Ayuzawa N, Watanabe A, et al. Diabetes induces aberrant DNA methylation in the proximal tubules of the kidney. J Am Soc Nephrol. 2015;26(10):2388–97.
7. Ghattas M, El-shaarawy F, Mesbah N, Abo-Elmatty D. DNA methylation status of the methylenetetrahydrofolate reductase gene promoter in peripheral blood of end-stage renal disease patients. Mol Biol Rep. 2014;41(2):683–8.
8. Watanabe A, Marumo T, Kawarazaki W, Nishimoto M, Ayuzawa N, Ueda K, et al. Aberrant DNA methylation of pregnane X receptor underlies meta-bolic gene alterations in the diabetic kidney. Am J Physiol Ren Physiol. 2018;314(4):F551–60.
•fast, convenient online submission •
thorough peer review by experienced researchers in your field • rapid publication on acceptance
• support for research data, including large and complex data types •
gold Open Access which fosters wider collaboration and increased citations maximum visibility for your research: over 100M website views per year •
At BMC, research is always in progress.
Learn more biomedcentral.com/submissions
Ready to submit your research? Choose BMC and benefit from:
10. Dirks RAM, Stunnenberg HG, Marks H. Genome-wide epigenomic profiling for biomarker discovery. Clin Epigenetics. 2016. https ://doi. org/10.1186/s1314 8-016-0284-4.
11. Smyth LJ, Duffy S, Maxwell AP, McKnight AJ. Genetic and epigenetic factors influencing chronic kidney disease. Am J Physiol Renal Physiol. 2014;307(7):F757–76.
12. Teh AL, Pan H, Lin X, Lim YI, Patro CPK, Cheong CY, et al. Comparison of Methyl-capture Sequencing vs. Infinium 450 K methylation array for methylome analysis in clinical samples. Epigenetics. 2016;11(1):36–48. 13. Pidsley R, Zotenko E, Peters TJ, Lawrence MG, Risbridger GP, Molloy
P, et al. Critical evaluation of the Illumina MethylationEPIC BeadChip microarray for whole-genome DNA methylation profiling. Genome Biol. 2016;17(1):208.
14. Public Health England. Culture collections: about ECACC. https ://www. phe-cultu recol lecti ons.org.uk/colle ction s/ecacc .aspx. Accessed 2 Aug 2018.
15. Zhang C, Zhang R, Chen Z, Chen J, Ruan J, Lu Z, et al. Differential DNA methylation profiles of human B lymphocytes and Epstein-Barr virus-immortalized B lymphocytes. Chinese J Cancer Res. 2018;31(1):104–11. 16. Martin EM, Fry RC. Environmental Influences on the Epigenome: expo-sure- Associated DNA Methylation in Human Populations. Annu Rev Public Health. 2018;39:309–33.
17. López-otín C, Blasco MA, Partridge L, Serrano M, Kroemer G. The hall-marks of aging carlos. Cell. 2013;153(6):1194–217.
18. Klebaner D, Huang Y, Hui Q, Taylor JY, Goldberg J, Vaccarino V, et al. X chromosome-wide analysis identifies DNA methylation sites influenced by cigarette smoking. Clin Epigenetics. 2016;8:20.
19. Fragou D, Pakkidi E, Aschner M, Samanidou V, Kovatsi L. Smoking and DNA methylation: correlation of methylation with smoking behavior and association with diseases and fetus development following prenatal exposure. Food Chem Toxicol. 2019;129(April):312–27.
20. Lam WKJ, Jiang P, Chan KCA, Peng W, Shang H, Heung MMS, et al. Methylation analysis of plasma DNA informs etiologies of Epstein–Barr virus-associated diseases. Nat Commun. 2019;10(1):1–11.
21. Brennan EP, Ehrich M, Brazil DP, Crean JK, Murphy M, Sadlier DM, et al. Comparative analysis of DNA methylation profiles in periph-eral blood leukocytes versus lymphoblastoid cell lines. Epigenetics. 2009;4(3):159–64.
22. Åberg K, Khachane AN, Rudolf G, Nerella S, Fugman DA, Tischfield JA, et al. Methylome-wide comparison of human genomic DNA extracted from whole blood and from EBV-transformed lymphocyte cell lines. Eur J Hum Genet. 2012;20(9):953–5.
23. Çalişkan M, Cusanovich DA, Ober C, Gilad Y. The effects of EBV transforma-tion on gene expression levels and methylatransforma-tion profiles. Hum Mol Genet. 2011;20(8):1643–52.
24. Birdwell CE, Queen KJ, Kilgore PCSR, Rollyson P, Trutschl M, Cvek U, et al. Genome-wide DNA methylation as an epigenetic consequence of Epstein-Barr virus infection of immortalized keratinocytes. J Virol. 2014;88(19):11442–58.
25. Sugawara H, Iwamoto K, Bundo M, Ueda J, Ishigooka J, Kato T. Compre-hensive DNA methylation analysis of human peripheral blood leukocytes and lymphoblastoid cell lines. Epigenetics. 2011;6(4):509–16.
26. Grafodatskaya D, Choufani S, Ferreira JC, Butcher DT, Lou Y, Zhao C, et al. EBV transformation and cell culturing destabilizes DNA methylation in human lymphoblastoid cell lines. Genomics. 2010;95(2):73–83. 27. Smyth LJ, Maxwell AP, Benson KA, Kilner J, McKay GJ, McKnight AJ.
Validation of differentially methylated microRNAs identified from an epig-enome-wide association study; Sanger and next generation sequencing approaches. BMC Res Notes. 2018;11:767.
Publisher’s Note