Analysis for Optimal Degree of Replication
Jai-Hoon Kim
Graduate School of Information and Communications
Ajou University, S. Korea
[email protected]
Geoffrey Fox
Pervasive Technology Institute
Indiana University, USA
[email protected]
1.
Introduction
Replication technologies are widely used in distributed systems to improve performance in terms of availability and scalability. In distributed systems, there are many cases requiring replication. We can be categorized the reasons of replication as follows:
Fault-tolerance (availability): When a system component fails, another replicated component takes over the task. System or component is replicated for enhancing availability (ex., dual system, RAID, etc.)
Load distribution (scalability): By replicating computing or data resources, their tasks can be distributed to avoid bottleneck which causes performance degradations. Mirrored Web site, replicated database, and replicated disk storage are examples of task or data replications to improve scalability.
Cache (performance): Cache is a kind of replication in which data is replicated on a closer place to access fast (e.g., CPU cache, disk cache, and Web proxy)
Many system components (ex., disk storage, file systems, databases, software tasks, and system itself) can be replicated to obtain the advantages. In fault-prone environments, replication strategies of system components (hardware or software) are popularly adopted to improve system availability [1,5,6,7]. By replicating components, system can continue its jobs even though some component fails (ex., duplex system or TMR). Also, replication has the benefit of scalability by distributing the task load among components (ex., mirrored Web site or clusters) [2,3,4]. However, it requires cost for physical redundancy and maintaining consistency among redundancy.
and degree of it; cost of physical component, re-do (or recovery) overhead on a failure, failure rate, and access (read and write) rate and cost.
We analyze cost of replication in various aspects, which help us to choose proper degree of replication in error-prone systems. Fig.1 shows the outline of our scheme for choosing degree of replication. Our proposed cost model and algorithm to choose proper degree of replication is simple. However, it would help us to decide whether or not to replicate and, if replicate, degree of replication in our system design.
Fig.1 Algorithm for choosing degree of replication
2.
Cost Analysis for Degree of Replication
The total cost of replication is:
𝑐
𝑠(𝑥) = 𝑐
𝑝(𝑥) +
𝑐
𝑎(𝑥) +
𝑐
𝑟(𝑥)
,
where 𝑐𝑠(𝑥) is total cost function, x is degree of replication, 𝑐𝑝(𝑥) is cost of physical replication,
𝑐𝑎(𝑥) is cost of resource access, and 𝑐𝑟(𝑥) is cost of re-do overhead due to all x replications’ failures.
Now, we analyze the three costs; 𝑐𝑝(𝑥), 𝑐𝑎(𝑥), and 𝑐𝑟(𝑥).
(1) We assume that cost of physical replication is proportional to the number of replicated component:
𝑐
𝑝(𝑥) =
𝑥𝑐
𝑝ℎ𝑦,
where𝑐
𝑝ℎ𝑦 is cost of physical component per time unit.(2) We assume that cost of access consists of read cost and write cost (consistency overhead among replications). In general, read cost adversely proportional to the number of replication while consistency overhead is proportional to:
𝑐
𝑎(𝑥) =
𝜆
𝑟𝑟𝑎𝑟𝑐𝑟𝑟𝑟𝑟𝑥+
𝜆
𝑤𝑟𝑤𝑤𝑟𝑥𝑐
𝑐𝑐𝑐𝑠𝑤𝑠𝑤,
where λread, λwrite,𝑐𝑟𝑟𝑟𝑟𝑥 , and 𝑥𝑐𝑐𝑐𝑐𝑠𝑤𝑠𝑤 denote read rate, write rate, read overhead, and consistency overhead, respectively.
(3) Re-do overhead is required on all x replicated components’ failures:
Cost Model
Algorithm
for optimal degree ofreplication cost of physical
component
re-do overhead
failure rate
access rate and cost
Inputs
Outputs
estimated access cost
optimal degree of replication
cost of physical component
re-do overhead
failure rate
𝑐
𝑟(𝑥) = (1
− 𝜀
−𝜆𝜆)
𝑥𝑐
𝑟𝑟−𝑟𝑐,
where 𝜆, T, and 𝑐𝑟𝑟−𝑟𝑐are failure rate, transaction time, and re-do overhead, respectively. Thus,
𝑐
𝑠(𝑥) = 𝑐
𝑝(𝑥) +
𝑐
𝑎(𝑥) +
𝑐
𝑟(𝑥)
=
𝑥𝑐
𝑝ℎ𝑦+
𝜆
𝑟𝑟𝑎𝑟𝑐𝑟𝑟𝑟𝑟𝑥
+
𝜆
𝑤𝑟𝑤𝑤𝑟𝑥𝑐
𝑐𝑐𝑐𝑠𝑤𝑠𝑤+ (1
− 𝜀
−𝜆𝜆)
𝑥𝑐
𝑟𝑟−𝑟𝑐We analyze replication cost as the function of replication degree. Our analysis is simple but it is useful to decide proper replication degree in the various applications in which condition is different to each other.
In general, failure rate is small. Thus, we can approximate
𝑐
𝑠(𝑥)
as follows:𝑐
𝑠(𝑥) = 𝑥𝑐
𝑝ℎ𝑦+
𝜆
𝑟𝑟𝑎𝑟𝑐
𝑟𝑟𝑎𝑟𝑥
+
𝜆
𝑤𝑟𝑤𝑤𝑟𝑥𝑐
𝑐𝑐𝑐𝑠𝑤𝑠𝑤+
�1
− 𝜀
−𝜆𝜆�
𝑥𝑐
𝑟𝑟−𝑟𝑐≅
𝑥𝑐
𝑝ℎ𝑦+
𝜆
𝑟𝑟𝑎𝑟𝑐𝑟𝑟𝑟𝑟𝑥+
𝜆
𝑤𝑟𝑤𝑤𝑟𝑥𝑐
𝑐𝑐𝑐𝑠𝑤𝑠𝑤+ (𝜆𝜆)
𝑥𝑐
𝑟𝑟−𝑟𝑐(1)
If we assume that access cost (
𝑐
𝑎𝑐𝑐𝑟𝑠𝑠,
read and write cost) is constant (𝑐
𝑎)
or ignored (𝑐
𝑎= 0)
, then;𝑐
𝑠(𝑥) = 𝑥𝑐
𝑝ℎ𝑦+
𝑐
𝑎+ (𝜆𝜆)
𝑥𝑐
𝑟𝑟−𝑟𝑐(2)
∂𝑐𝑠∂𝑥
=
𝑐
𝑝ℎ𝑦+ (𝜆𝜆)
𝑥ln (𝜆𝜆)𝑐
𝑟𝑟−𝑟𝑐As
∂𝑐
∂𝑥
𝑠= 0
when𝑥
=
𝑙𝑙
𝜆𝜆�−ln (𝜆𝜆)𝑐
𝑐
𝑝ℎ𝑦𝑟𝑟−𝑑𝑑�,
𝑐
𝑠(𝑥)
is minimum when𝑥
=
𝑙𝑙
𝜆𝜆�−
ln (𝜆𝜆)𝑐
𝑐
𝑝ℎ𝑦 𝑟𝑟−𝑟𝑐�
Now, we obtain the optimal solution of x (degree of replication). 𝑐𝑠(𝑥), total cost function of x (degree of replication), has the minimum value,
𝑙𝑙
𝜆𝜆�−
ln (𝜆𝜆𝑐𝑝ℎ𝑦)𝑐𝑟𝑟−𝑟𝑑� 𝑐
𝑝ℎ𝑦+
𝑐
𝑎−
ln (𝜆𝜆𝑐𝑝ℎ𝑦)𝑐𝑟𝑟−𝑟𝑑𝑐
𝑟𝑟−𝑟𝑐,
when x =
𝑙𝑙
𝜆𝜆�−
𝑐𝑝ℎ𝑦ln (𝜆𝜆)𝑐𝑟𝑟−𝑟𝑑
�.
Algorithm to obtain the optimal degree of replication (
𝑥
𝑐𝑝𝑤)
is as follows:Algorithm I
(when
𝑐
𝑎is variable)
𝑓𝑑𝑟 (𝑥
= 1; 𝑥 ≤ 𝑥
𝑚𝑎𝑥; + +
𝑥)
compute 𝑐
𝑠(𝑥) = 𝑥𝑐
𝑝ℎ𝑦+
𝜆
𝑟𝑟𝑎𝑟𝑐
𝑟𝑟𝑎𝑟𝑥
+
𝜆
𝑤𝑟𝑤𝑤𝑟𝑥𝑐
𝑐𝑐𝑐𝑠𝑤𝑠𝑤+ (𝜆𝜆)
𝑥𝑐
𝑟𝑟−𝑟𝑐compute natual number 𝑥
𝑐𝑝𝑤,
𝑠𝑠𝑐ℎ 𝑡ℎ𝑎𝑡 𝑐
𝑠�𝑥
𝑐𝑝𝑤�
= min
x>0𝑐
𝑠(𝑥)
Algorithm II
(when
𝑐
𝑎is constant)
compute real number 𝑥
=
𝑙𝑙
𝜆𝜆�−
ln (𝜆𝜆)𝑐
𝑐
𝑝ℎ𝑦𝑟𝑟−𝑟𝑐
�
if (
𝑥 ≤
1)
𝑥
𝑐𝑝𝑤= 1
else if (x is natural number)
𝑥
𝑐𝑝𝑤=
𝑥
3.
Performance Measures
We measure the performance of degree of replication by varying system parameters (cost of physical component, failure rate, and re-do overhead).
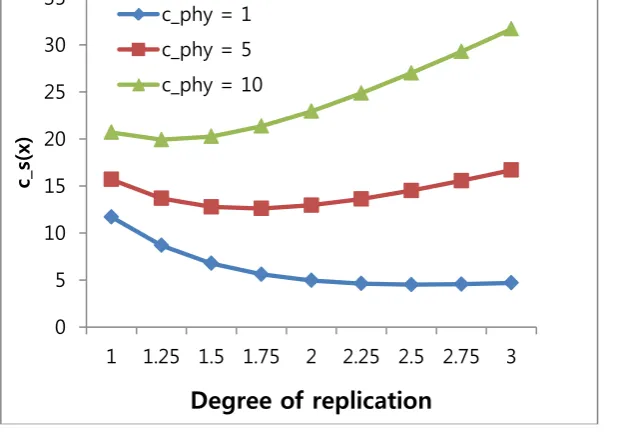
Fig.2 shows the performance for different cost of physical component. We assume the system parameters as follows: 𝜆𝑟𝑟𝑎𝑟 = 0.3,𝜆𝑤𝑟𝑤𝑤𝑟 = 0.2,𝑐𝑟𝑟𝑎𝑟= 1,𝑐𝑐𝑐𝑐𝑠𝑤𝑠𝑤= 2,𝜆= 0.01,𝜆= 20, and
𝑐
𝑟𝑟−𝑑𝑑=50. In this analysis, costs are minimal on x (degree of replication) about 2.5, 1.75, and 1.25 when
𝑐
𝑝ℎ𝑦 (cost of physical component) are 1, 5, and 10, respectively. However, as degree of replication [image:4.595.148.457.315.533.2]is integer, costs are minimal on x being 3, 2, and 1 when
𝑐
𝑝ℎ𝑦 are 1, 5, and 10, respectively. We find that optimal degree of replication is different for each cost of𝑐
𝑝ℎ𝑦. Our analysis is simple. But, we can choose a proper degree of replication for each cost of physical component by using the results of our cost analysis. In general, high cost of physical component limits the replication.Fig. 2 Performance comparison by varying cost of physical component
Similarly, we measure the performance for different re-do overheads. When a system fails, we need to re-do. Re-do overhead is different for each task. If PC fails and is rebooted while we type a report, the re-do overhead is re-typing the report. On the other hand, if a computer embedded on a space shuttle fails, which results in out of control and may lose the space shuttle, the re-do overhead (re-launching the space shuttle) is very huge. Fig.3 shows the performance for different cost of re-do overheads. In this experiment, we assume the system parameters as follows: 𝑐𝑝ℎ𝑦= 5, 𝜆𝑟𝑟𝑎𝑟= 0.3,𝜆𝑤𝑟𝑤𝑤𝑟= 0.2,𝑐𝑟𝑟𝑎𝑟 = 1, 𝑐𝑐𝑐𝑐𝑠𝑤𝑠𝑤= 2,𝜆= 0.01, and 𝜆= 20. In this analysis, we can find that as re-do overhead increases, optimal degree of replication increases. By using our cost analysis, we can choose proper degree of replication according to re-do overhead.
0 5 10 15 20 25 30 35
1 1.25 1.5 1.75 2 2.25 2.5 2.75 3
c_s(
x)
Degree of replication
Fig.3 Performance comparison by varying cost of re-do
We also measure the performance for different failure rate. When a system fails more frequently, we need higher degree of replication to increase availability and reduce the re-do probability. Fig.4 shows the performance on different failure rates. We set up the system parameters as follows: 𝑐𝑝ℎ𝑦= 1, 𝜆𝑟𝑟𝑎𝑟 = 0.3,𝜆𝑤𝑟𝑤𝑤𝑟= 0.2,𝑐𝑟𝑟𝑎𝑟 = 1, 𝑐𝑐𝑐𝑐𝑠𝑤𝑠𝑤= 2, 𝜆= 20 and
𝑐
𝑟𝑟−𝑑𝑑=30. By using our cost analysis, we can choose proper degree of replication according to the failure rate.
Fig.4 Performance comparison by varying failure rate
We measure the optimal degree of replication according to system variables. (We assume that access cost (ca, read and write cost) is constant or ignored (ca= 0) as we obtain Eq. (2).) Fig.5 shows the optimal degree by varying cphy (1~4) and cre−do(1~1000). We set up other system parameters as follows: λread= 0.3,λwrite= 0.2, cread= 1, cconsist= 2, λ= 0.001, and T = 20 . As values cphy decreases and cre−do increases, the optimal degree of replication increases. As Fig.5
0 10 20 30 40 50
1 1.25 1.5 1.75 2 2.25 2.5 2.75 3
c_s(
x)
Degree of replication c_re-do = 10 c_re-do = 100 c_re-do = 200
0 2 4 6 8 10 12
1 1.25 1.5 1.75 2 2.25 2.5 2.75 3
c_s(
x)
Degree of replication
shows a theoretical optimal value of degree of replication, we need to choose two nearest natural numbers and obtain the value which has smaller value of cs(x) as described in Algorithm II.
Fig.5 Optimal degree of replication by varying
𝑐𝑝ℎ𝑦 (1~4) and𝑐
𝑟𝑟−𝑟𝑐(1~1000).
We also measure the optimal degree of replication according to other system variables. Fig.6 shows the optimal degree by varying cphy (1~4) and λ (0.0001~0.002). We set up other system
parameters as follows: λread = 0.3, λwrite= 0.2, cread= 1, cconsist= 2, λ= 0.001, T = 200, and cre−do= 100 . As values cphy
decreases and λ increases, the optimal degree of replication increases. As described in Algorithm II, we need to choose two nearest natural numbers and obtain the value which has smaller value of cs(x).
1 3 10
30100 3001000
-1 0 1 2 3 4 5
1 2
3 4
c_re-do
c_
s
c_phy
Fig.6 Optimal degree of replication by varying
𝑐𝑝ℎ𝑦 (1~4) and 𝜆 (0.0001~0.002).4.
Conclusion
Replication is widely used technology to increase availability and scalability. However, it requires cost for physical redundancy and maintaining consistency among replications. Many researches investigated replication methods to improve availability and scalability while reduce replication overhead. However, researches to obtain the proper degree of replication are seldom performed. We analyzed the cost of replication to choose the proper degree of replication according to various system parameters: cost of physical component, re-do overhead, and failure rate. Our analysis is simple. But, we can select the optimal degree of replication on a system design considering the various aspects. In general, low cost of physical component, high re-do overhead, and high failure rate encourage high degree of replication.
References
[1] Sung-Hwa Lim, Byoung-Hoon Lee, and Jai-Hoon Kim, “Diversity and fault avoidance for dependable replication systems,” Information Processing Letters, vol. 108, pp. 33-37, 2008.
[2] Sung-Hwa Lim and Jai-Hoon Kim, “Optimal Server Replication Schemes to Reduce Location Management Cost in Cellular Network,” IEICE Trans. on Communications, vol. E89-B, no. 10, pp. 2841-2849, 2006.
[3] Xiaohua Jia, Deying Li, Hongwei Du, and J. Cao, “On optimal replication of data object at hierarchical and transparent Web proxies,” IEEE Transactions on Parallel and Distributed Systems, vol. 16, Issue 8, pp. 673-685, 2005.
0.0001 0.0002
0.0005 0.001
0.002
0 1 2 3 4 5
1
2
3
4 lamdba
c_
s
c_phy
[4] Avraham Leff, Joel Wolf, and Philip Yu, “Replication algorithms in a remote caching architecture,”
IEEE Transactions on Parallel and Distributed Systems, vol. 4, no. 11, pp. 1185-1204, 1993.
[5] Chetan Shankar, Anand Ranganathan and Roy Campbell, “Towards Fault Tolerant Pervasive Computing,” IEEE Technology and Society, 24 (2005), 38-44.
[6] L. Strigini, “Fault Tolerance Against Design Faults,” Hassan Diab and Albert Zomaya, (Eds.),
Dependable Computing Systems: Paradigms, Performance Issues, and Applications, J. Wiley & Sons, 2005, pp. 213-241.