]Abstract: Purpose –This paper describes a framework for providing quantitative measurement of a Course Learning Outcome (CLO)in assessing students’ achievement at higher learning institutions under the situation of a course taught by many lecturers in a large class size. Under such situation, the existence of different views on assessment method sand measurements from lecturers and diversity of students’ ability to achieve each CLO can be a burdensome task in order to have a standard measurement for assessment in Outcome Based Education (OBE) system. The study in this paper was conducted for the course of Introductory Statistics, which being taught to the students of Universiti Utara Malaysia.
Methodology –The course’ result of 110 students in one semester were collected and used to calculate the CLOs’ score. In order to calculate the CLOs’ score, the analysis in this study used three different methods, which are average, threshold and performance vector methods. After the process of calculating the CLOs is completed by using the methods, all CLOs’ achievement is grouped and tabulated in a table as a Course Performance Report. The report is used to assess the students’ performance for the course.
Findings –From the study, overall result showed that all CLOs of the course is success to achieve based on the outcome from the three different methods. Nevertheless, detail outcome from each of the methods be able to present different pattern of the CLOs attainment of the course.
Significance – From the students’ achievement perspective, it can be an indicator to identify which course’s CLO the students have failed to achieve. Meanwhile from the course assessment design perspective, it also can be an indicator to assess the consistency of various assessment tools in measuring all CLOs.
Keywords: Outcome Based Education (OBE), Course Learning Outcome (CLO),Assessment, Assessment Tools,
I. INTRODUCTION
Outcome Based Education (OBE) is an education system that is based on achievements orientation (or outcomes) and the objectives of OBE are to encourage an innovative teaching technique
Revised Manuscript Received on May 28, 2019.
Nurakmal Ahmad Mustaffa, School of Quantitative Sciences, College of Arts & Sciences, Universiti Utara Malaysia, Malaysia
Malina Zulkifliand, School of Quantitative Sciences, College of Arts & Sciences, Universiti Utara Malaysia, Malaysia
Rusdi @ Indra Zuhdi Murat, School of Quantitative Sciences, College of Arts & Sciences, Universiti Utara Malaysia, Malaysia
(i.e., more systematic and flexible) (Garrison & Vaughan, 2008) and emphasis on a continuous improvement of students’ performance (Alzubaidi et al., 2015).
In implementing OBE, it first requires a process of determining the skills that will be instilled for the students in a particular course. Then, teaching and learning plan is performed, which include designing teaching method that can help students to achieve a particular skill or known as Course Learning Outcome (CLO). CLOs attainments for a course are mesured by conducting assessments (Bareduan et al., 2012, Bourner, 2003) and the measurement on CLOs is required for an assurance of continual improvement in the course quality. If the CLOs of the course are to develop the capacity of reflective practice, then assessmentsare necessary for certification that CLOs have been achieved (Bareduan et al., 2012; Bourner, 2003). In OBE, a good learning system is the one that aligns the teaching methods and the assessment, so that CLOs can be achieved (Crespo et al., 2010; Biggs & Tang, 2007). This system can be called as ‘constructive alignment’. Using constructive alignment, the assessment and criteria should be explicit, transparent and made available to students before the evaluation take place (Crespo et al., 2010; Rust, 2002) by using appropriate assessment tools (Bagban et al., 2017; Sudheer et al., 2016; Mecwan et al., 2015; Alzubaidi et. al, 2015; Oster & Tiu, 2008).
Managing assessment for a course that involved many lecturers in a large class(i.e. the large class in this paper is defined as a class with more than 50 students) can be a burdensometask. Different teachers have different views on pedagogical beliefs and attitudes towards teaching and learning, hence verity of assessment methods and measurements could be proposed (Day & Hurrell, 2012). Meanwhile, thelarge class means there will be an expanding number of students in a class that often increase the complexity of the processes of teaching and assessment due to diversity of the student ability to achieve each CLO (Hornsby & Osman, 2014; Exeter et al., 2010).Lecturers involved in teaching the same course without being facilitated with a clear standard assessment tools can be misguided that leads to unconscious bias-judgement and unfairness in the process of assessing the students’ grade (Kible, 2017)
Measuring Course Learning Outcome for
Large Class of Introductory Statistics
Course
Nonetheless, to alleviate this issue, this paper describes a quantitative measurement framework in assessing students’ achievement for such classes. This framework can be a beneficial for respective parties from two perspectives. First, it can be an indicator to identify which course’s CLOs the students have failed to achieve. Second, it also can be an indicator to assess the consistency of various assessment tools in measuring all CLOs.
II. OBE-BASED ASSESSMENT
In OBE, the assessment and its criteria should be planned, explicit, transparent and made available to students before the evaluation take place (Bagban et al., 2017; Rust, 2002). Normally, assessment is conducted continuously, strating from the first week until last week of lecture (Mamat et al., 2014). Variety of assessment methods and tools are usually used based on the leaning outcome context and its complexity (Iannone & Simpson, 2015). This assessmentplan is really important for an academic programme quality control, where continuous quality improvment (CQI) is one of the criteria being evaluated by some of the agencies of education accreditationin some countries all over the world, such as in Malaysia, which often being overseen by the Malaysia Quality Agency (MQA, 2011). In OBE, a good assessmentis when the assessment has a product of reliability, validity, feasibility, cost effectiveness, acceptance and educational impact (Kible, 2017).
Assessment in OBE are usually classified as summative or formative assessments (Bagban et al., 2017; Dixson & Worrell, 2016; Oster & Tiu, 2008; Biggs & Tang, 2007; Waren, 2005). The main difference between these two assessments is on the purpose for conducting the assessment. A formative assessment or sometimes refer toas an assessment for learning, which anticipateformal and informal continuous assessment activities and it aims areto help students learn better,rather assessing students for better marks and toprovide constructive feedbacks (Anderson & Palm, 2017; Oster & Tiu, 2008). Examples of assessment tools used for summative assessment are quizes, individual assignment and group assignment (Oster & Tiu, 2008).In contrast, a summative assessment or also refer to as an assessment of learning is actually a process of evaluating students’ knowledge, understanding and skills about the course, using aggregated evidence to assess students’ achievement againts specific CLOs and may achieve some kind of accreditation. Forexample, agrade “A” is given to astudent if the total scores mark of a course is more than 81%. Examples of assessment tools used for summative assessment are mid-semester and final examinations and final report project (Oster & Tiu, 2008).
Nevertheless, in reality, it is quite difficult to identify anassessment aseither a purely summative or formative, because it often falls in between (Kible, 2017). For example, aquiz issometimes given a score as a part of grading process, eventhough the quiz is usually used for continual feedback for learners.Furthermore,to know the actual performance for each
CLO sometimescan be burdensome, tricky and ristrictedand until todaythere is no specific measurement for measuring CLO performance (Bagban et al., 2017; Ahmad et al., 2011). Therefore, researchers are conducting study on method that can quantitatively measure the performance of CLOs.
III. MEASURING COURSE LEARNING OUTCOME (CLO)
They have found out that these tools require a better system to deal with complexity of OBE system, which involve dealing with too many parameters such as different cohort of students and various courses.
IV. CONVENTION OF CLOS’ ASSESSMENT OF INTRODUCTORY STATISTICS
The study in this paper was conducted for Elementary Statistics course (later known as SQQS 1013). This is a level one servicecoursefor students from various undergraduate degree programs in Universiti Utara Malaysia (UUM) which was being offered by the School of Quantitative Sciences(SQS).This course has two aforementioned characteristics, taught by many lecturers and is a large class.The problem in implementing the structure of OBE-based assessment to this course are on the distribution of weights (percentage) for each assessment tool andthe assignment of baseline values for analysing students’ learning outcome performance. Although questions for each assessment toolwere prepared by lecturers through a series of discussion, but this practice lack of ‘constructive alignment’to support the OBE assessment-based approach.
The distribution of mark for this course is 50:50 of which 50% will come from course works (i.e. quizzes, group assignments and mid-semester examination) and another 50% is from the final exam. Currently, the weightage for each of CLO and each of assessment toolare only being assigned to the final examination questions, but not for questions in course works’ assessment tools. Of the50% scores in the course works’ assessment tools, only the proportion of percentage is allocated to each of assessment tool, for example quiz is 10%, group assignment is 20% and mid-semester exam is 20%.In this regard, questions in each of assessment tool of course works are not being aligned with CLOs in SQQS3013. Furthermore, there is no baseline value for each of CLO to analyse the students’ learning outcome performance. In such situation, to assign a cross section of weightage for each CLO in each of assessment toolwillrequire a standard procedurewhich is tedious and time consuming to develop(Alzubaidi, 2015; Ahmad et al., 2011; Keshavarz 2011). Therefore, this study aims to explore some suitable methods in assessing student’sachievement in a quantitative manner by comparing several methods from the previous studies.
V. METHODOLOGY
For better understanding, the description onCLOs and assessment tools for SQQS1013 are provided in this paper as follows. There are four CLOs covered in this course and each of the following CLO is used to access the students’ capability to:
CLO1: explain the basic concept of statistics and its application in real life.
CLO2: describe the data in hands whether in terms of presenting or measuring statistical value and its interpretation.
CLO3: solve problem in findings the probabilities for random variables.
CLO4: calculate the probability of sample statistic.
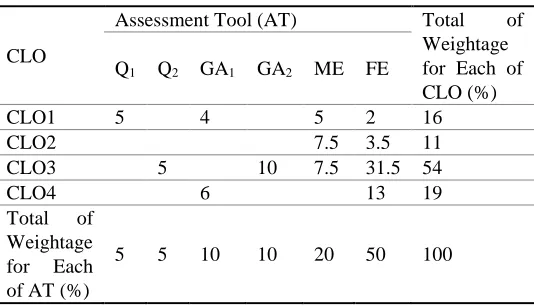
[image:3.612.310.577.265.418.2]Assessment tools used in semester A171 are Quizzes (later known as Qn where n=1,2), Group Assignments (later known as GAn where n=1,2), Mid-semester examination (later known as ME) and Final Examination (later known as FE).To illustrate the relationship between the assessment tools and the CLOs, the proportion of weightage assignedto each of CLO and assessment toolare tabulated in Table 1. Table 1shows that the students have been assessed more on CLO3, where there are more than 50% of marks have been allocated for this CLO, as compared to other CLOs.The reason of assigning the weightage in this way is because half of the topics in SQQS1013 cover the concept of probabilities.
Table. 1 The Proportion of Weightage (%) for Each of CLO and Assessment Tool
CLO
Assessment Tool (AT) Total of
Weightage for Each of CLO (%) Q1 Q2 GA1 GA2 ME FE
CLO1 5 4 5 2 16
CLO2 7.5 3.5 11
CLO3 5 10 7.5 31.5 54
CLO4 6 13 19
Total of Weightage for Each of AT (%)
5 5 10 10 20 50 100
Note:Qn where n = 1,2 = Quiz; GAn where n = 1,2 = Group Assignment; ME = Mid-Semester Exam; FE = Final Examination
Data used were from students’ score who took this course in semester A171. There were 25 groups altogether and two groups of 110 students was selected for a primary analysis. The students’ achievement is assessed by using several computation methods. This preliminary study uses methods proposed by Sudheer et al. (2016), Alzubaidi et. al (2015) and Koh and Chong (2015), which has mathematical modelling in nature. They assessed the student’s achievement based on the CLOs’ score computed from several methods, which are using
average, threshold and performance vector
VI. PROCEDURE
First, students’ marksfor all assessment toolswere collected from the respective lecturers. Secondly, the markswere mapped with respect to their assessment toolsand the CLOs, where the map is now translated into a linkage matrix(Keshavarz, 2011). Forexample, Table 2 depicts the scores of three students in a linkage matrix table.Thirdly, CLOs’ score were calculated using three different methods, which are average, threshold and performance vector methods. According to Alzubaidi et. al (2015), each of the method has
its own weaknesses in representing the CLOs
[image:4.612.44.299.269.526.2]attainments.Nonetheless, instead of relying on one approach, having a combination of these three methods may provide betterment guidance (Alzubaidi et. al, 2015) and reference for the report of Course Performance Report.
Table . 2 Marks of Three Students in a Linkage Matrix Table
St u de nt
Students’ Score for each of AT and CLO (%)
ME Q
1 Q 2
GA1 G
A 2 FE C L O 1 C L O 2 C L O 3 C L O 1 C L O 3 C L O 1 C L O 4 C L O 3 C L O 1 C L O 2 C L O 3 C L O 4
1 3
. 0 0 4. 0 0 3. 5 0 5. 0 0 5. 0 0 4. 0 0 6. 0 0 9. 3 4 0. 3 3 3. 5 0 2 1. 5 0 1 1. 5 0
2 2
. 0 0 1. 5 0 1. 0 0 5. 0 0 5. 0 0 4. 0 0 6. 0 0 1 0. 0 0 0. 3 3 3. 1 5 8. 5 0 0. 0 0
3 3
. 0 0 3. 5 0 2. 0 0 5. 0 0 5. 0 0 4. 0 0 6. 0 0 7. 5 0 0. 3 3 3. 5 0 2 3. 5 0 2. 5 0
The description on the proposed methods is as follows:
Average method
In the average method, to measure the achievement of the particular CLO, a success criterion value as a baseline score for each CLO is set up. Then,theCLO’ score is calculated, which refers tothe average of students’ markfor each of CLO and each of assessment tool. After that, the score for each of CLO is cross-examined with the baseline score to check the CLO’s scoreis either exceedsor below the given success criteria. This study used a score of 50% as a baseline value, which consistent with the passing mark used in several accreditations obtained by UUM, such as the ACCSB accreditation.
Threshold method
Using threshold method, similar to the average method, a
success criterion value as a thresholdvalue for CLOs is set up and the study used the same success criteria as in the average method, which is 50% score as a threshold value. To calculate the CLOs’ score, firstly, number of students succeed to score the exceed value of 50%is counted for each of CLO. Then, for each of CLO, the proportion of total number of succeed students and the number of assessment tools is computed to find the CLO’s score.
Performance vector method
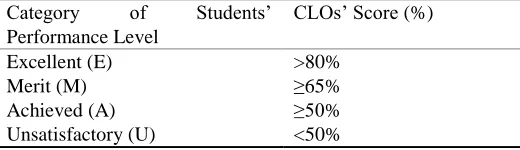
[image:4.612.310.570.335.410.2]In the performance vector method, a set of success criteria is set upby using a students’ performance level category that related to the aggregate score of the CLO. The calculation of the CLOs’ score based on this method is quite similar to the threshold approach, except it counts the number of students succeed to score the exceed value of the given aggregated scores for each of the CLO. In this study, four performance level categories are identified as the success criteria and their CLO’s score for each category is tabulated inTable 3.Like the average and threshold methods, the score more than or equal to 50% is used as a value that exceed the success criterion, which is fall into the category of Achieved and above.
Table. 3 Students’ Performance Level Category
Category of Students’
Performance Level
CLOs’ Score (%)
Excellent (E) >80%
Merit (M) ≥65%
Achieved (A) ≥50%
Unsatisfactory (U) <50%
After the process of calculating the CLOs’
scoresarecompleted using the aforementioned methods, the results are grouped and reported in the Course Performance Report for CLOs attainment analysis.Themethods can provide three important observations. First, it anticipates a baseline value that should be allocated for each of CLO to indicate the achievement of the CLOs. Secondly, it indicates which CLOs the students have succeed or failed to achieve. Finally, it can also indicate the consistency of assessment tools used to assess the CLOs, which it can further provide an insight into the consistency of selecting appropriate assessment tools in measuring a particular CLO.
V. RESULTS
The outcome of scores of CLOs based on the threshold method is tabulated in Table 5. From Table 5, based on 50% threshold value as a success criterion, students achieved all CLOs and again CLO2 is a highest achiever with a score of 85.45%, followed by CLO1, CLO3 and CLO4 with scores 70.00%, 68.00% and 65.00%, respectively.
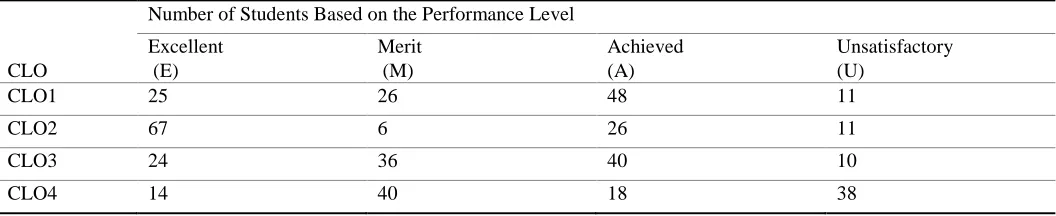
Table 6 displays the outcome of analysis of the performance
[image:5.612.86.524.153.251.2]vector method. The results show that students achieved all CLOs where again CLO2 is the highest achiever with more than half of the students are Excellent. But, the number of students who are fall into the category of Unsatisfactory in CLO4 is quite high, which are 38 students as compared to the other CLOs with Unsatisfactory students, which are only 10 to 11 students who are fall into this category.
Table. 4 Achievement of CLOs based on the Average Method
CLO
Average of Students’ Mark Average
of ATs’ Score
CLO Score (%)
ME Q1 Q2 GA1 GA2 FE
CLO1 6.818 10.000 6.664 4.136 6.905 69.04
CLO2 6.436 9.146 7.791 77.91
CLO3 3.564 8.855 8.725 5.912 6.764 67.64
[image:5.612.82.519.288.395.2]CLO4 7.855 3.273 5.564 55.64
Table. 5 Achievement of CLOs based on the Threshold Method
CLO
Number of Students Who Have Exceed the Threshold Value of 50%
Average of ATs’ Score
CLO Score (%)
ME Q1 Q2 GA1 GA2 FE
CLO1 90 110 54 54 0.7000 70.00
CLO2 83 105 0.8545 85.45
CLO3 22 101 110 66 0.6800 68.00
[image:5.612.43.571.432.540.2]CLO4 109 34 0.6500 65.00
Table. 6 Achievement of CLOs based on the Vector Performance Method
CLO
Number of Students Based on the Performance Level
Excellent (E)
Merit (M)
Achieved (A)
Unsatisfactory (U)
CLO1 25 26 48 11
CLO2 67 6 26 11
CLO3 24 36 40 10
CLO4 14 40 18 38
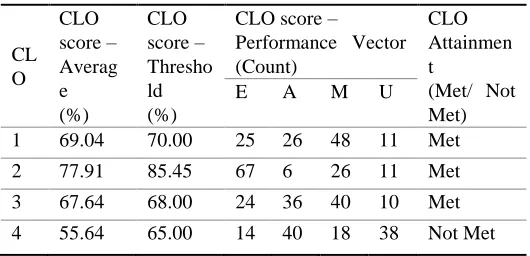
All CLOs’ score from the three methods are combined in one table as a Course Performance Report, as depicted in Table 7. From Table 7, decisions on the CLOs attainments are made by referring to the column CLO Attainment (Met/Not Met)where there is a process of cross-examining columns
CLO score-Average,CLO score-Threshold and CLO
score-Performance Vector. If the CLO scores are more than 50% for
CLO score-Average and CLO score-Threshold and if more
than or equal to 80% of students who scored above the Achievedaggregate, then, the CLOs are consider have succeed to achieve.Referring to column CLO Attainment (Met/Not Met), results show all CLOs attainments are met, except CLO4.This finding reflects the capability of the students to achieve three of the four CLOs.To leverage this Course Performance Report and ensuring the course quality
improvement, the next teaching team are not required to make major amendment on the current CLOs’ weightages and assessment tools since three fourth of CLOs attainments are met.
Nevertheless, some improvement for CLO4 is
majority of students were unable to differentiate between the sampling distribution and the normal distribution where the students have a difficulty to identify the sample size, which are needed as an of input value in order for them to calculate the probability of sampling.Hence, teaching style and assessment method for this topic need to be improved.
Table. 7 Course Performance Report
CL O
CLO score – Averag e (%)
CLO score – Thresho ld (%)
CLO score –
Performance Vector (Count)
CLO Attainmen t
(Met/ Not Met)
E A M U
1 69.04 70.00 25 26 48 11 Met
2 77.91 85.45 67 6 26 11 Met
3 67.64 68.00 24 36 40 10 Met
4 55.64 65.00 14 40 18 38 Not Met
From the findings, the study is in agreement with Alzubaidi et. al (2015) from two-fold. First, the average and threshold methods be able to suggest a baseline value in assessing the CLOs attainments. Secondly, the methods are also be able to indicate the achievement of the CLOs by cross-examining the CLOs’ scores from those three methods. The average and threshold methods may good to be used to analyze the performance of the course and the performance vector method suitable to present the performance of one class of the course. The performance vector method has a capability to detail out the students’ score and the CLOs attainment. But, the idea of examining the consistency of the assessment tools usage is missing since they are not considered during the processes of calculating the CLOs’ score in the performance vector method and identifying the CLOs attainments in the Course Performance Report. It is possible to examine the consistency of the assessment tools usage by including the assessment tools components in both aforementioned processes.
From a statistics perspective, there are several limitations in implementing these methods. First, there is a missing step in the proposed approach where the researchers skipped the step of analysing and identifying the property of the data. Common practice in statistics when dealing with data is to examine the distribution of the data from the aspects of its central tendency, variationand shape of the distribution of the data. This actually is the first step to be takenwhen dealing with a data.Failure in identifying the distribution of data will lead to a wrong choice of statistics measurement.Secondly, to use the three methods can be quite complicated because it requiresa cross-examined process for all proposed methods in analysing theCLOsattainments. As mentioned by Alzubaidi et al. (2015), the three methods are proposed to cater the strengths and weaknesses of those methods. Nevertheless, since the authors is failed to analyse and identify the distribution of the data, it has led them to suggest more than one method to overcome the issue of weaknesses in the proposed methods.
VI. CONCLUSION
In a nutshell,a course assessment can be considered as a very important criterion to determine the achievement of the students to grasp the process ofteaching and learning in the classroom. In order to ensure the effectiveness of the design assessment, there are several aspects that should be adrressed carefully and one of the most important aspects is examining the CLOs attainments. Findings in this study suggest that while the proposed combination approach is able to reflect the students achievement via the computation of CLOs’ score, the proposed approach has a drawback from a statistics persepective. The main issue that need to be addressed and solved is the process of identifying the property of students’ marks distribution. This is crucial to ensure that the measurement proposedto calculate the CLOs’ score is appropriate and suitable to the students’ marks distribution. As a matter of fact, the proposed combination approach is rather complicated and requires longer period in assessing the CLOs’ score. Therefore, there is a need to propose methods which are more robust in dealing with the distribution of students’ marks and complexitiy of the computation approach.
VII. ACKNOWLEDGMENT
The authors would like to thank the Universiti Utara Malaysia (UUM) for funding this studythrough theUniversity Grant Scheme S/O Code 13780 and all SQQS 1013 lecturers for supportive comments.
REFERENCES
1. Ahmad, K., Ali, N. M., & Zainudin, S. (2011). An improved course assessment measurement for analyzing learning outcomes performance using Rasch model. Procedia-Social and Behavioral Sciences, 18, 442-449.Doi:10.1016/j.sbspro.2011.05.065
2. Alzubaidi, L. (2016). Measurement of course learning outcomes for data structure using the combination approach. International Journal of Computer Science and Network Security (IJCSNS), 16(1), 57-61.
3. Alzubaidi, L., Jabur, I.,& Alzubaidi, R. (2015). Course assessment tool using the combination approach, In Proceedings of the World Congress on Engineering and Computer Science 2015 Vol I WCECS 2015, October 21-23, 2015, San Francisco, USA.
4. Andersson, C., & Palm, T. (2017). The impact of formative assessment on student achievement: a study of the effects of changes to classroom practice after a comprehensive professional development programme. Learning and Instruction, 49, 92-102.Doi:10.1016/j.learninstruc.2016.12.006.
5. Bagban, T. I., Patil, S. R., Gat, A., & Shirgave, S. K. (2017). On selection of assessment methods in outcome based education (OBE). Journal of Engineering Education Transformations, 30(3), 327-332.
6. Bareduan, S. A., Baba, I., Ali, Z. M., & Ponniran, A. (2012). Continuous quality improvement process using constructive alignment. Journal of Technical Education and Training, 4(1).
8. Biney, P., Kommalapati, R., Gyamerah, M., Annamalai, A., Obiomon, P., Ketkar, M., Sarker, N., Iyengar, R., & Peng. X. (2008). Development of performance criteria for assessing program outcomes in engineering, engineering technology and computer science programs. Proceedings of the American Society of Engineering Education Annual Conference & Exposition, Pittsburgh, PA.Doi: 10.1145/1134285.2234500
9. Bourner, T. (2003). Assessing reflective learning. Education+ Training, 45(5), 267-272.https://doi.org/10.1108/00400910310484321 10. Crespo, R. M., Najjar, J., Derntl, M., Leony, D., Neumann, S.,
Oberhuemer, P., Totschnig, M., Simon, B., Gutierrez, I.& Kloos, C. D. (2010). Aligning assessment with learning outcomes in outcome-based education. IEE Education Engineering 2010, Madrid Spain, 1239-1246.Doi:10.1109/EDUCON.2010.5492385
11. Day, L. & Hurrell, D. (2012). A teaching team: More than the sum of its parts. In creating an inclusive learning environment: Engagement, equity, and retention. InProceedings of the 21st Annual Teaching Learning Forum, 2-3 February 2012. Perth: Murdoch University.
12. Exeter, D. J., Ameratunga, S., Ratima, M., Morton, S., Dickson, M., Hsu, D., & Jackson, R. (2010). Student engagement in very large classes: the teachers’ perspective. Studies in Higher Education, 35(7), 761-775.Doi:10.1080/03075070903545058
13. Fallon, M., Zhang, J., & Kim, E. J. (2011). Using course assessments to train teachers in functional behavior assessment and behavioral intervention plan techniques. The Journal of International Association of Special Education. 12(1), 50-58.
14. Garrison, D. R., & Vaughan, N. D. (2008). Blended learning in higher education: Framework, principles, and guidelines. John Wiley & Sons. 15. Hornsby, D. J., & Osman, R. (2014). Massification in higher education:
Large classes and student learning. Higher Education, 67(6), 711-719.
16. Kaliannan, M., Chandran, S.D. (2012). Empowering students through outcome-based education (OBE). Research in Education. 87 (1), 50– 63.Doi:10.7227/RIE.87.1.4
17. Keshavarz, M. (2011). Measuring course learning outcomes. Journal of Learning Design, 4(4), 1-9.
18. Kibble, J. D. (2017). Best practices in summative assessment. Advances in physiology education, 41(1), 110-119.
19. Koh, Y. Y., & Chong, P. L. (2015). From Outcome-Based Education (OBE) toContinual Quality Improvement (CQI): A Case Study of Teaching Mechanical Engineering at University of Newcastle, Singapore.
In Proceedings of 15th South East Asian Association for Institutional
Research (SEAAIR) Conference, Hanoi, Vietnam, 30 Sept – 2 Oct 2015. 20. Malaysian Qualification Agency (MQA) (2011). Malaysia Qualifications
Framework 2, Retreived from http://www.mqa.gov.my/portalMQA/dokumen/MALAYSIAN%20 QUALIFICATIONS%20FRAMEWORK_2011.pdf on 14 September 2017.
21. Mecwan, A. I., Shah, D. G., & Fataniya, B. D. (2015). Innovations in evaluation: An integral part of outcome based education. In 5th Nirma University International Conference onEngineering (NUiCONE), 26 November 2015,(pp. 1-5). IEEE.
22. Mohamad, S., Tukiran, Z., Mohd Hanifa, R., Ahmad, A., & Md Som, M. (2013). An evaluation of assessment tools in outcome-based education: A way forward.Journal of Education and Vocational Research, 3 (11), 336-343.
23. Mohayidin, M. G., Suandi, T., Mustapha, G., Konting, M. M., Kamaruddin, N., Man, N. A., & Abdullah, S. N. (2008). Implementation of outcome-based education in Universiti Putra Malaysia: a focus on students’ learning outcomes. International Education Studies, 1(4), 147-160.
24. Mokhtar, S. A., Puteh, S., & Anuar, S. M. S. (2014). OBE measurement system in Malaysian Institute of Information Technology Universiti Kuala Lumpur. In 5th International Conference on Intelligent Systems, Modelling and Simulation (ISMS), 2014 (pp. 12-17). IEEE.
25. Osters, S., & Tiu, F. S. (2008). Writing measurable learning outcomes. In 3rd AnnualTexas A&M Assessment Conference.
26. Rust, C. (2002). The impact of assessment on student learning: How can the research literature practically help to inform the development of departmental assessment strategies and learner-centered assessment practices? Active Learning in Higher Education, 3, 145-158.
27. Sudheer, K., Sujit, V. V. N., Prasad, N. V. G., & Ravichand, K. (2016). A novel method of learning outcome assessment in outcome based
education. In 4th International Conference IEEE on MOOCs, Innovation and Technology in Education (MITE), 9 December 2016 (pp. 328-331). IEEE.