The applicability of low-cost PM10 sensors
for atmospheric air quality monitoring
Bartosz Szulczyński1, and Jacek Gębicki1, *
1Gdańsk University of Technology,Department of Chemical and Process Engineering, Faculty of Chemistry, 11/12 G. Narutowicza St., 80-233 Gdańsk, Poland
Abstract. Described in this work are the results of field tests carried out in the Tricity Agglomeration between 01 April 2018 and 30 June 2018 in order to evaluate the usefulness of low-cost PM10 sensors in atmospheric air quality monitoring. The results were juxtaposed with the results obtained using reference methods. The results were validated based on the measurement uncertainty as described in the EU report "Demonstration of Equivalence of Ambient Air Monitoring Methods. EC Working Group on Guidance for the Demonstration of Equivalence". Moreover, the impact of external factors (humidity, pressure, temperature) on the obtained results was also assessed. It was shown that the low-cost sensors display measurement uncertainty which exceeds the acceptable values as compared to the reference methods and correction factors depending on the measured PM10 concentration need to be introduced in order to fulfil the criteria of equivalence.
1 Introduction
The PM10 suspended particulate matter in the atmospheric air can originate from both natural and anthropogenic sources, and has a well-documented negative effect on the human health. It is also linked with the occurrence of finer particulate matter which can penetrate into the gas exchange area (alveoli) of lungs. When inhaled, it causes symptoms depending on the concentration, exposure to environmental factors and its duration, and also to individual susceptibility [1-4]. The anthropogenic activity has a significant impact on the emission of particulate matter into the environment. Economic activity and operation of industrial plants leads mainly to the organised emission of pollutants, while in the residential areas the main source of atmospheric pollution is the low emission from the municipal and housing sector and line emission from mobile sources. In particular, the combustion of fossil fuels and using an outdated residential heating infrastructure leads to the emission of the products of incomplete combustion. Moreover, intensive road traffic in large urban agglomerations can result in linear areas of increased particulate emission which, together with the area emission from the residential areas, negatively impacts the air quality in a given area. For this reason, it is important to conduct constant or periodic monitoring of the atmospheric air quality in regard to particulate matter PM10 [5, 6].
According to EN12341 gravimetric analysis is the reference method in the monitoring of the concentration of PM10 particulate matter. The result of the measurement using this method is PM concentration averaged over a period of 24 hours and are not readily available, as the filter with the captured PM10 needs to be stabilised at a given temperature and humidity as outlined in the norm. However, there is also the need for on-line measurements of PM concentration averaged over shorter periods of time, e.g. 1 hour. For this reason other techniques are also used for air quality monitoring in regard to PM10 concentration, provided these methods, usually automatic, provided they have been shown to be equivalent to the reference method according to Directive 2008/50/EC of the European Parliament and of the Council of 21 May 2008 on ambient air quality and cleaner air for Europe [7, 8].
The commercially available laser sensors (particle counters) for measuring particulate matter PM10 are characterised by different metrological parameters, physical dimensions, and price range, leading the potential buyers to pay lesser attention to the quality of the results and whether these results are equivalent to those obtained using the reference method. In order to determine whether a given PM10 sensor can be used to produce reliable results, it
has to be tested in field conditions “side by side” the reference method.
In this article described are the results of field tests of two commercially available PM10 sensors. The measurement uncertainty was determined based on the EU report "Demonstration of Equivalence of Ambient Air Monitoring Methods. EC Working Group on Guidance for the Demonstration of Equivalence". The assessment of the impact of meteorological parameters such as temperature, atmospheric pressure and humidity on the obtained results was also attempted [9].
2 Experimental
2.1 Field tests
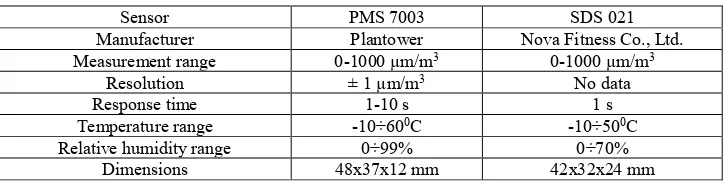
[image:2.482.61.425.420.512.2]The parameters of the two tested commercially available PM10 sensors are listed in Table 1.
Table 1. Parameters of the PM10 sensors used during the investigation.
Sensor PMS 7003 SDS 021
Manufacturer Plantower Nova Fitness Co., Ltd.
Measurement range 0-1000 µm/m3 0-1000 µm/m3
Resolution ± 1 µm/m3 No data
Response time 1-10 s 1 s
Temperature range -10÷600C -10÷500C
Relative humidity range 0÷99% 0÷70%
Dimensions 48x37x12 mm 42x32x24 mm
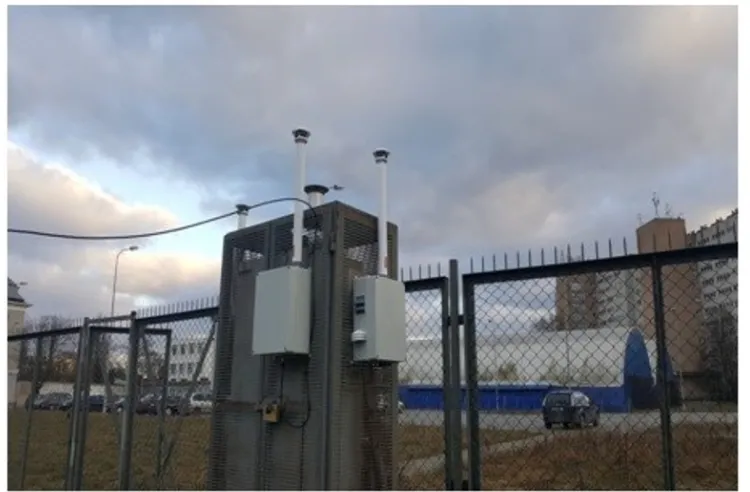
The sensors were installed in a reference station in Gdańsk, Poland in order to conduct a field
Fig. 1. PM10 sensors (white box) mounted on the protective case of the reference station located in Gdańsk, Poland.
2.2 Assessment of the measurement quality of the PM10 sensors
The following criteria are used to validate the results obtained using non-reference methods (in this case PM10 sensors) as equivalent to the results obtained using the reference method in a field test:
− Expanded relative uncertainty U for parallel measurements lower than 25% (comparison of parallel measurements using orthogonal regression),
− The slope of the linear function ‘b’ does not differ significantly from 1, and the y
-intercept ‘a’ does not differ significantly from 0.
If the above criteria are not fulfilled, the correction factor or correction equation is estimated instead. If that is not successful (expanded relative uncertainty remains higher than 25%), the reference method is discarded and its results are determined to be non-equivalent to the results obtained using the reference method.
A detailed description of the assessment of the measurement uncertainty and the criteria for validating the results of measurements using reference methods can be found in the non-normative guide "Demonstration of Equivalence of Ambient Air Monitoring Methods. EC Working Group on Guidance for the Demonstration of Equivalence" or in other works [10, 11].
3 Results
sensors, respectively. The estimated measurement uncertainties of both sensors vs. the reference method are listed in Table 2. Based on the experimental data it can be observed that the measurement uncertainty was 75% in the case of the Plantower PMS 7003 sensor, and 85% in the case of the Nova Fitness SDS 021 sensor. The introduction of corrections of the
[image:4.482.65.418.159.360.2]sensors’ response signals resulted in the reduction of measurement uncertainty to 45% and 52%, respectively. In both cases, the criterion of 25% measurement uncertainty vs. the reference method was not fulfilled.
Fig. 2. The course of PM10 dust concentration variability measured during the measurement period using the reference method and Plantower PMS 7003 sensor.
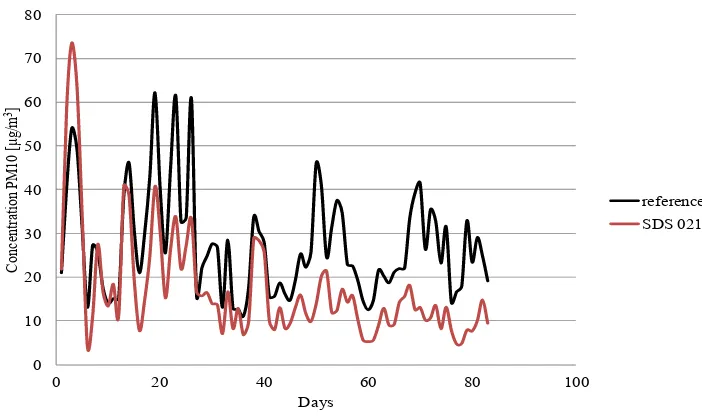
Fig. 3. The course of PM10 dust concentration variability measured during the measurement period using the reference method and Nova Fitness SDS 021 sensor.
0 10 20 30 40 50 60 70 80
0 20 40 60 80 100
C onc ent ra tion PM 10 [ μ g/ m 3] Days reference PMS 7003 0 10 20 30 40 50 60 70 80
0 20 40 60 80 100
[image:4.482.67.418.394.602.2]Table 2. Estimated measurement uncertainty for PMS 7003 and SDS 021 sensors versus results obtained using the reference method.
Parameters PMS 7003 SDS 021
Extended relative uncertainty 75% 85%
Extended relative uncertainty (signal correction) 45% 52%
Extended relative uncertainty
(correction of atmospheric parameters) 70% 79%
Extended relative uncertainty
(correction of atmospheric parameters + signal correction) 40% 48% Extended relative uncertainty
(correction of atmospheric parameters + corrective coefficients
dependent on the level of PM10 dust concentration measured) 20% 23%
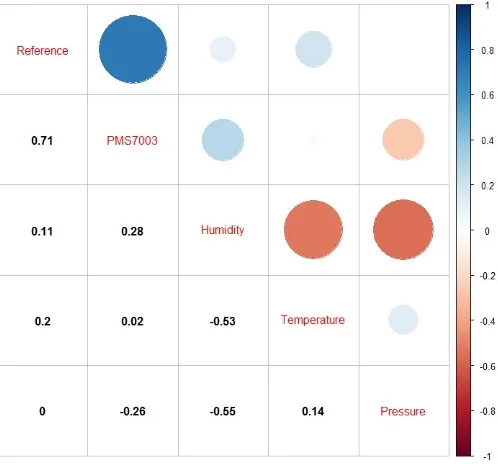
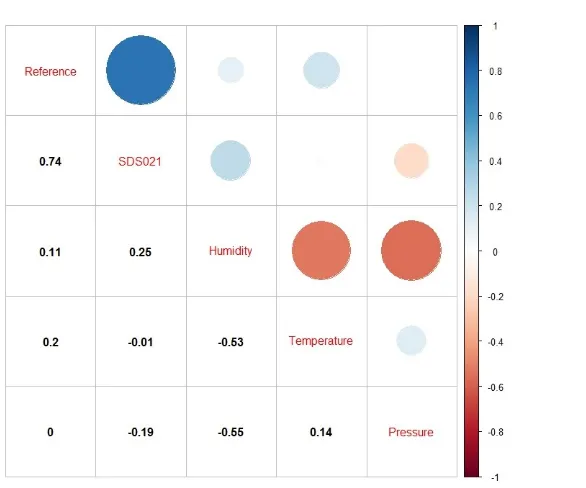
Matrices of linear correlation of the parameters registered during the operation of the instruments shown in Fig. 4. and Fig. 5. were compiled in order to assess the impact of atmospheric conditions on the measurement error. Based on the analysis of the results it can be concluded that the sensors’ response signals are dependent on such factors as air humidity
and atmospheric pressure in the vicinity of the sensor (correlation coefficients r = 0.28; 0.25 and r = -0.26; -0.19 respectively). The relatively high correlation coefficients suggest the possibility to introduce additional measurement corrections according to equation (1):
𝑘 =𝜑0
𝜑 ×
𝑝
𝑝0 (1)
where: k - measuring correction, φ0– reference relative humidity of 50%, φ– relative humidity during the measurement, p0– reference atmospheric pressure of 101325 Pa, p – atmospheric pressure during the measurement.
[image:5.482.142.391.366.598.2]Fig. 5. Linear correlation coefficients of atmospheric parameters depending on the SDS 021 sensor operation.
Listed in Table 2. are the estimated measurement uncertainty values vs. the results obtained using the reference method for both sensors after correcting for the atmospheric parameters. In this instance, the measurement uncertainties were 70 % and 79% for the Plantower PMS 7003 and Nova Fitness SDS 021 sensors, respectively. The implementation of signal corrections and taking into consideration the atmospheric conditions has led to measurement uncertainties of 40% and 48%, respectively. Also in this instance, the criterion of 25% measurement uncertainty vs. the reference method was not fulfilled.
Finally, an attempt was made to apply corrections based on the measured PM10 concentration. To this end, linear correlation coefficients and correction coefficients were prepared separately for three discrete PM10 concentration ranges: 0-20 µm/m3(correlation coefficient r = 0.88, correction coefficient 1.22 for Plantower PMS 7003, and r = 0.82 and correction coefficient 1.28 for Nova Fitness SDS 021), 21-40 µm/m3 (r = 0.91, correction coefficient 1.15 and r = 0.87, correction coefficient 1.18, respectively), and>40 µm/m3 (r = 0.82, correlation coefficient 1.25 and r = 0.79, correlation coefficient 1.29, respectively). The estimated measurement uncertainties vs. the reference method for both sensors after correcting for atmospheric conditions and PM10 concentration are listed in Table 2. After these corrections, the measurement uncertainty was 20% in the case of the Plantower PMS 7003 sensor, and 23% in the case of the Nova Fitness SDS 021 sensor. In both cases, the criterion of 25% measurement uncertainty vs. the reference method was fulfilled.
4 Summary
Equivalence" without introducing additional correction coefficients. The introduction of correction for atmospheric conditions and, more significantly, for the measured PM10 particulate matter concentration has produced results of measurements using the low-cost sensors with acceptable measurement uncertainty vs. the reference method, i.e. less than 25%. This highlights the issues with commonly available and relatively inexpensive PM10 sensors with metrological characteristics insufficient to satisfy the existing needs. Particular care should be taken when choosing this type of measurement devices for the monitoring of
atmospheric air quality and use the results of measurements “side by side” the reference
method in order to assess the applicability of these sensors.
The research was funded through the project “e-Pionier – supporting talented programmers in order to solve identified social or economic problems” realised by Excento Sp. z o.o. Project number: WG-POPC.03.03.00-00-0008/16-00.
References
1. M. Viana, X. Querol, A. Alastuey, F. Ballester, S. Liop, A. Esplugues, R. Fernandez-Patier, S. Garcia dos Santos, M.D. Herce, Atmos. Environ. 42, 1552-1568 (2008) 2. T. Schiliro, L. Alessandria, R. Degan, D. Traversi, G. Gilli, Environ. Toxicol. Phar.
29, 150- 157 (2010)
3. A. Zwoździak, M.I. Gini, L. Samek, W. Rogula-Kozłowska, I. Sówka, K. Eleftheriadis, J. Aerosol. Sci. 103, 38-52 (2017)
4. J. Rovira, J. Sierra, M. Nadal, M. Schuhmacher, J.L. Domingo, Environ. Res. 165, 201-209 (2018)
5. N. Sahanavin, T. Prueksasit, K. Tantrakarnapa, J. Environ. Sci. 69, 105-114 (2018) 6. A. Zwoździak, I. Sówka, E. Willak-Janc, J. Zwoździak, K. Kwiecińska, W.
Balińska-Miskiewicz, Environ. Sci. Pollut. Res. 23, 23892-23901 (2016)
7. M. Viana, X. Querol, A. Alastuey, G. Gangoiti, M. Menendez, Atmos. Environ. 37, 2879–2891 (2003)
8. D.C. Green, G.W. Fuller, T. Baker, Atmos. Environ. 43, 2132-2141 (2009)
9. Report by an EC Working Group on Guidance for the Demonstration of Equivalence (2010)