Abstract: Social media is a combination of different platforms where a huge amount of user-generated data is collected. People from various parts of the country express their opinions, reviews, feedback and marketing strategies through social media such as Twitter, Facebook, Instagram, and YouTube. It is vital to explore, gather data, analyze them and consolidate the people views for better decision making. Sentiment analysis is a natural language processing for information extraction that identifies the user’s views. It is used for extracting reviews and opinions about the satisfaction of products, the events, and people for understanding the current trends of product or user’s behavior. The paper reviews and analyses the existing general approaches and algorithms for sentiment analysis. The proposed system selected to perform sentiment analysis on Twitter data set is Long Short Term Memory [LSTM] and evaluated with Naive Bayes Approach.
Keywords— Map-Reduce, Sentiment Analysis, Big Data, Social Data, LSTM, Naive Bayes, Twitter
I. INTRODUCTION
A. Social Media Data
Social networks have rapidly changed the way information is being delivered to the customers, shifting from a traditional method of one-to-many to the modern method of one to one customer. Social Media are interactive applications that are computer arbitrated. These technologies expedite the design, modeling, and sharing of information, pictures, ideas, and other different forms of expressions through virtual groups and networks. Popular reference book publisher Merriam- Webster defines social media as “forms of transmission (such as websites for social networking and small blogging) through those users produce online communities to share info, ideas, personal messages, and other content (such as videos)”. It is one of the most popular ways of sharing information, ideology, thoughts, opinions, feelings, etc. Social media includes raw data such as shares, comments, impressions, emoticons or emoji, likes, etc., from which processed information can be gathered which can be of potential use. This gathered information using social media platforms like Tumblr, Twitter, Instagram, Facebook,
Revised Manuscript Received on September 22, 2019.
Gunjal P Jain, B.tech Student, Department of CSE, SRM Institute of Science and Technology, Chennai, TamilNadu,
Prof. Dr S Thenmalar, Assistant Professor, Department of CSE Department of CSE , Assistant Professor, Department of CSE,SRM Institute of Science and Technology Chennai, TamilNadu, [email protected]
Pinterest, and Reddit may belong to different fields like Fashion Importance, Globally recognized material, Style blogging, and Social media research. This information can be further used for decision making, opinion mining, news alert distribution, etc. Social media cannot always be considered a distraction that is harmful; it has also got its benefits. The mighty challenge is to operate on the social data which are in unstructured or semi- structured form. Although large information is shaken by all kinds of resources, it is estimated that most of them come from structured sources. They may assume that social media are perhaps the most important supplies of unstructured resources for information. Interest parties, tweets, thoughts, comments, bookmarks, and users all use on any social media platform are collected and analyzed by stakeholders. In the digital age, social media are very important for any business. It’s important to stay on Facebook and Twitter, giving individuals the ability to operate at a corporation level that contributes to making business on many fronts. Detailed information analysis helps organizations use their information and use new features. This, in turn, ends with clever business steps, other business transactions, higher profits, and more happy customers.
B. Sentiment Analysis
The purpose of sentiment analysis is to identify the real feelings or feelings of the speaker (here tweeter) or a writer in relation to the conversation or general frame content polarity. The angle may be his judgment or her analysis, the emotional state (the writer’s emotional state when writing) or the programmed emotional communication. In a simpler sense of sentiment analysis is referred as bias text polarization is positive, negative or neutral, also known as mining, because the user is of the opinion that the views of the user analysis and the feeling to differ, resulting in many users to understand other user perspectives and change thoughts. It plays an important role in analyzing product feedback from different customers as to whether the product is good or bad. The simple task of the analysis is to categorize the emotions contained in the text: the expression is neutral, negative or positive. “Beyond polarity” is the emergence of mood ranking, for example in emotional states such as “angry”, “sad” and “happy”.
Sentiment on Twitter Data Set using Recurrent
Neural Network - Long Short Term Memory
The polarity sensitivity of tweets has become an important preparatory exercise in the science of language process and data science. This can be the simple task that it is easy to understand, and the intelligent results are very simple (Eg: computation of positive and negative words). Its practical implementation is extensive, with the following popular events (such as talks, President, Oscar, etc.) and Remove Trademarks by controlling tweets in government
companies. Sentiment analysis systems enable companies to understand actionable insights of employees, their thoughts in terms of environment and emotional feedback going in the company.
These feedback in the form of survey helps company members to make teams more efficient. Some of the benefits of sentiment analysis include Scalability which refers to sentiment analysis enables efficient and cost-effective processing of data. Real-Time Analysis were usage sentiment analysis to identify accurate information that will give you real-time information about certain situations. A sentiment analysis system can help you instantly identify such situations and act. Relevant Criteria, the subjective matter that influences greatly on personal experiences, thoughts, and beliefs. Using a sentiment analysis system, companies can apply the same criteria for all their data. This helps to reduce errors and improve the clarity of data.
The proposed system focuses on generating the most accurate polarity of the given text as possible so that it can be used in different fields. The emotion recognized in this result helps in the further prediction of the user’s behavior, nature and psychological stability.
The system uses Recurrent Neural Networks –Long Short Term Memory approach to perform sentiment analysis. The dataset is divided into training dataset which includes attributes: userid, sentiment, and tweet. This dataset is trained on the algorithm and the model is then applied to the testing dataset. The algorithm consists of basic steps such as cleaning and preprocessing, splitting data, algorithm application, testing.
II. RELATED WORK
Twitter is majorly and text and media blogging website that is immensely popular amongst all social media applications. Sentiment analysis of this user-generated data is very useful in knowing the opinion of the crowd [1]. By playacting sentiment analysis during a specific domain, it is possible to identify the effect of domain information in sentiment classification. They have proposed a new feature vector for classifying the collected tweets as positive, negative or neutral and extract people’s opinion about products [2].
Before applying sentiment analysis to text various pre- process method was used to clean the text in order to remove noise in the form of slangs, unwanted words. Hadoop map- reduce [12-14] is one of the ways of pre-processing text. The process of map reduce involves mapping the input data, shuffling and sorting the mapped data and final step is to reduce the data and store in HDFS.
Existing research papers are available that use SVM [1,9-10] (Support Vector Machines), Decision Trees [11], Naive Bayes classifier [7-9], Recommending systems such as collaborative filtering [12-13] which are all parts of supervised learning under machine learning approach. There are two main algorithms used among a lexicon primarily based approach: Corpus [4] based approach and Dictionary [5] based approach. Machine Learning [7-11] is one of the most popular approaches used because of its flexibility and correctness. It consists of three major steps: Data gathering, cleaning the data (Pre-Processing), the training set and categorizing/ arranging the result.
The key to the accuracy of a classifier in machine learning is the selection of appropriate features for the desired result.
Lexicon Based Approaches are considered to be more of an amateurish way for sentiment analysis but have been used widely as well. This technique is ruled by the employment of a wordbook consisting of pre-tagged lexicons.
The input text is based on the tokens by the Tokenizer [6]. Each new token encountered is then matched for the lexicon within the Dictionary. If there’s a positive match, the score is added to the overall pool of score for the input text. For example, if “dramatic” could be a positive match within the wordbook then the overall score of the text is incremented. Otherwise, the score is decremented or the word is labeled as negative.
Anais Collomb et al [3] have studied and compared certain methodstoevaluatethe reputation of items using this sentiment analysis technique. After obtaining the results, they have then classified them into several different categories based on format, approach, techniques, rating, etc. The methods they have used are Rule-based method, Combination of lexicon- based and learning based approaches, Probabilistic graphical model, Machine learning, unsupervised machine learning, and Regression model.
J. Ramsingh et al [15] proposed a framework which is implemented using Python on Hadoop streaming. The data set is embedded from the data source for Twitter to determine the percentage of the population suffering from diabetes. In order to determine the results, the diabetic label is assigned after the tagging. Results are
with map reduction. With R-Hadoop, the result is depicted by a classification of the proportion of people are suffering from diabetes.
III. METHODOLOGY
The task of Sentiment Analysis on twitter reviews mainly include–Pre-processing, Classification and finally the analysis of results. The problem analysis in the Twitter analysis involves in particular initial processing that is pre- processing. Since the twitters data set contain unwanted words, slangs, and jargon, it is necessary to pre-process the data set. Examining the classification problem. As a result of initial processing, texts are listed with frequently used words. When elements are extracted, the appropriate characteristics are identified by means of sampling methods that eliminate properties that do not contribute to the effective classification. The classification includes determining the polarity of the report and classifying it as a positive or negative condition. LSTM controls the evaluation algorithm for efficiency and accuracy at the end of data collection. The proposed system is broadly classified in three stages to perform sentiment analysis.
▪ Preliminary processing phase: The data is first cleaned to reduce the noise.
▪ Feature Extraction: The tag is given for keywords and is currently being analyzed.
[image:3.595.46.293.561.736.2]▪ Classification phase: The classification based on the LSTM Neural network and compare with Naive Bayes classifier.
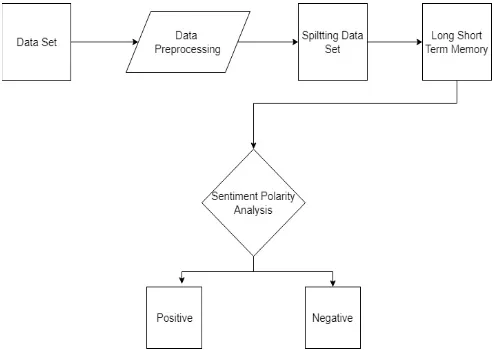
Figure 1 describes the proposed system where input is given as Twitter data set and the outcome of this system determines the polarity of the text..
Figure 1: Proposed System
A. Module Description
The methodology explains the algorithm that is implemented on the two divided datasets in detail. The following are the different stages of the system:
▪ Pre-Processing Phase
Pre-processing refers to changes in data preceding the implementation of the algorithm. Pre-processing is a method used to convert raw data into a clean dataset. In other words, when the data collected from different sources are collected in raw materials that cannot be analyzed. During initial processing, data is erased, HTML letters, labels, URLs, punctuation, and quotes are deleted. Thus, numbers are replaced with numbers in English and the punctuation mark is deleted. After the data processing, the porter stemming flow algorithm is applied.
▪ b. Splitting The Data Set
Course data collection is divided into two collections: one for the train data collection and testing data for a tracking code. This collection of test data is individually distributed for analysis. The test data collection was also designed for pre-processing to noise removal and data collected is clean.
▪ c. LSTM –Algorithm
We choose it as a multi-party map. This means we bring a string of words and learn the pattern to predict the next word. Words will be determined by the integer and then by the LSTM layer transfer vectors using an integrated matrix (prepared or trained). When we predict a new word, we pass through the sequence of words, predict the next word, update the order of identification, add another prediction, add the order of words and proceed and then generate output only for those which are essential for the prediction of next sequence of words.
The steps of the approach are outlined below:
Convert from the words list into a complete sequence list of integers
▪ Linguistics the words
With the most commonly used words and zero word modeling of 5000 words, limiting the number of words. Finally, the length of each control line (word count) changes. Therefore, limit every exposure to 500 words, we criticize in a short period of time and we make the short comments to zero values.
▪ Create LSTM model with an embedding layer
Each of the words looks at is mapped to the real vector, a popular text work method called word integration. The technique in which words are encoded by real spatial vectors in dimensional space, in order to be the relationship between the words in the sector of the vector. Keras contains a useful word for displaying possibly complex words in the built-in layout. Put each word in a realistic vector with 32- line vector.
▪ Build a model of convolution Neural Network and MaxPooling with layers
The revised data has a vertical spatial structure in the sequence of comments, and CNN can select characters in terms of feature for good and bad sentiment. These spatial characteristics can be learned from the LSTM layer sequences. Apart from the built-in layer, we can easily add a CNN layer and a maximum of one size link, which then brings consolidated functions to LSTM. We can use a small number of 32 features with a smaller 3 filters length of 3. The layout layer can use half the size of the default map size. ▪ Build the LSTM model with Dropout and Dense layers Neural networks, such as LSTM, generally have a problem of overload. Collapse can be used between layers using the Keras Dropout layer. This can be achieved by adding new layers and laying between LSTM layers and LSTM and dense production layers. Finally, as this is a class problem, we use a dense one-sided production layer and a sigmoid activation function for binary predictions for both classes (good and bad). Since this is a binary classification problem, the loss of the protocol is used as a loss function: binary cross entropy loss and ADAM optimized algorithm for optimization. The model is suitable for the 8 epochs because it quickly overcomes the problem. A large selection of 32 differences is used for weight updates.
▪ Trains model to predict the sentiment of the test data set After using the train data capabilities, expect test data reports and compare to the Naive Bayes approach.
IV. EXPERIMENT
The analysis explains the results obtained by the proposed system and the results are compared with Naive Bayer classifier.
A. Accuracy
Accuracy is the most intuitive way to handle and is easy to manage. The right observation implies general observations of corrected accurate results. The accuracy of our system is observed to be 87% which is much higher than Naive Bayes that is 54%. Accuracy between the two systems is plotted and shown in figure 2. Accuracy can be calculated as shown in equation 6.1 [16].
[image:4.595.309.549.281.430.2]Accuracy = (TP+TN)/(TP+ FP + FN + TN)
Figure 2: Accuracy Analysis
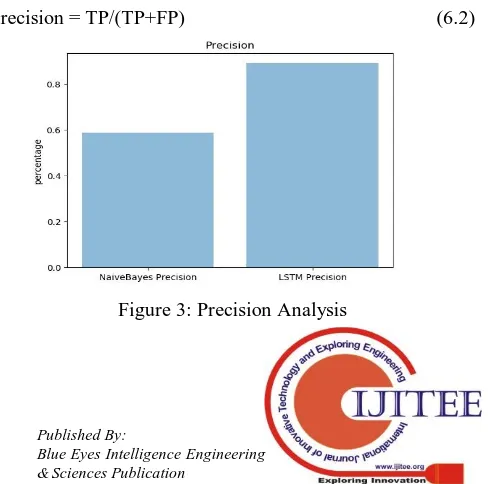
B. Precision
The precision is that accurate forecasting of positive observations is positive predictions of positive results. The precision of our system is observed to be 89% which is much higher than Naive Bayes that is 59%. Precision between two systems is plotted and shown in figure 3. Precision can be calculated as shown in equation 6.2 [16]
Precision = TP/(TP+FP) (6.2)
[image:4.595.310.554.593.835.2]C. Recall
The recall is the ratio of correctly predicted positive observations of all the observations in actual class - yes. The Recall of our system is observed to be 88% which is much higher than Naive Bayes that is 65%. Recall between two systems is plotted and shown in figure 4. Recall can be calculated as shown in equation 6.3 [16]
[image:5.595.50.274.196.319.2]Recall = TP/(TP+FN) (6.3)
Figure 4: Recall Analysis
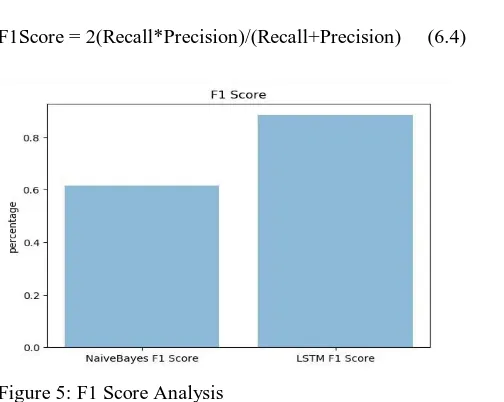
D. F1 Score
F1 is the weighted average of accuracy and recall. Therefore, this item takes into account both false positive and false negative results. The F1 Score of our system is observed to be 88% which is much higher than Naive Bayes that is 62%. F1 Score between the two systems is plotted and shown in figure 5. F1 Score can be calculated as shown in equation 6.4 [16]
F1Score = 2(Recall*Precision)/(Recall+Precision) (6.4)
Figure 5: F1 Score Analysis
V. RESULT AND CONCLUSION
Sentiment analysis is used to extract and analyze opinions about any product, review about any movie or a brand’s image. The data available on social media also contains opinions, expressions, judgments, perspectives in a wide
variety of fields. In the system, sentiment analysis is performed using Recurrent Neural Networks - Long Short Term Memory and evaluated. Long Short Term Memory classification algorithm is applied to classify the tweets into positive or negative sentiment because of their ability to remember and predict the next sequence of words in memory in the form of neurons. The results show that LSTM performs better compared to the Naive Bayes classification. As effective as this algorithm is correct input weights are to be added for the algorithm to not overfit. Social media texts are also rich in several different fields of data and this data must be carefully and meaningfully interpreted in order to gain ample knowledge about different subjects.
VI. FUTURE SCOPE
The algorithm in determining the sentiment of the test data can be interpreted more knowledgeable if used on a real-time database using Twitter API available in Python. A hybrid solution of this technique with lexicon based techniques would result in a higher end algorithm that can analyze sentiments in texts that contain not just texts but emoticons, digrams, trigrams, abbreviations, and acronyms, etc. Further, a system to detect sarcasm and mixed emotions should be developed for better understanding.
REFERENCES
1. Ankit Pradeep Patel, Ankit Vithalbhai Patel, Sanjaykumar
Ghanshyambhai Butani, Prashant B. Sawant,” Literature Survey on Sentiment Analysis of Twitter Data using Machine Learning Approaches”, IJIRST, 2017.
2. Geetika Gautam, Divakar Yadav, “Sentiment Analysis of Twitter
Data Using Machine Learning Approaches and Semantic Analysis”, IEEE 2014.
3. Anais Collomb, Crina Costea, Damien Joyeux, Omar Hasan, Lionel
Brunie, “A Study and Comparison of Sentiment Analysis Methods for Reputation Evaluation”, University of Lyon, INSA-Lyon.
4. Changhua Yang, Kevin Hsin - YihLin, and Hsin-His Chen, “Emotion
classification using web blog corpora”, Proceedings of the IEEE/WIC/ACM International Conference on Web Intelligence, IEEE Computer Society, 2007.
5. C.J. Hutto, Eric Gilbert: VADER: A Parsimonious Rule-based Model
for Sentiment Analysis of Social Media Text, Proceedings of the Eighth International AAAI Conference on Weblogs and Social Media,2014.
6. R. Suresh Ramanujam, R. Nancyamala, J. Nivedha, J. Kokila:
Sentiment Analysis Using Big Data, 2015 International Conference
On Computation Of Power, Energy, Information And
Communication.
7. Priya Gupta: Analysis of User Behavior for Twitter Posts on Hadoop,
International Research Journal of Engineering and Technology (IRJET) Volume: 04 Issue: 05 | May -2017.
8. Anuja Jain, Varsha Sharma, and Vivek Sharma: Big data mining using
supervised machine learning approaches for Hadoop with Weka distribution International Journal of Computational Intelligence Research ISSN 0973-1873 Volume 13, Number 8 (2017), pp. 2095-2111 © Research India Publications.
9. Zhao Jianqiang and Gui Xiaolin: Comparison Research on Text
[image:5.595.48.300.480.681.2]10. Mohammad Rezwanul Huq, Ahmad Ali, Anika Rahman : Sentiment Analysis on Twitter Data using KNN and SVM, (IJACSA) International Journal of Advanced Computer Science and Applications, Vol. 8, No. 6, 2017
11. Devendra K Tayal, Sumit Kumar Yadav: Fast Retrieval Approach of
Sentimental Analysis with Implementation of Bloom Filter on Hadoop, 2016 International Conference on Computational Techniques in Information and Communication Technologies (ICCTICT).
12. Subramaniyaswamy Vijayakumar , Logesh & Indragandhi:
Unstructured Data Analysis on Big Data using Map Reduce, 2nd International Symposium on Big Data and Cloud Computing (ISBCC’15).
13. Khushboo R. Shrote, Prof. A.V.Deorankar: Review Based Service
Recommendation for Big Data, International Conference on Advances in Electrical, Electronics, Information, Communication, and Bio-Informatics (AEEICB16)
14. Piyush Gupta, Pardeep Kumar & Girdhar Gopal: Sentiment Analysis
on Hadoop with Hadoop Streaming, Article in International Journal of Computer Applications • July 2015
15. J. Ramsingh, V.Bhuvaneswari: Data Analytic on Diabetic awareness
with Hadoop Streaming using Map Reduce in Python, 2016 IEEE International Conference on Advances in Computer Applications (ICACA)
16. “Metricformulae,<https://towardsdatascience.com/accuracy-precision