Abstract: Dengue is a viral disease that has been feared by people globally. Due to its rapid prevalence and increasing threat, this study explored on the use of data mining techniques together with decision support system to develop prediction models of dengue survivability. This study was focused on three important points namely: identify significant predictor attributes to dengue survivability prediction, development of a rule-based and decision tree models for dengue survivability prediction, and the development of a dengue survivability platform for prediction purposes. The developed rule-based and decision tree models were compared according to accuracy and they underwent the 10-fold cross validation procedure and were integrated in the system to provide a platform to predict the survivability of a patient given the input medical data using a client-server configuration via the Internet. The result of the prediction for the dengue survivability may be used as an intervention by medical practitioners in the general management of dengue cases.
Keywords: Data Mining, Decision Support System, Dengue, Prediction Models, Survivability.
I. INTRODUCTION
Dengue is a viral disease that has been feared by people globally. Today, “the incidence of dengue has increased 30-fold over the last 50 years and up to 50-100 million infections are now estimated to occur annually in over 100 endemic countries, putting almost half of the world’s population at risk” [1][2]. The World Health Organization (WHO) recently reported in the update of dengue situation in the Western Pacific Region that the Philippines has a total of 186,319 dengue cases which have been reported nationwide from 1 January to 24 November 2018, which is higher compared to 138,597 cases during the same period in 2017[3].
On the other hand, the Department of Health (DOH) here in the Philippines reported in their dengue surveillance that a total of 131,867 cases of dengue nationwide from January 1 to December 2017 and among these cases were recorded in Region 2, Philippines consisting of 3,869 in 2016 and 4,361 in 2017[4]. DOH however disclosed that the reports do not refer to the actual number of dengue cases because of the delayed reports submitted to them. This implies that the figure given by the DOH may be increased.
In the case of the Cagayan Valley Medical Center (CVMC) in Region 02, Philippines, their Electronic Medical Record (EMR) database showed that a total of 532 dengue cases were recorded in 2016 while a total of 1,349 dengue cases in 2017. Because of the rapid prevalence of dengue and the increasing threat of the disease, it has become a
Revised Manuscript Received on August 05, 2019.
Rosalinda B. Guiyab*, College of Computing Studies, and
Information and Communication Technology, Isabela State University Cabagan, Philippines.
pivotal area of concern to scholars, healthcare policy-makers, and management leaders worldwide.
With the rapid prevalence and increasing threat of the disease, various healthcare organizations like the WHO and the DOH here in the Philippines including the Department of Science and Technology (DOST), have been developing and studying strategies and programs to provide continuous surveillance and computer-assisted decision support to all medical practitioners who are responsible for inpatient care in general hospitals. These initiatives are undertaken in order to mitigate the occurrence of the disease.
From the foregoing, it substantiated that there is a need to develop strategies that can be helpful to address the problem about the prevalent occurrence and the increasing threat of dengue. An important strategy that can be explored is about the use of data mining techniques and decision support system in order to discover knowledge and to develop prediction models of dengue survivability.
“Data mining has the potential to generate a knowledge-rich environment which can help significantly improve the quality of clinical decision”[5] . To do this, data mining techniques are required that are capable of discovering knowledge that is useful for decision making. On the other hand, [6] stated that “data mining techniques can be implemented rapidly on existing software and hardware platforms to enhance the value of existing information resources, and can be integrated with new products and systems”. Thus, in this study, the models developed using data mining techniques are implemented and integrated in a rapid application development methodology. This is contemporary approach in order to develop a platform for prediction. This is supported by [7] that concluded in their study that “Computer based tools are more likely to work if integrated with clinical care and the integration of such a model into the electronic medical record may potentially enhance care of patients”. Hence, the models developed out of data mining were integrated into the system for dengue survivability prediction which becomes the basis to make efficient decision for proper intervention.
II. METHODOLOGY
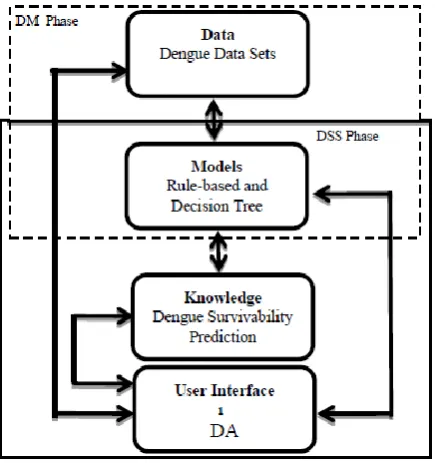
The framework of the study as presented in Fig. 1 is anchored on the concept of Decision Support System (DSS) as cited by [8] which was modified with the integration of the model developed through Data Mining (DM) techniques as a novel and modern way to decision support system development.
Development of Prediction Models for the
Dengue Survivability Prediction: An Integration
of Data Mining and Decision Support System
Fig. 1. Decision Support System Model
The processes involved in the DSS model in Fig. 1 were discussed as follows: 1. The user interface allows the system user to communicate with the system. This is the component of the system where users enter data and select models. The data is an individual, independent example of a concept or things that can be learned. The system users have the option to select which model and attributes are used to gain knowledge. 2. The models are used to create predictions, which is termed as Knowledge in this study, and which the user can then use to make decisions. 3. The knowledge is then presented to the system user based from the model selected and the needed inputs. 4. Data may come from an Access database with an extension name of .mdb or from Excel with extension names of .xls, .xlsx, or .csv. These data undergone selection, cleaning and transformation and were used to develop the models. The models developed were then integrated into the system.
The study is a descriptive research as it involves gathering of medical data as well as analyzing and describing of the dengue survivability prediction models. The predictors (predictor attributes) of this study included the following: Age, Gender, Civil Status, Admitting Diagnosis, Province, Month of Confinement and Number of days of confinement.
The dengue dataset covers the five year dengue patients’ data from 2013 – 2017 which were taken from the Electronic Medical Records of the Cagayan Valley Medical Center in Region 02, Philippines. The response attributes was the Result of Confinement. These data that were stored in different tables were cleaned by removing empty or null values. The different tables were integrated in order to create meaningful groups within the attributes to match that of the objectives of the study. A total of 4654 instances were used in this study.
To determine significant predictors, attribute evaluator using Correlation, Information Gain, and Gain Ration were used to select the significant predictors. Prediction models using JRip and PART for the Rule-based algorithms and J48 with and without pruning for the Decision tree algorithms were used to create prediction models. The models were validated using a 10-fold cross validation.
Weka was used in this study as a tool since it contains a collection of visualization tools and algorithms for data analysis and predictive modeling. It is platform independent and portable. It offers a wide range of classification algorithms that can be easily applied to any dataset.
III. RESULTS AND DISCUSSION
A. Significant predictor-attributes for dengue survivability models
To determine the significant predictor-attributes for dengue survivability models, three attribute evaluators were considered namely Correlation, Information Gain and Gain Ratio. These three attribute evaluators were selected as they use the same search method which is attribute ranking. Both the Correlation and Gain Ratio were also used as attribute evaluators to select the relevant attribute for Pima Indians Diabetes Database[9]. In addition, Information gain was also utilized in the study.
Fig. 2 presents the result of attribute evaluation using Correlation. Results show that the top four significant attributes for dengue survivability model are Days of Confinement, Admitting Diagnosis, Civil Status and Age.
[image:2.595.316.533.341.417.2]Fig. 2. Correlation Attribute Evaluation
Fig. 3 presents the result of attribute evaluation using Gain Ratio. Results show that the top four significant attributes for dengsue survivability model are the same with Correlation Attribute but with different ranking. The first, second, third and fourth attributes are the same with Days of Confinement, Admitting Diagnosis, Age and Civil Status respectively.
Fig. 3. Gain Ratio Attribute Evaluation
[image:2.595.325.534.527.595.2]Fig. 4. Information Gain Attribute Evaluation
The three attribute evaluators namely Correlation, Information Gain, and Gain Ratio consistently revealed that the top four significant attributes for the dengue survivability models were Days of Confinement, Admitting Diagnosis, Age, and Civil status. From the top four significant attributes identified, Age was also identified by [9] as relevant attribute for Pima Indians Diabetes using Correlation and Gain Ratio. In addition, [10] also identified that Age was one of the relevant factors for the Prediction of Coronary Heart Disease.
B.Dengue survivability prediction models
In the development of dengue survivability prediction models, all seven predictor-attributes were still considered. Two algorithms were employed in the development of the models, the rule-base algorithm and the decision tree algorithm.
Rule-Based Algorithm
For the rule-based algorithm, JRip classifer and PART Classifier of Weka were employed. Fig. 5 presents the result of the JRip classification. Results show that JRip generated six rules in 0.14 seconds with a classification accuracy of 98.52%.
Fig. 5. JRip Classification Result
Based from the JRip classification result, the dengue-survivability model generated is as follows:
Rule 1 If (Age >= 20) and
(DaysofConfinement >= 8) and (Age <= 41) then
ResultOfConfinement=Recover Rule 2 Else if (DaysofConfinement <= 1)
and (AdmittingDiagnosis = Dengue Severe with Co-morbidities) then ResultOfConfinement=Die Rule 3 Else if(DaysofConfinement <= 1)
and (AdmittingDiagnosis = Dengue Severe) then
ResultOfConfinement=Die Rule 4 Else if(AdmittingDiagnosis =
Dengue Severe with Co-morbidities) and (Age >= 18) and
(DaysofConfinement <= 4) and (CivilStatus = SINGLE) then ResultOfConfinement=Die Rule 5 Else if(DaysofConfinement <= 2)
and (AdmittingDiagnosis = Dengue Severe with Co-morbidities) and (Province = CAGAYAN) then ResultOfConfinement=Die Rule 6 Otherwise,
ResultOfConfinement=Improve
[image:3.595.350.499.432.538.2]On the other hand, Fig. 6 presents the result of the PART classification. Results show that PART generated 18 rules in .2 seconds with a classification accuracy of 98.37%.
Fig. 6. PART Classification Result
Based from the PART classification result, the dengue-survivability model generated were as follows:
Rule 1 If DaysofConfinement > 1 AND AdmittingDiagnosis = Dengue with Warning Signs then
ResultofConfinement = Improve Rule 2 Else if DaysofConfinhement > 1 AND
Age <= 19 then ResultofConfinement = Improve
Rule 3 Else if Age > 19 AND
AdmittingDiagnosis = Dengue with Warning Signs then
ResultofConfinement= Improve Rule 4 Else if DaysofConfinement > 1 AND
DaysofConfinement <= 7 AND AdmittingDiagnosis = Dengue Severe then ResultofConfinement= Improve Rule 5 Else if AdmittingDiagnosis = Dengue
DaysofConfinement <= 7 AND Gender = MALE then
ResultofConfinement= Improve Rule 6 Else if AdmittingDiagnosis = Dengue
with Warning Signs then ResultofConfinement= Improve Rule 7 Else if DaysofConfinement <= 1 AND
AdmittingDiagnosis = Dengue Severe with Co-morbidities then
ResultofConfinement=Die Rule 8 Else if Age <= 12 AND
MonthOfConfinement = December then ResultofConfinement=Die
Rule 9 Else if Age > 6 AND Gender = FEMALE AND Province = CAGAYAN AND Age > 38 then
ResultofConfinement=Improve Rule 10 Else if Age > 6 AND
Gender = FEMALE AND Province = ISABELA then ResultofConfinement = Improve Rule 11 Else if Age <= 6 then
ResultofConfinement=Die
Rule 12 Else if Province = CAGAYAN AND Gender = FEMALE AND
MonthOfConfinement = August AND DaysofConfinement > 4 then ResultofConfinement=Recover Rule 13 Else if Province = CAGAYAN AND
Gender = FEMALE then ResultofConfinement=Improve Rule 14 Else if Province = CAGAYAN AND
AdmittingDiagnosis = Dengue Severe then ResultofConfinement=Improve Rule 15 Else if Province = CAGAYAN then
ResultofConfinement=Die Rule 16 Else if Province = ISABELA then
ResultofConfinement =Improve Rule 17 Else if Province = APAYAO then
ResultofConfinement = Die Rule 18 Otherwise,
ResultofConfinement=Improve
Decision tree algorithm
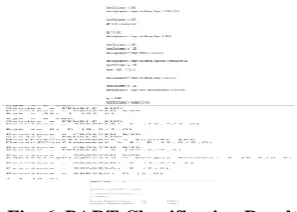
For the decision tree algorithm, J48 classifer of Weka was employed. Fig. 7 presents the result of the classification when J48 with pruning was applied on the pre-processed dataset. Results show that J48 generated five leaf nodes having a total tree size of seven in .01 second with a classification accuracy of 98.57%.
Fig. 7. J48 Classification Result with Pruning
Based from the J48 classification result, the dengue-survivability model generated were as follows:
Rule 1 If DaysofConfinement <= 1 and
AdmittingDiagnosis = Dengue Severe with Co-morbidities then
ResultofConfienment=Die
Rule 2 else if DaysofConfinement <= 1 and AdmittingDiagnosis = Dengue Severe then ResultofConfienment= Die
Rule 3 else if DaysofConfinement <= 1 and AdmittingDiagnosis = Dengue with Warning Signs then ResultofConfienment= Improve
Rule 4 else if DaysofConfinement <= 1 and AdmittingDiagnosis = Dengue with Warning Signs with Co morbidities then ResultofConfienment= Improve
Rule 5 Else if DaysofConfinement > 1 then ResultofConfinement=Improve
Fig. 8 presents the result of the classification when RepTREE was applied on the pre-processed dataset. Results
show that RepTREE generated 22 rules having a total tree size of 29 in .02 seconds with a classification accuracy of
98.43%.
Fig. 8. RepTREE Classification Result
Based from the REPTree classification result, the dengue-survivability model generated is as follows:
Rule 1 If DaysofConfinement < 1.5 and AdmittingDiagnosis = Dengue Severe with Co-morbidities then
ResultofConfinement= Die
Rule 3 else if If DaysofConfinement < 1.5 and AdmittingDiagnosis = Dengue with Warning Signs then
ResultofConfinement= Improve Rule 4 else if If DaysofConfinement < 1.5 and
AdmittingDiagnosis = Dengue with Warning Signs with Co-morbidities then ResultofConfinement= Improve Rule 5 else if DaysofConfinement >= 1.5 and
AdmittingDiagnosis = Dengue Severe with Co-morbidities then
ResultofConfinement= Improve
Rule 6 Else if DaysofConfinement >= 1.5 and AdmittingDiagnosis = Dengue Severe then ResultofConfinement= Improve Rule 7 else if DaysofConfinement >= 1.5 and
AdmittingDiagnosis = Dengue with Warning Signs then
ResultofConfinement= Improve Rule 8 else if DaysofConfinement >= 1.5 and
AdmittingDiagnosis = Dengue with Warning Signs with Co-morbidities and Age < 19.5 then ResultofConfinement= Improve
Rule 9 else if DaysofConfinement >= 1.5 and AdmittingDiagnosis = Dengue with Warning Signs with Co-morbidities and Age >= 19.5 and
Gender = MALE then REsultofConfinement=Improve
Rule 10 else if DaysofConfinement >= 1.5 and AdmittingDiagnosis = Dengue with Warning Signs with Co-morbidities and Age >= 19.5 and
Gender = FEMALE and
MonthofConfinement = September then ResultofConfinement=Improve Rule 11 else if DaysofConfinement >= 1.5 and
AdmittingDiagnosis = Dengue with Warning Signs with Co-morbidities and Age >= 19.5 and
Gender = FEMALE and
MonthofConfinement = April then ResultofConfinement=Improve
Rule 12 else if DaysofConfinement >= 1.5 and AdmittingDiagnosis = Dengue with Warning Signs with Co-morbidities and Age >= 19.5 and
Gender = FEMALE and
MonthofConfinement = August and DaysofConfinement < 4.5 then ResultofConfinement= Improve Rule 13 else if DaysofConfinement >= 1.5 and
AdmittingDiagnosis = Dengue with Warning Signs with Co-morbidities and Age >= 19.5 and
Gender = FEMALE and
MonthofConfinement = August and DaysofConfinement >= 4.5 then ResultofConfinement= Recover Rule 14 else if DaysofConfinement >= 1.5 and
AdmittingDiagnosis = Dengue with Warning Signs with Co-morbidities and
Age >= 19.5 and Gender = FEMALE and
MonthofConfinement = May then ResultofConfinement= Recover Rule 15 else if DaysofConfinement >= 1.5 and
AdmittingDiagnosis = Dengue with Warning Signs with Co-morbidities and Age >= 19.5 and
Gender = FEMALE and
MonthofConfinement = October then ResultofConfinement= Improve Rule 16 else if DaysofConfinement >= 1.5 and
AdmittingDiagnosis = Dengue with Warning Signs with Co-morbidities and Age >= 19.5 and
Gender = FEMALE and
MonthofConfinement = July then ResultofConfinement= Improve Rule 17 else if DaysofConfinement >= 1.5 and
AdmittingDiagnosis = Dengue with Warning Signs with Co-morbidities and Age >= 19.5 and
Gender = FEMALE and
MonthofConfinement = December then ResultofConfinement= Improve Rule 18 else if DaysofConfinement >= 1.5 and
AdmittingDiagnosis = Dengue with Warning Signs with Co-morbidities and Age >= 19.5 and
Gender = FEMALE and
MonthofConfinement = November then ResultofConfinement= Improve
Rule 19 else if DaysofConfinement >= 1.5 and AdmittingDiagnosis = Dengue with Warning Signs with Co-morbidities and Age >= 19.5 and
Gender = FEMALE and
MonthofConfinement = June then ResultofConfinement= Improve Rule 20 else if DaysofConfinement >= 1.5 and
AdmittingDiagnosis = Dengue with Warning Signs with Co-morbidities and Age >= 19.5 and
Gender = FEMALE and
MonthofConfinement = February then ResultofConfinement= Improve Rule 21 else if DaysofConfinement >= 1.5 and
AdmittingDiagnosis = Dengue with Warning Signs with Co-morbidities and Age >= 19.5 and
Gender = FEMALE and
MonthofConfinement = January then ResultofConfinement= Improve Rule 22 else if DaysofConfinement >= 1.5 and
AdmittingDiagnosis = Dengue with Warning Signs with Co-morbidities and Age >= 19.5 and
Gender = FEMALE and
MonthofConfinement = March then ResultofConfinement= Improve
C.Validity of the
developed for dengue survivability
[image:6.595.317.543.67.365.2]Table 1 presents the internal validation of the prediction models developed using the 10-fold cross validation which yielded the Classification Accuracy of the different data mining techniques used. The table shows that J48 has the greatest rate of correctly classified instances. This is in consonance with the findings of [10] that J48 was also found to be the best classification technique in the predictive performance of classifiers for Hearth Disease prediction.
Table 1. Summary of Classification Accuracy of the Prediction Models Developed
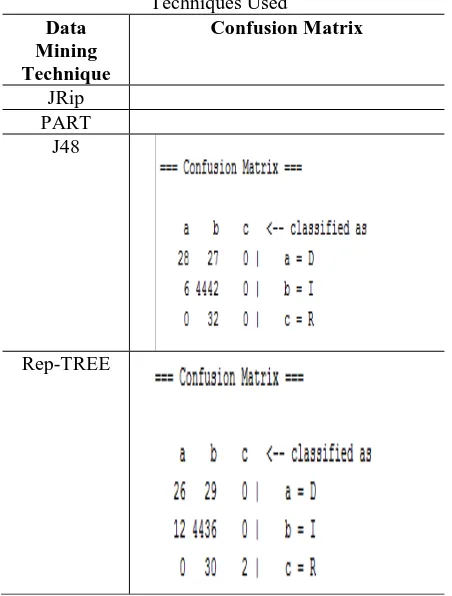
On the other hand, Table 2 shows the performance of the algorithms using the Confusion Matrices of the different data mining techniques used.
Confusion matrix of JRip shows that most of the instances were predicted to have a resulting confinement of patients to be ‘Improved’ and 4434 of which are correctly predicted while 101 were incorrectly predicted. Thirty seven from the instances were incorrectly predicted ‘Died’ while eleven were incorrectly predicted ‘Recovered’ and fifty three were incorrectly predicted as either ‘Died’ or ‘Recovered’. Similarly, Confusion matrix of PART shows that most of the instances were predicted to have a resulting confinement of patients to be ‘Improved’ and 4436 of which are correctly predicted while 99 were incorrectly predicted. Thirty five from the instances were incorrectly predicted ‘Died’ while two were incorrectly predicted ‘Recovered’ and sixty two were incorrectly predicted as either ‘Died’ or ‘Recovered’. In the case of J48, its Confusion matrix shows that most of the instances were predicted to have a resulting confinement of patients to be ‘Improved’ and 4442 of which are correctly predicted while 93 were incorrectly predicted. Thirty four were incorrectly predicted ‘Died’ and none were incorrectly predicted ‘Recovered’ and fifty nine were incorrectly predicted as either ‘Died’ or ‘Recovered’. On the other hand, when REPTree was considered, its Confusion matrix shows that most of the instances were predicted to have a resulting confinement of patients to be ‘Improved’ and 4436 of which are correctly predicted while 99 were incorrectly predicted. Thirty eight were incorrectly predicted ‘Died’ while two was incorrectly predicted ‘Recovered’ and fifty nine were incorrectly predicted as either ‘Died’ or ‘Recovered’.
The Confusion matrices of the different data mining techniques imply that the performance of the model was based on the number of correctly and incorrectly predicted instances.
Table 2. Confusion Matrices of the Different Data Mining Techniques Used
Data Mining Technique
Confusion Matrix
JRip PART
J48
Rep-TREE
D. Developed platform for the Dengue Survivability Prediction
Based from the result of the system development, screenshots necessary for the achievement of the objectives were presented. Fig. 9 presents the Set-up Module which is used to manage hospitals, users and user privileges.
Fig. 9. Set-up Module
Fig. 10 shows the Transaction Module which is used to manage dengue data and make predictions.
Fig. 10. Transaction Module
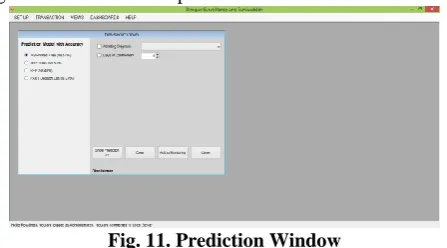
Fig. 11 shows the prediction window with the algorithms used for the prediction and its corresponding accuracy rate to predict the survivability of dengue patient. The default algorithm used is the J48 algorithm as the most accurate algorithm however, the user
have the option to select what Data
Mining Technique
Classi-ficatio
n Accura
cy
Time Taken to Build the Model
[image:6.595.74.239.198.296.2]algorithm to be used for prediction.
Fig. 11. Prediction Window
After selecting the desired algorithm used for prediction, the attributes will also be selected and the corresponding dengue patient data will be entered or selected for prediction purposes.
[image:7.595.57.278.472.601.2]Fig. 12 shows the selected attributes and the corresponding dengue patient data entered for prediction.
Fig. 12. Prediction Window with Selected Attributes and Dengue Patient Data Entered
To show the result of prediction, click the Show Prediction button to show the result of prediction. Fig. 13 shows the result of prediction based from algorithm and attributes selected with the corresponding data entered.
Fig. 13. Prediction Window with the Result of Prediction
IV. CONCLUSION
Based on the findings of the study, the following conclusions were drawn: The top four significant predictor attributes for dengue survivability prediction are Days of Confinement, Admitting Diagnosis, Age and Civil Status. Among the data mining techniques used, the decision tree algorithm using J48 is the most accurate model to predict the dengue survivability of patient. The results presented the potential
for medical data mining as well as the integration of data mining and decision support system to predict the survivability of dengue patient given the input medical data.
REFERENCES
1. H. Verespej and J. Pasquale, “A characterization of node uptime distributions in the planetlab test bed,” Proc. IEEE Symp. Reliab. Distrib. Syst., no. October, pp. 203–208, 2011.
2. G. F. O. R. Diagnosis, “New edition 2009,” 2009.
3. World Health Organization, “Dengue Situation Update Number 508 Update on the Dengue situation in the Western Pacific Region,”
World Heal. Organ. West. Pacific Reg., no. 508, pp. 4–8, 2017. 4. “2017_Dengue_MW1-MW48.pdf.” .
5. J. Soni, “Predictive Data Mining for Medical Diagnosis : An Overview of Heart Disease Prediction,” vol. 17, no. 8, pp. 43–48, 2011.
6. O. Folorunso and A. O. Ogunde, “Data Mining as a Technique for Knowledge Management in Business Process Redesign,” vol. 2, no. 1, pp. 33–44, 2004.
7. A. Kumar et al., “A decision support system to facilitate management
of patients with acute gastrointestinal bleeding . Adrienne Chu , Hongshik Ahn , Bhawna Halwan , Everson LA Artifon , Alan Barkun , Michail G . Lagoudakis and Atul Kumar . ( AC , HA and BH contributed equally to the study ) The study was funded by 2005 Research and Outcomes Effectiveness Awards of the American Society of Gastrointestinal Endoscopy .,” pp. 1–41, 2005.
8. A. S. Al-malaise, “Integration of Automated Decision Support Systems with Data Mining Abstract : A Client Perspective,” vol. 4, no. 2, pp. 173–176, 2013.
9. A. G. Karegowda, A. S. Manjunath, G. Ratio, and C. F. Evaluation, “Comparative study of Attribute Selection Using Gain Ratio,” Int. J. Inf. Technol. Knowl. Knowl. Manag., vol. 2, no. 2, pp. 271–277, 2010.
10. A. K. Sen, S. B. Patel, and D. P. Shukla, “A Data Mining Technique for Prediction of Coronary Heart Disease Using Neuro-Fuzzy Integrated Approach Two Level,” Int. J. Eng. Comput. Sci., vol. 2, no. 9, pp. 1663–1671, 2013.
AUTHORS PROFILE
Rosalinda B. Guiyab is currently an Associate