EFFECT OF DEFECT ORIENTATION IN PIPE ON ACOUSTIC WAVE PROPAGATION
SADDAM HAMOOD ALI MOHAMMED ABBAS B041310349
BMCL
Saddam.h.abbas@gmail.com
Report
Projek Sarjana Muda I
Supervisor: DR. NOR SALIM BIN MUHAMMAD Second Examiner: DR: REDUAN BIN MAT DAN
Faculty of Mechanical Engineering Universiti Teknikal Malaysia Melaka
EFFECT OF DEFECT ORIENTATION IN PIPE ON ACOUSTIC WAVE
PROPAGATION
SADDAM HAMOOD ALI MOHAMMED ABBAS
EFFECT OF DEFECT ORIENTATION IN PIPE ON ACOUSTIC WAVE PROPAGATION
SADDAM HAMOOD ALI MOHAMMED ABBAS
A report submitted
in fulfilment of the requirements for the degree of Bachelor of Mechanical Engineering (Plant & Maintenance)
Faculty of Mechanical Engineering
UNIVERSITI TEKNIKAL MALAYSIA MELAKA
DECLARATION
I declare that this project report entitled “Effect of Defect Orientation in Pipe on Acoustic Wave Propagation” is the result of my own work except as cited in the references.
Signature : ...
APPROVAL
I hereby declare that I have read this project report and in my opinion this report is sufficient in terms of scope and quality for the award of the degree of Bachelor of Mechanical Engineering (Plant and Maintenance )
DEDICATION
I would like to dedicate this humble effort to
Those who care about me when I need support and motivation My father
HAMOOD ALI MOHAMMED ABBAS
To whom I miss, my late mother MALEKAH AL-SHERHARI
To my supporting Family
To whom give me much of his time and knowledge My supervisor,
DR. NOR SALIM BIN MUHAMMAD
To my lovely country YEMEN
To my second home MALAYSIA
and To all my friend,
i ABSTRACT
ii
ACKNOWLEDGEMENT
iii
TABLE OF CONTENTS
CHAPTER CONTENT PAGE
DECLARATION APPROVAL DEDICATION
ABSTRACT i
ACKNOWLEDGEMENT ii
TABLE OF CONTENT iii
LIST OF TABLES iv
LIST OF FIGURES vii
LIST OF ABBREVIATIONS viii
LIST OF SYMBOLS xii
CHAPTER 1 INTRODUCTION 1
1.1 Background 1
1.2 Problem Statement 3
1.3 Objective 3
1.4 Scope Of Project 3
CHAPTER 2 LITERATURE REVIEW 4
2.1 Overview 4
2.2 Ultrasonic bulk wave and guided wave propagation. 4
2.3 Guided Waves propagation 5
2.3.1 Lamb wave propagation in plate 6
2.3.2 Guided wave propagation in pipe 6
2.4 Dispersion Curves 8
iv
2.6 Piezoelectric transducer (contact type) 11
2.7 Angle beam transducer 13
CHAPTER 3 METHODOLOGY 14
3.1 Overview 14
3.2 Experimental Flow Chart 15
3.3 Transducer Casing Design and Fabrication 16
3.3.1 Transducer Casing Design 16
3.3.2 Transducer Casing Fabrication 18
3.4 Shoe with Holder Design and Fabrication 19
3.4.1 Shoe and holder Design 19
3.4.2 Shoes and holders Fabrication 21
3.5 Defect Fabrication 23
3.5.1 Defect Fabrication in Perpendicular orientation
23
3.5.2 Defect Fabrication in Oblique orientation 24
3.6 Transducers develop 25
3.7 Transducer, Shoe and Pipe Setup 25
3.8 Materials Properties 26
3.9 Apparatus of Experiment 27
3.10 Wave Propagation in Pipe 30
3.10.1 Snell’s Law 31
3.11 Dispersion Curve and Mode Selection 32
3.11.1 Mode Selection 33
3.12 Schematic Diagram of Measurement System 33
3.13 Guided Wave Excitation in Pipe 34
3.13.1 Excitation of Longitudinal L (0, 2) Mode in Pipe
35
3.14 Defect Location 35
3.15 Signal Processing: 36
3.15.1 Signal Enhancement 37
v
CHAPTER 4 RESULTS 40
4.1 Overview 40
4.2 Enhancement single 40
4.2.1 Result of Perpendicular defect orientation: 40 4.2.1.1 Result of Perpendicular defect
after L (0, 1) mode cancellation
41
4.2.1.2 Result of Perpendicular defect
orientation after reduction of L (0, 2) mode
47
4.2.2 Comparison of waveform of pipe with perpendicular defect after L (0, 1) mode cancellation and L (0, 2) reduction.
53
4.2.3 Result of Oblique defect orientation: 54
4.3 Mode Identification 59
4.4 Defect Location 60
CHAPTER 5 CONCLUSION AND RECOMMENDATION 62
5. 1 Conclusion 62
5. 2 Recommendation 62
REFERENCE 63
vi
LIST OF TABLES
TABLE TITLE PAGE
3.1 Geometric of pipe 23
3.2 Dimension detail of the perpendicular defect 23
3.3 Dimension detail of the oblique defect 24
3.4 Properties of Aluminum 26
3.5 List of apparatus 27
3.6 Burst signal value for NF HAS 4052 High Speed Bipolar Amplifier with Stanford SR 560 Pre - Amp or RITEC Pas Pre-Amp
39
3.7 NI Digitizer USB - 5133 setting for NF HAS 4052 High Speed Bipolar Amplifier with Stanford SR 560 Pre - Amp or RITEC Pas Pre-Amp
vii
LIST OF FIGURES
FIGURE TITLE PAGE
2.1 Comparison between bulk wave and to guided wave method 5 2.2 Performing inspection for hidden pipe with by guided waves 6
2.3 Symmetric mode (s-mode) and asymmetric mode 7
2.4 Guided wave in pipe 7
2.5 The axisymmetric mode torsional and longitudinal in pipe, as well as non-axisymmetric mode flexural
8
2.6 Example of dispersion curve for Phase velocity of stainless steel pipe that has outer diameter 56 mm
10
2.7 Example of dispersion curve for group velocity of stainless steel pipe that has outer diameter 56 mm
10
2.8 Defects location (echo) in pipe 11
2.9 Example of piezoelectric transducer 12
2.10 The construction of the piezoelectric transducer 13
2.11 Angle beam transducer 13
3.1 Evaluation of defect orientation in the guided waves pipe inspection 15 3.2 Detail design of transducer casing part1 and part2 17
3.3 3D design of transducer casing part1 and part2 17
3.4 Vertical milling machine 18
3.5 Vertical milling machine during the process during of fabrication the transducer
18
viii
3.7 Shoe design 19
3.8 Holder design 20
3.9 Shoe and holder assembly 20
3.10 Cutting an acrylic plate 21
3.11 Cutting ac acrylic plate 21
3.12 Fabricating the grooves on the acrylic shoe 22
3.13 Holders Fabricating Processes 22
3.14 Defect location 23
3.15 3 mm depth defect – top view, side view 24
3.16 3 mm depth oblique defect 24
3.17 Transducer developed 25
3.18 Transducers with shoes and pipe setup 25
3.19 Cross section of pipe 26
3.20 Length of pipe 26
3.21 Snell’s law between to media 31
3.22 Incidence angle 32
3.23 The phase velocity vs. frequency curve of 6 mm aluminum pipe 32 3.24 The group velocity vs. frequency curve of 6 mm aluminum pipe 33 3.25 Schematic Diagram of system using NF HAS 4052 Bipolar Amplifier
and RITEC Pas Preamplifier
34
3.26 Transducer multiplexing set 35
3.27 Three different position of transducer 36
3.28 The signals obtained from each transducer as expected 36
3.29 Summation of waveforms 37
ix
3.31 The enhancement process for waveform 38
x end
4.25 Effect comparison of frequency excitation on the defect amplitude after L (0, 1) mode cancellation and L (0, 2) reduction.
53
4.26 Effect comparison of frequency excitation on the defect amplitude of the pipe end after L (0, 1) mode cancellation and L (0, 2) reduction.
53
4.27 Waveform enhance at 80 kHz after L (0, 1) mode cancellation 54 4.28 Waveform enhance at 90 after L (0, 1) mode cancellation 55 4.29 Waveform enhance at 100 kHz after L (0, 1) mode cancellation 55 4.30 Waveform enhance at 110 kHz after L (0, 1) mode cancellation 56 4.31 Waveform enhance at 120 kHz after L (0, 1) mode cancellation 56 4.32 Waveform enhance at 130 kHz after L (0, 1) mode cancellation 57 4.33 Waveform enhance at 140 kHz after L (0, 1) mode cancellation 57 4.34 Waveform enhance at 150 kHz after L (0, 1) mode cancellation 58 4.35 Effect of frequency excitation on amplitude of echo from the pipe end 58 4.36 Effect of frequency excitation on time arrival of echo from the pipe
end
xi
LIST OF ABBEREVATIONS
NDT Non-Destructive Testing SHM Structure Health Monitoring UT Ultrasonic Testing
GW Guided Wave
xii
LIST OF SYMBOL
A0 = Antisymmetric mode 0 A1 = Antisymmetric mode 1
L (0, 1) = Longitudinal mode 0, 1 L (0, 2) = Longitudinal mode 0, 2 S0 = Symmetric mode 0
S1 = Symmetric mode 1
1 CHAPTER 1
INTRODUCTION
1.1 Background
In line to the high demand in manufacturing and services there are many companies involved in business of power plant and petrochemical industries which use storage tanks, pressure vessel, and pipes in their facilities for storage, transfer and distribution. There are different ways for the installation of pipes on ground installations or underground installations. In addition, some of the installations have external coating of bitumen, polyethylene, polypropylene or asphalt. The flow of fluids and foreign materials in fluid transfer and distribution cause internal corrosion in the pipe networks. The cyclic loading on the pipe network also contribute into pitting in the pipeline while the effect of the environment also possible to cause external corrosion on the pipes. Therefor a predictive maintenance needed to ensure the quality of the pipe works, as well as to ensure non-stop operational capability of the factory and to prevent leakage in the pipes that carry the fluid materials or the gases as these fluids or gases might be harmful to human or caused the pollution into the environment. Moreover, in order to detect or screen the structure even for external failures using traditional ultrasonic technique will be very expensive due to the excavation, removal of the pipe insulation, and reinstallation of the pipe structures.
Therefore, the scientists have worked out on the development of a fast and reliable method for the detection of corrosion under insulation and underground pipelines. Ultrasonic guided wave in Non-destructive testing (NDT) structural health monitoring (SHM) contributed to solve these industries failure (Saeed Izadpanah, Gholam Reza Rashed, Sina Sodagar, 2008).
2
to ensure the quality of the pipe works, as well as to ensure non-stop operational capability of the factory and to prevent the pollution in the environment (Alobaidi et al., 2015).
Ultrasonic guided wave in solid media have become a critically important subject in NDT and SHM. New faster, more sensitive and more economical ways of looking at materials and structures have become possible when compared to the previously used normal beam ultrasonic or other inspection techniques. (Joseph L. Rose, 2014).
There are many advantages of using guided wave summarized as follows:
i. Perform an inspection for long distance as in the pipe from only single position of transducer, that’s means no need to scan entire structure under consideration, data can be obtained from a single probe position.
ii. Provide greater sensitivity even in lower frequencies can produce a better picture of the health of the material than the obtained data in normal beam ultrasonic inspection or the other NDT techniques.
iii. The ultrasonic guided wave analysis techniques can perform inspection even for the hidden structure, coated structure as in Figure 1.2 below.
iv. The inspection and guided wave propagation are cost effective because it is simple and rapid.
Guided wave inspection named” long range inspection” as technical name, the volumetric inspection is also known by a guided wave inspection used mainly to locate the pipe integrity as a fast screening tool for corrosion. Guided Waves are ultrasonic waves that guided by the object geometry in which they propagate. (Saeed Izadpanah, Gholam Reza Rashed, Sina Sodagar, 2008).
3 1.2 Problem Statement
Applications of guided wave technique in pipe inspection become more dominance for inspection of underground pipelines. However, corrosion defects in pipes occurs in verity of depths, sizes, geometries, and orientations. In some cases, the guided wave screen in pipes might fail to locate severity defects due to low sensitivity of the transducer against the defect geometries or orientations.
This study aimed to investigate the effect of defect orientations on the guided wave inspections by using a perpendicular and an incline defects in pipes. The results then will extended for signal enhancement to improve the sensitivity of defect screening in pipe structures.
1.3 Objective
The objective of the research to achieve following:
- Observe the effect of defect orientation on the sensitivity of a guided wave pipe inspection.
1.4 SCOPE OF STUDY
The scope of this research consists the experimental works to cover the following: 1. Design and fabricate the matching layers, backing layers, and casings for the PZT
transducer and its shoes.
2. Create an oblique defects in the aluminum pipes to detect this effect with 45 degree.
3. Development of guided wave measurement system.
4 CHAPTER 2
LITERATURE REVIEW
2.1 Overview
This chapter covers the literature review about guided waves inspections in two common structures use in industry, which are pipes and plates. It discusses dispersion curves and the transducers used in the guided wave inspection.
2.2 Ultrasonic bulk wave and guided wave propagation.
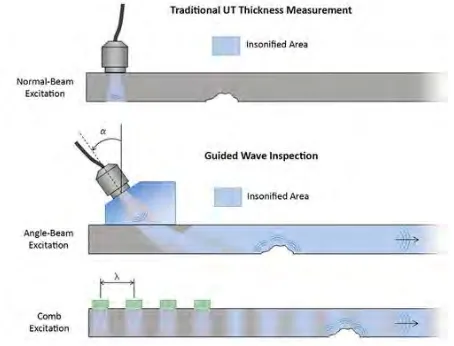
Ultrasonic bulk wave that propagate in the media with no boundaries, such as the waves traveling in infinite media. Nevertheless, guided wave characterized by it is required boundaries in order the propagation like in rods, pipes, plates. Guided waves naturally can propagate for the long distance provide tremendous potential for time in order to cost savings during the inspection for deferent structures. As shown in the Figure 2.1 below the guided waves able to achieve much ranges of inspection than conventional “bulk” ultrasonic testing methods, because the guided wave use the structure as a waveguide by using resonances between the boundaries of the structure itself, such as the plate surface or the outer diameter and inner diameter of a pipe. Conventional “bulk” wave UT systems able only to inspect an area that is very close to or directly under the transducer. In the bulk wave inspection, the transducer also must scanned along the surface of the structure in order to access to information in axial direction. On the other hand, guided wave systems can detect flaws for long distance from single probe transducer. It also able to locate defects at very low frequencies compared to conventional “bulk” wave UT, which reduce attenuation of the wave modes (Joseph L. Rose, 2014).
5
[image:23.595.168.395.157.330.2]thickness direction at higher frequency range (1 MHz - 15 MHz) while the guided wave generates acoustic wave in longitudinal direction either from an angle beam transducer or an array of transducers at lower frequency (50 kHz - 15 kHz). (Joseph L. Rose, 2014).
Figure 2.1: Comparison between bulk wave and to guided wave method (Joseph L. Rose, 2014).
2.3 Guided Waves
Guided waves started in industries in early 1990s for cost reduction on screening large structures. It is one of non-destructive testing (NDT) in structure health monitoring (SHM). The guided wave (GW) well known by its ability to perform inspection over long distance of pipelines or large structures. The Guided Wave (GW) typically used on inspection of whole structures from single probe location. The technique than can be used for service inspection in many different structures such as rods, pipes, thin plates, and multilayer structures. Its ability to perform rapid screening in long or large structures significantly reduce the operation costs during the inspections.
6
Figure2.2: Performing inspection for hidden pipe with by guided waves
2.3.1 Lamb wave propagation in plate
Horace Lamb studied the wave propagation at an isotropic solid plate with free surface (Lamb, 1917), Lamb waves a common waves used in plate detection of NDT. Lamb waves propagation are parallel to the surface plate during the thickness of the pate materiel. Properties of the plate, that effect the propagation of Lamb waves such as density and the elastic. In addition, they can effect a great deal by test frequency and material thickness. Lamb waves propagate at incident angle at which the wave velocity in the source is similar to the wave velocity in the plate material. Lamb waves is capable to travel long distance of the plate. A several modes of particle vibration are possible, and the most common are fundamental symmetrical and non-symmetrical modes as illustrate in Figure 2.3. Symmetrical modes (S-mode) has motion in a symmetrical pattern around the medium of plate surface. It is known as the extensional mode because of the wave is “stretching and compressing” the plate in motion direction of the wave. Symmetrical mode of wave motion is most efficiently propagated when excitation force parallel to the plate surface (Auld, 1990; Rose J. L., 1999).