Nitrogen dynamics of organic farming in a crop rotation based on red clover (Trifolium pratense) leys
62
0
0
Full text
(2) Agrifood Research Reports 121 60 pages, 4 appendices. Nitrogen dynamics of organic farming in a crop rotation based on red clover (Trifolium pratense) leys Doctoral Dissertation. Arja Nykänen. Academic Dissertation To be presented, with the permission of the Faculty of Agriculture and Forestry of the University of Helsinki, for public criticism in Viikki, Auditorium B6, on April 25th,2008, at 12 o’clock noon.. MTT Agrifood Research Finland.
(3) Supervisor:. Professor Artur Granstedt (Biodynamic Research Institute, Sweden). Reviewers:. Professor Kerstin Huss-Danell (Swedish University of Agricultural Sciences) Docent Jouko Kleemola (Kemira Grow-How Ltd.). Opponent:. Professor Friedhelm Taube (University of Kiel, Germany). Custos:. Professor Markku Yli-Halla (University of Finland, Finland). ISBN 978-952-487-169-3 (Printed version) ISBN 978-952-487-170-9 (Electronic version) ISSN 1458-5073 (Printed version) ISSN 1458-5081 (Electronic version) http://www.mtt.fi/met/pdf/met121.pdf Copyright MTT Agrifood Research Finland Arja Nykänen Distribution and sale MTT Agrifood Research Finland, Information Management FI-31600 Jokioinen, Finland, phone + 358 3 4188 2327, e-mail julkaisut@mtt.fi Printing year 2008 Cover picture Arja Nykänen Printing house Tampereen Yliopistopaino - Juvenes Print Oy.
(4) Nitrogen dynamics of organic farming in a crop rotation based on red clover (Trifolium pratense) leys Arja Nykänen MTT Agrifood Research Finland, Plant Production Research, Lönnrotinkatu 3, 50100 Mikkeli, Finland, e-mail: arja.nykanen@mtt.fi. Abstract In agricultural systems which rely on organic sources of nitrogen (N), of which the primary source is biological N fixation (BNF), it is extremely important to use N as efficiently as possible with minimal losses to the environment. The amount of N through BNF should be maximised and the availability of the residual N after legumes should be synchronised to the subsequent plant needs in the crop rotation. Six field experiments in three locations in Finland were conducted in 1994-2006 to determine the productivity and amount of BNF in red clover-grass leys of different ages. The residual effects of the leys for subsequent cereals as well as the N leaching risk were studied by field measurements and by simulation using the CoupModel. N use efficiency (NUE) and N balances were also calculated. The yields of red clover-grass leys were highest in the two-year-old leys (6 700 kg ha-1) under study, but the differences between 2- and 3-year old leys were not high in most cases. BNF (90 kg ha-1 in harvested biomass) correlated strongly with red clover dry matter yield, as the proportion of red clover N derived from the atmosphere (> 85%) was high in our conditions of organically farmed field with low soil mineral N. A red clover content of over 40% in dry matter is targeted to avoid negative N-balances and to gain N for the subsequent crop. Surprisingly, the leys had no significant effect on the yields and N uptake of the two subsequent cereals (winter rye or spring wheat, followed by spring oats). On the other hand, yield and C:N of leys, as well as BNF-N and total-N incorporated into the soil influenced on subsequent cereal yields. NUE of cereals from incorporated ley crop residues was rather high, varying from 30% to 80% (mean 48%). The mineral N content of soil in the profile of 0-90 cm was low, mainly 15-30 kg ha-1. Simulation of N dynamics by CoupModel functioned satisfactorily and is considered a useful tool to estimate N flows in cropping systems relying on organic N sources. Understanding the long-term influence of cultivation history and soil properties on N dynamics remains to be a challenge to further research. Key words: biological nitrogen fixation, mineral nitrogen, modelling, nitrogen use efficiency.
(5) Puna-apilanurmiin perustuvan viljelykierron typpitalous luonnonmukaisessa viljelyssä Arja Nykänen MTT, Kasvintuotannon tutkimus, Lönnrotinkatu 3, 50100 Mikkeli, e-mail: arja.nykanen@mtt.fi. Tiivistelmä Luonnonmukaisessa viljelyssä, jossa typen (N) lähteenä käytetään vain biologisen typensidonnan (BNF) kautta saatua orgaaniseen ainekseen sitoutunutta typpeä, on erityisen tärkeää käyttää typpi mahdollisimman tehokkaasti minimoiden hävikit ympäristöön. Tällaisissa viljelytavoissa BNF tulisi maksimoida ja palkokasvien jälkeen maahan jäävän typen saatavuus tulisi sovittaa viljelykierron seuraavien kasvien tarpeisiin sekä ajallisesti että määrällisesti. Tutkimuksessa tehtiin yhteensä kuusi kenttäkoetta kolmella paikkakunnalla Suomessa vuosina 1994 – 2006. Tavoitteena oli selvittää luonnonmukaisesti viljeltyjen eri-ikäisten säilörehuksi korjattujen puna-apila-heinänurmien sadontuotto ja BNF. Nurmien jälkivaikutusta seuraaville kahdelle viljalle kuten myös typen huuhtoutumisriskiä selvitettiin kenttäkoemittauksilla sekä CoupModel tietokonesimuloinnin avulla. Typenkäytön tehokkuutta (NUE) ja typpitaseita laskettiin myös. Tutkitut puna-apila-heinänurmet tuottivat keskimäärin korkeimmat sadot 2-vuotisina (6 700 kg ha-1), mutta ero 3-vuotisiin nurmiin oli pieni. BNF (90 kg ha-1) korreloi voimakkaasti apilan kuiva-ainesadon kanssa, kun apilan typestä suurin osa (> 85 %) oli peräisin ilmakehästä ja maan liukoisen typen määrä oli alhainen. Nurmiviljelyssä, jossa nurmisato korjataan pois, pitäisi nurmen apilapitoisuuden olla yli 40 % kuiva-aineesta, jotta nurmen typpitase olisi positiivinen ja typpeä jäisi seuraavan kasvin käyttöön. Tutkittujen nurmien peltoon jättämä typen ylijääm oli pieni, mikä selittänee nurmen alhaista jälkivaikutusta seuraavien viljojen satoon ja typen ottoon. Toisaalta nurmisadot ja niiden C:N, kuten myös nurmesta maahan muokattu typpi- ja BNF -määrä vaikuttivat viljasatoihin. Viljojen NUE oli kohtalaisen korkea, 30 % - 80 % (keskimäärin 48 %), kun se laskettiin nurmien maahan muokatun typen perusteella. Maan liukoisen typen pitoisuus koko maaprofiilissa (0 - 90 cm) oli matala, pääosin 15 - 30 kg ha-1. Tietokonesimulointi CoupModel -ohjelmalla onnistui kohtalaisen hyvin ja se vaikuttaakin lupaavalta jatkokehittelyyn käytettäväksi luomuviljelyssä. Lisätutkimusta tarvitaan selvittämään viljelyhistorian ja maaperätekijöiden vaikutusta luomutuotannon typpitalouteen koko viljelykierrossa.. Avainsanat: biologinen typensidonta, maan liukoinen typpi, mallintaminen, typen käytön tehokkuus. 4.
(6) Foreword. The research projects presented here were conducted at the MTT Agrifood Research Finland during 1996-2006. The field experiments were carried out in the research stations of MTT in Juva, Mietoinen and Sotkamo. I wish to express my sincere thanks and deep gratitude to Professor Markku YliHalla for guiding me through this demanding process. Your endless work by commenting my text made it possible to achieve all the goals I had in my mind. I am grateful for my supervisor Professor Artur Granstedt, who initiated most of the experiments and encouraged me with all my research work in the beginning of my career as a researcher. You have given me your support also during the difficult years of my life. I appreciate Professor Antti Jaakkola for his encouragement and initiation of my studies to be a PhD. My warmest thanks to all my co-authors in the articles of this thesis: M.Sc. Susanna Kunttu, M.Sc. Antti Laine and Mr. Jukka Kemppainen. Especially I wish to thank M.Sc. Lauri Jauhiainen for being so patient with me and doing the statistical analyses whenever I needed them. I also thank Dr. Tapio Salo for giving his valuable input on the modelling without any ‘project’ for that. I am so grateful for Dr. Kristina Lindström for her support and discussions during our trips in China, as well as for the guidance in scientific writing. I am thankful to the reviewers of this thesis, Professor Kerstin Huss-Danell and Docent Jouko Kleemola, for their useful comments and suggestions for improving the manuscript. I am grateful to all the people, who conducted the field and laboratory work. Especially I thank Mr. Kari Narinen and Ms. Marja Harmoinen for their valuable work in the fields of Partala and the endless sorting of clovers, grasses and weeds. I thank also Ms. Päivi Hämäläinen and Mr. Lauri Kössö in Juva as well as Ms. Marja Kujala and Mr. Reijo Björkbacka in Mietoinen. I wish to thank Ms. Riitta Koistinen and Ms. Ritva Kalakoski for always finding me the right articles in a short time. I acknowledge Sevastiana Ruusamo and Mary Mezler for the linguistic revision of my thesis. This work was initially supported by MTT Agrifood research Finland and I wish to express my sincere thanks to Dr. Pirjo Dalman, Prof. Sirpa Kurppa, Dr. Aarne Kurppa and M.Sc. Harri Huhta. The financial support of the Ministry of Agriculture and Forestry of Finland, guided by Lic.Sc. Markku Järvenpää, is greatly acknowledged. Additional support for the writing of this thesis belong to the Agricultural Research Foundation of August Johannes and Aino Tiura and the Finnish Cultural Foundation. Finally, I owe my dearest thanks to my children Paula, Paavo and Pekka for living their lives as children do, and ignoring me when loosing my nerves. I thank my mother and father as well as my brother Jouko and my former husband Arto for taking care of the children during the critical times of writing. My warmest thanks to my sister Pirjo and all my friends for being so supporting and encouraging during this project.. 5.
(7) List of original articles The thesis is a summary and discussion of the following articles, which are referred to by their Roman numerals in the text: I. Nykänen, A., Granstedt, A., Laine, A. & Kunttu, S. 2000. Yields and clover contents of leys of different ages in organic farming in Finland. Biological Agriculture and Horticulture 18: 55-66.. II. Nykänen, A., Jauhiainen. L., Kemppainen, J. & Lindström, K. 2008. Field-scale spatial variation in soil nutrients and in yields and nitrogen fixation of clover-grass leys. Agricultural and Food Science. Submitted.. III. Nykänen, A., Granstedt, A., Laine, A. & Jauhiainen, L. 2008. Residual effect of clover-rich leys on soil nitrogen and successive grain crops. Agricultural and Food Science. In press.. IV. Nykänen, A., Salo, T. & Granstedt, A. 2008. Simulated cereal nitrogen uptake and soil mineral nitrogen after clover-grass leys. Nutrient Cycling in Agroecosystems. Submitted.. The author’s contrbution in joint publications I, III, IV Arja Nykänen planned and conducted the field experiments together with Artur Granstedt, and calculated the results including the correlation analysis in Paper III. She also participated in the management of the field experiments in Juva. Arja Nykänen was mainly responsible for interpreting the results and for writing the papers. II. Arja Nykänen planned and conducted the field experiments and calculated and interpreted their results. She also participated in the management of the field experiment in Juva. Arja Nykänen was mainly responsible for writing the paper.. Reprints of the original articles are published with the kind permissions of A B Academic Publishers (I) and The Scientific Agricultural Society of Finland (III).. 6.
(8) Abbreviations BNF:. biological nitrogen fixation. BNF-N:. N originated from BNF, for example in incorporated biomass. DM:. dry matter. N:. nitrogen. Ndfa:. proportion of clover N derived from air. NH4+-N:. ammonium-N. NO3. - -N:. nitrate-N. Ntot:. total N content. NUE:. N use efficiency. OM:. organic matter. PCA:. Principle component analyses. PC:. Principle component. 7.
(9) Contents 1 . Introduction.......................................................................................... 9. 1.1 Organic farming in Finland.................................................................. 9 1.2 Red clover in leys............................................................................... 10 1.3 Biological nitrogen fixation .............................................................. 11 1.4 Nitrogen cycling and processes in soil............................................... 13 1.5 Crop rotation and the problem of nitrogen in organic farming . ....... 15 1.6 Objectives of the study....................................................................... 18 2 Materials and methods............................................................................... 19 2.1 Experimental sites.............................................................................. 19 2.2 Field experiments............................................................................... 21 2.3 Methods of analyses and measurements............................................ 23 2.4 Calculated parameters........................................................................ 24 2.5 Description of the CoupModel........................................................... 25 2.6 Statistical analyses............................................................................. 26 3 Results........................................................................................................ 28 3.1 Nitrogen input from red clover based leys......................................... 28 3.1.1. Ley yields and red clover contents....................................... 28. 3.1.2. Biological nitrogen fixation.................................................. 33. 3.1.3. Incorporated material - nitrogen content and C:N................ 35. 3.2 Nitrogen output from red clover based leys....................................... 36 3.2.1. Cereal yields and nitrogen uptake......................................... 36. 3.2.2. Nitrogen in soil and leaching risk......................................... 38. 3.3 Nitrogen balance in crop rotation...................................................... 39 3.3.1. Nitrogen input-output-ratio................................................... 39. 3.3.2. Nitrogen use efficiency......................................................... 40. 3.3.3. Simulation as a tool for describing N dynamics................... 41. 4 General discussion..................................................................................... 43 5 Conclusions................................................................................................ 45 6 References.................................................................................................. 46 7 Appendices................................................................................................ 61 8.
(10) 1 Introduction 1.1. Organic farming in Finland. According to the International Federation of Organic Agriculture Movements (IFOAM), organic agriculture consists of four principles: the principles of Health, Ecology, Fairness and Care (IFOAM 2005). Organic food and farming aims to minimise the use of external inputs and it favours renewable resources and recycling. Organic farming respects the environment’s own systems for controlling weeds, pests and disease by avoiding the use of synthetic pesticides, herbicides, chemical fertilisers, growth hormones, antibiotics and gene manipulation. Instead, organic farmers use a range of techniques that help sustain ecosystems and reduce pollution. Soil fertility is maintained and enhanced by a system, which optimises soil biological activity as the means to provide nutrients for plants and animals as well as to conserve soil resources. Animal husbandry is regulated with particular concern for animal welfare and by using natural foodstuffs. Currently in all the EU countries regulation 1804/1999 and supplementing regulation 2092/91 on organic production provide a minimum standard concerning the right to label food as organic (CEC 1999). In Finland, state authorities carry out the inspection and certification of organic production. Biochemist Professor A.I. Virtanen can be considered the pioneer of organic farming in Finland. During the 1930s, Virtanen developed the AIV-System, a N self-sufficient cultivation method, which included crop rotation with pastures, bread grains and also intensive red clover leys for winter-feeding preserved as silage. Silage was made by a new method using mineral acids for preservation. Professor Virtanen was awarded the Nobel Prize for chemistry in 1945 for this method, on which silage making in northern conditions is still based. Professor Virtanen was also known as a researcher of BNF (Karström and Virtanen 1937, Virtanen 1938, Virtanen 1944). Organic farming began in Finland as early as 1910, and the first farm was started in 1927. Organic acreage was very small until the early 1990s, when the Ministry of Agriculture and Forestry first started subsidizing farmers for conversion to organic farming. Even more farms started to convert in 1995, when Finland joined the EU. The highest number of farms and the greatest cultivated area was reached in 2004, with 4 900 farms (6.6%) and 162 000 hectares (7.3%), respectively. Today, 6.6% of Finnish arable area is certified as organic, which totals 149 500 hectares and 3 900 farms. The average size of an organic farm is 38 hectares, which is thus larger than the average size of all farms in Finland. About 50% of the total organic arable area was under ley cultivation and almost 35% was under cereals. About 45% of the organic farms practice animal production (Evira 2007).. 9.
(11) The Finnish Ministry of Agriculture and Forestry (MMM) has set a target to increase the area under organic farming to 15% of the total area of arable land by 2010 (MMM 2005). The organic food market in Finland is relatively weakly developed, since the market share of organic food is estimated to be about 0.8%. In Europe, Austria, Switzerland and Italy have the highest proportion, about 10%, of their agricultural area devoted to organic farming. The area under organic farming was about 4.2% of the total arable area in Europe in 2006 (Organic Europe 2007). The interest in research on organic farming grew in the beginning of the 1980s. In 1980 an extensive seven-year-project was begun in cooperation between several institutions investigating the possibility to improve the efficiency of BNF and utilisation of N (Uomala 1986). Two extensive comparative projects began in 1982: one entitled “Conventional and organic cropping systems at Suitia” (Hannukkala et al. 1990) and the other called “Self-sufficient crop rotation and cropping system” (Rinne et al. 1993). In 2002 MMM launched a four-year Research Programme on Organic Food and Farming with 15 research projects covering the whole food chain (Nykänen 2005).. 1.2. Red clover in leys. Legumes are an essential part of organic systems, where BNF is utilised as the N fertiliser. Nowadays, with agricultural prices and premiums decreasing, farmers also have to decrease their production costs. Legumes are seen as a way to reduce the use of inputs, mainly N fertilisers in crops, but also concentrates in animal feed in conventional farming, as well. It is also good to realise that production of mineral N fertilisers requires fossil fuel energy to break up the N≡N bond and fossil fuel is further required for transport of the products, while the Rhizobia use in situ energy originated by the photosynthesis of the legume itself to break up the N≡N bond. This requirement for energy from the host plant is one reason why clovers prefer taking up soil N instead of fixing it from the atmosphere whenever there is N available in the soil (Haynes 1980). In temperate Europe, white clover (Trifolium repens L.) is the most important forage legume, followed by lucerne (Medicago sativa L.) and red clover (Trifolium pratense). In Finland, which is under boreal climate, red clover is the most common fodder legume, but white clover and alsike clover (Trifolium hybridum L.) are used, too. Clovers are succesfully cultivated in the northernmost parts of Finland, i.e. at least 67 degrees latitude north and they are grown in mixtures with grasses like timothy (Phleum pratense L.), meadow fescue (Festuca pratensis L.) and tall fescue (Festuca arundinacea L.). Mixtures are more productive and present less of a risk for yield decrease in case of failure of the red clover than monocultures. They also utilise N from the soil better than monocultures and N leaching is lower, because grasses utilise soil N effectively (Loges et al. 2000, Halling et al. 2002).. 10.
(12) High nutritive values and intake by ruminants resulting in higher production of milk (Heikkilä et al. 1992, Bertilsson et al. 2001) and better animal performance in beef production (Lee et al. 2006) have been demonstrated for red clover compared to grasses as forage. Red clover also has high yields of digestible OM, metabolizable energy and N (Dewhurst et al. 2001, Halling et al. 2002, Abberton and Marshall 2005). Clovers are richer in Ca, Mg and many trace elements than grasses (Leaver 1985, Nykänen-Kurki and Hakkola 1994, Kuusela 2006). Also, P, S and K are required in relatively large amounts by legumes (Mulder et al. 1977, Marschner 1995). The decrease of digestibility is slower for clovers than for grasses, which gives a larger window of time for optimal harvesting of mixtures, as well (Rinne and Nykänen 2000). Red clover also increases the concentration of polyunsaturated fatty acids in milk (Steinshamn et al. 2007). On the other hand, there are some problems with clovers as fodder. They can cause bloating with grazing animals (Howarth 1975, Leaver 1985) and phyto-oestrogens can cause infertility problems (Kallela 1974, Mustonen et al. 2006). Utilisation of protein might be a problem that can lead to losses of N to the environment. The yield potential of red clover is high, but persistence over the years is a problem. Many authors have reported a yield decrease in the third or sometimes already in the second year of production (Salonen and Hiivola 1963, Mela et al. 1980, Frankow-Lindberg 1985, Huokuna et al. 1985, Fagerberg and Ekbohm 1995, Granstedt and Baeckström 1998, Halling et al. 2002, Väisänen et al. 2000, Mela 2003). This is probably mainly due to poor over-wintering, which can be due to diseases caused by pathogens like Sclerotinia trifoliorum (clover root) and Fusarium spp. (root rot) (Ylimäki 1967, 1969). Mineral N fertilisation and high levels of inorganic N in the soil also decrease clover content and growth, because grasses compete the clovers out, as they benefit from the N more effectively (Haynes 1980, Spatz and Benz 2001). Clover and grass species influence the competition, too (Hakala and Jauhiainen 2007). Red clover had been studied in Finland prior to the 1960’s, but the increased use of mineral N fertilisers and improved methods of harvesting and storage of ley yields decreased the interest in its cultivation. During the last two decades, however, interest has increased again, but the problems remain the same: low productivity and persistence over the years in boreal climatic conditions with a short growing season and long winter, as well as problems with effective harvesting methods and heavy machinery in modern cultivation.. 1.3. Biological nitrogen fixation. The ability of legumes to fix N is based on a symbiosis with bacteria, which develop in nodules produced by the plants on root hairs. These bacteria are relatively specific to host legume genera; for example Trifolium spp. with Rhizobium leguminosarum biovar trifolii. Rhizobium bacteria reduce N2 from the atmosphere to ammonia. The nitrogenase activity (based on the C2H2 assay) of the strains of the bacteria differs (Lindström 1984b, Lipsanen and Lindström 11.
(13) 1986) and therefore the seeds of clovers are inoculated with the most effective strain before sowing. Nitrogenase activity declines just before and during flowering (Lindström 1984a, Warembourg et al. 1997). Thus, the right moment to harvest red clover is in the beginning of the flowering, which is also the best moment for OM digestibility as a fodder (Rinne and Nykänen 2000). The activity is also high after defoliation, as there is a positive correlation between nitrogenase activity and rosette leaf biomass (Fernandez and Warembourg 1987). Lindström (1984a) concluded that when clover grows well, the nitrogenase activity is high, resulting in high BNF. There are several methods to measure BNF, which all have their advantages and limitations, and none is totally reliable in estimating the absolute amount of fixed N. The acetylene reduction assay (Hardy et al. 1968) was used widely in the past, but it provides only an instantaneous measure of nitrogenase activity. In the N-difference method, the total N amounts in yields of pure legume or legume-grass and pure grass plots are compared, assuming that the difference is accounted for by N fixed from air. This is a cheap method, but it can either underestimate (pure legume) or overestimate (mixtures) BNF because of the assumption that legumes take up as much soil N as grasses do (Rennie and Rennie 1983, Carlsson and Huss-Danell 2003). Two 15 N isotopic techniques, natural abundance and enrichment, rely on the differences in 15N abundance between soil N and N2 in the atmosphere (Ledgard et al. 1985, Ledgard et al. 1987, Peoples et al. 1989). A non-fixing reference plant is used to measure the 15N/14N ratio in the soil. Natural abundance can be used, if the abundance of 15N in the soil is higher than in atmospheric N2 (0.3663 atom %), and it requires a precise mass spectrometer. More usually, the difference between soil N and N2 is expanded by incorporation of 15 N enriched nitrogenous compounds into the soil. Enrichment is regarded as the most reliable technique for BNF estimation under field conditions (Chalk 1985, Witty et al. 1988). BNF is influenced by many factors in soil: moisture, acidity and nutrients. Too high soil moisture limits the diffusion of N2 and oxygen to the nodules and on the other hand, too low humidity affects the whole plant and nodules (Sprent 1976). In modern agriculture with heavy machinery and risk of soil compaction, much attention should be paid to soil structure. The symbiosis between N-fixing plants and Rhizobium –bacteria requires P, K, Ca, Mo, Fe, B and Co (O’Hara et al. 1988, Høegh-Jensen et al. 2002, Høegh-Jensen 2003), but it is sensitive to low pH as well as to higher Al and Mn concentrations (Rice et al. 1977, Wood et al. 1984a, b, Lindström and Myllyniemi 1986). Soil N status interacts directly with BNF in the short and long term. In the short-term, increases in soil inorganic N (fertilisation) reduces BNF (Cookson et al. 1990, Høgh-Jensen and Schjørring 1994, Peoples et al. 1995). In the long-term, BNF leads to accumulation of soil N, grass dominance and reduced BNF. However, cyclical patterns of legume and grass dominance can occur due to tempo12.
(14) ral and spatial changes in plant-available N levels in soil. Thus, there is a dynamic relationship between legumes and grasses. Uptake of soil N by grasses increases BNF and competition by grasses reduces legume production and BNF (Ledgard 2001, Spatz and Benz 2001). The amounts of BNF in red clover have been measured in several studies under boreal climate (Heichel and Henjum 1991, Farnham and George 1994, Nesheim and Øyen 1994, Huss-Danell et al. 2007). The variation has been found to be very high, ranging from 40 to 370 kg N ha-1 year-1 in harvested biomass in temperate growing conditions. In Finland, Väisänen (2000) estimated BNF in organically farmed fields to be 90-115 kg N ha-1 in experimental plots and 24-67 kg N ha-1 on farms. Varis (1983) measured BNF with the N difference method and the values ranged from 50 to 130 kg N ha-1. These values are quite low and the limiting factors in soil might be several, as discussed above. BNF is also sensitive to temperature, which most probably is a limiting factor in our climatic conditions, especially as root temperature is more important than shoot temperature (Gibson 1971). The optimum temperature for red clover nodules is 20-30 ºC (Dart and Day 1971), although legumes can nodulate at as low as 7 ºC (Roughley 1970).. 1.4. Nitrogen cycling and processes in soil. In the N cycle, N flows from the plant to the soil OM via decomposing organisms. Through litter decomposition and N mineralisation, N can be used by subsequent crops or lost to the surrounding environment by leaching or volatilizing. N can also be retained in the soil OM, where it contributes to humus formation (Allison 1973, Jansson and Persson 1982, Granstedt 1992). The major sink in agricultural systems is harvest, while N leaching and gaseous losses are minor sinks. The systems have to be replenished with N by BNF, manure or other fertilisers. Most of the N transformation processes in soil are performed by micro-organisms. The main processes in the N cycle in soil are mineralisation and immobilisation. N mineralisation is defined as the transformation of N from the organic state into the inorganic forms NH4+ and NH3. The process is performed by heterotrophic soil organisms, which utilise nitrogenous organic substances as an energy source. N immobilisation is defined as the incorporation of inorganic N compounds (NH4+-N, NH3, NO3--N, NO2--N) into organic compounds. Soil organisms assimilate inorganic N compounds and transform them into organic N constituents of their cells and tissues, i.e. the soil biomass. Haynes (1986) has defined the decomposition of incorporated biomass to have three phases: leaching of water soluble substances, accumulation into microbial biomass and net release, when N is no longer limiting to microbial growth and activity. In cases of high N in the incorporated biomass, there is no accumulation phase. 13.
(15) The processes of mineralisation and immobilisation of N are very sensitive to several factors. Environmental conditions like temperature, moisture and oxygen (aeration) affect decomposition through decomposing microbes (Parr and Reuszer 1959, Stott et al. 1986, Coxson and Parkinson 1987, Klavidko and Keeney 1987, Paul and Clarke 1989, Breland 1994, Hesselsøe et al. 2001, Lahti and Kuikman 2003, Dahlin et al. 2005). In addition, soil type and pH (Christensen 1985, van Veen et al. 1985, Strauss and Dodds 1997, Müller 1988, Müller and Berg 1988, Müller and Sundman 1988) and plant material itself (e.g. N content and C:N; Amato et al. 1984, Berg et al. 1987, Janssen 1996) affect these processes. According to Haynes (1986), a N content above 2.0-2.5%, in incorporated biomass corresponding to a C:N of 20-25, results in net N mineralisation in the soil. On the other hand, plant material with a C:N higher than 45, corresponding to N content of 1%, will cause N immobilisation (Jensen et al. 2005). N mineralisation is affected by plant composition, including the content of lignin, carbohydrates, polyphenols, amino acids and proteins in the incorporated biomass (Haynes 1986, Fox et al. 1990, Honeycutt et al. 1993, Gunnarsson and Marstorp 2002, Gunnarsson 2003). Some authors have defined so called ‘humification coefficient’ describing the share of added OM to the soil is converted into humus, mostly during one year after application. This coefficient depends on the composition of the material (Janssen 1984, Granstedt 1993). N leaching occurs when there is plenty of NO3 - -N in the large soil pores, where water flows, and water movement downwards. The technique and timing of incorporation of N-rich biomass can have a major effect on N leaching. Several studies show that early ploughing in the autumn increases N leaching compared to ploughing in late autumn or in spring (Francis et al. 1992, Djurhuus and Olsen 1997, Känkänen et al. 1998, Korsaeth et al. 2002). Catch crops, such as rye grass, can reduce N leaching (Lewan 1994, Francis 1995, Aronsson and Torstensson 1998, Blombäck et al. 2003). The amount of N in incorporated biomass of clover-grass leys influences N leaching, as well (Eriksen et al. 2004, Hansen et al. 2005). N2 volatilisation occurs via both nitrification and denitrification. Tonitto et al. (2007) found legume-fertilised systems to result in 52% lower N2O flux relative to mineral fertiliser-driven systems in North America. Svensson et al. (1991) measured gaseous N losses from lucerne and mineral fertilized barley to be similar, although small, in Sweden. Niklaus et al. (2006) showed that more investigations are needed, because the plant composition strongly interacts with soil type in N emissions. Measured N2O emissions from recently fixed N (during the same growing season) are minimal, being 2% of the total N2O of white clover-grass leys, and the long-term mineralisation of dead clover tissues is probably more important. The standard N2O emission factor of 1.25% is unlikely to be reached in grass-clover leys (Carter and Ambus 2006).. 14.
(16) 1.5. Crop rotation and the problem of nitrogen in organic farming. Crop rotations, including leguminous crops such as clover-grass leys and pulses, are the basis of organic farming. Effective use of N, which is often a limiting factor, is very important in these farming systems. They rely on organic sources of N, basically derived from BNF of legumes. The amount of legume N and availability to subsequent crops are crucial factors in crop rotations, but they are difficult to evaluate and synchronise for plant needs. This is because of the great variation in growing conditions within and between fields, which depends on the many difficult to control factors influencing N cycling in soil. Knowledge of these factors is necessary for effective use of N and to avoid losses to the environment as well as economic losses. It is well established that N can be gained by green manuring, but in the case of fodder production, only the crop residues, i.e. stubble and roots of the ley biomass, can function as fertiliser for the subsequent crop. On a farm with crop rotation of cash crops and green manuring, N might not be the limiting growth factor, but the economic result can be low because of the non-profitable years of green manuring. In addition, N losses to the environment can be high when high amounts of N are mulched and incorporated into the soil. On farms with fodder production, legume-based leys are utilised as fodder and these farms are more efficient in their N use efficiency (Bleken et al. 2005). On the other hand, care must be taken that N, which is removed from the field for animals, is brought back as manure to maintain N balance in the field. The amount of BNF is strongly connected to the clover persistence and production, i.e. clover yield, in the ley. Kristensen et al. (1995) developed a simple model to estimate BNF based on visually determined clover proportion and age of the ley. Carlsson and Huss-Danell (2003) used wider data from the literature and they produced an equation based on red clover yield: BNF (kg ha-1) = 0.026 * red clover DM yield (kg ha-1) + 7. Väisänen et al. (2000) incorporated soil NO3 - -N concentration in the spring as a term containing a constant into the formula: BNF (kg ha-1) = 0.01996 * red clover DM yield (kg ha-1) - 0.268 * NO3--Nsoil. Høgh-Jensen et al. (2004) further developed an empirical model, which also included the below-ground BNF and values to presented parameters in differing conditions:. 15.
(17) BNF=DMlegume* N% * Ndfa * (1+ Proot+stubble + Ptranssoil + Ptransanimal + Pimmobile), where DMlegume = harvested legume DM yield N% = concentration of N in the DM of the legume Ndfa = fixed N2 as proportion of total N in the legume shoot DM Proot+stubble = fixed N2 in the root and stubble as a proportion of total fixed shoot N Ptranssoil = below-ground transfer of fixed legume N2 located in the grass in the mixture as a proportion of total fixed shoot N Ptransanimal = above-ground transfer (by grazing animals) of fixed legume N2 located in the grass in the mixture as a proportion of total fixed shoot N Pimmobile = fixed N2 immobilised in an organic soil pool at the end of the growing period as a proportion of total fixed shoot N. This formula suggests for our conditions (i.e. 1-3 years old cut red clover-grass leys in sandy or claye soil) that 40% of the BNF in the total biomass is in roots and stubble, transferred below-ground and immobilised in an organic soil pool at the end of the growing period (Proot+stubble + Ptranssoil + Ptransanimal + Pimmobile). This formula can be used for Ntot amounts in incorporated biomass in organically managed fields, as the Ndfa is most probably high. The amount of BNF is difficult to estimate, as the variation of clover content and yield of leys is great, both temporally and spatially. There is also a lack of an easy and cheap method for measuring BNF at the farm scale. Furthermore, the amount of BNF in roots, stubble and harvest residues is difficult to determine, because this biomass can vary greatly. Amounts ranging from 25% to 70% of total plant biomass have been reported (Hansson 1987, Granstedt 1992, HussDanell et al. 2007). Huss-Danell and Chaia (2005) showed that Ndfa is quite the same in all plant parts; thus, estimations of total BNF can be made by analysing only the above-ground plant shoots. Some fixed N is transferred from legumes to associated grasses, predominantly through decomposition of legume roots and nodules, and has been estimated at 2-26% of BNF, being higher with increasing age of the ley (Ledgard and Steele 1992, Jørgensen et al. 1999). Several studies have already defined some of the factors that may influence the residual N effect of red clover-grass leys in Nordic environments (HøghJensen and Schjørring 1997, Granstedt and Baeckström 1998, Känkänen et al. 1999, Granstedt and Baeckström 2000, Turtola et al. 2003), but they each describe only a single individual set of circumstances. Mathematical models are useful tools to integrate the results of single studies and describe the current 16.
(18) understanding of complex systems of N dynamics in soil. They can be used to improve the practical management of organic residues as fertilisers, NUE, and economic result of farms, as well. The Swedish CoupModel (Jansson and Karlberg 2007) and its sub-models have been applied to several sites with different soil types and climatic regimes. N dynamics in different cropping systems with cereals (Johnsson et al. 1987, Korsaeth et al. 2002, McGechan et al. 2005) and grass leys (Bergström and Johnsson 1988, Johnsson and Jansson 1991, Korsaeth et al. 2003) as well as catch crops (Blombäck et al. 2003) have been simulated with acceptable accuracy. According to my knowledge, cropping systems based only on BNF have not been simulated before. In organic farming it is especially important to have a balance between inputs and outputs of N to ensure both short-term productivity and long-term sustainability. Nutrient management must be planned and managed over periods of longer than a single crop or growing season (Watson et al. 2002). Nutrient budgets are a tool to describe N flows and assist in the planning of the rotational cropping. Depending on the management, the N input-output-ratio can range from deficit to surplus in organic farming systems (Nolte and Werner 1994, Fagerberg et al. 1996, Korsaeth and Eltun 2000). Good correlations have been found between calculated N balances and changes in soil N (Uhlen 1989, Nyborg et al. 1995). NUE is a possibility for measuring the apparent recovery efficiency of applied N (Cassman et al. 1998, Cassman et al. 2002). More efficient use of N in cultivation can lead low losses to environment as well as higher income for farmers when achieving higher yields with same inputs. There are several ways to calculate the NUE. Usually, NUE is calculated as the difference in N uptake between fertilised and unfertilised plots. However, it may also be calculated as the slope of the regression of the crop N uptake versus the applied fertiliser. NUE has been used only rarely in situations where the input of N is from organic sources as BNF (Mosier et al. 2004) although it describes the overall management of nutrients in a very informative way.. 17.
(19) 1.6. Objectives of the study. The level of BNF is crucial to organic farming N management and quite often it is the limiting factor for production. The estimation of BNF is difficult because of great variation in red clover growth in fields. Although red clover (Trifolium pratense) is one of the most common perennial legumes in leys in temperate regions, its residual effect in cutting systems has rarely been studied, at least not without any supplementation of mineral fertilisers or manure. N leaching after the ploughing of white clover-based leys has been studied, but fewer data are available for red clover in organic farming. In order to maximise N use by crops and minimise N losses to the environment, it is important to quantify the effect of leys on the subsequent crop as well as qualify the characteristics of leys that influence their residual effects. N balances, NUE and computer simulation are used in this study as tools to describe and manage N dynamics in crop rotations of red clover-grass leys and cereals in organic farming. This all was studied in Finland, with the short growing season allowing for a short period of N mineralisation. The overall objective of the study was to determine how to manage N in red clover-grass ley – cereal crop rotations of organic farming with maximal NUE and minimal losses to environment. The detailed research questions can be described as follows: What is the BNF of red clover-grass leys, its’ year-to-year and spatial variation and how can it be estimated on-farm? What is the residual effect of red clover-grass leys on subsequent cereals? What is the N balance of red clover-grass leys and NUE of two sequential cereals after a ley? Is it possible to use CoupModel for simulations of N dynamics in the crop rotations discussed above? These results can be used for developing methods and cultivation techniques to enhance BNF, to improve N balance and to increase the residual effect of red clover-grass leys, as well as to improve the NUE of cereals after leys.. 18.
(20) 2 Materials and methods 2.1. Experimental sites. Field experiments were carried out in three locations in Finland: Juva (61ο53’N 27ο53’E) and Sotkamo (64°07’N, 28°20’E) in eastern Finland and Mietoinen (60ο 40’N 21ο04’E) in south-western Finland. The thermal growing seasons (effective temperature sum) as long-term averages (1971-2000) are 162 days (1 200 degree days) in Juva, 156 days (1 100 degree days) in Sotkamo and 181 days (1 300 degree days) in Mietoinen. The average long-term rainfall from May to October is 370-380 mm in all locations. The experimental fields in Juva had been under organic farming since 1987, with crop rotation including red clover-based leys, cereals and vetches (Vicia villosa Roth., Vicia sativa L.) or field peas (Pisum sativum L., var arvense). Field 1 in Juva had not been fertilised with manure, while fields 2 and 3 had. The fields at Mietoinen and Sotkamo had been farmed conventionally prior to the experiments, which means that the plots were in the process of conversion to organic farming during the first two years of the experiments. In Mietoinen, red clover had been used in ley mixtures and also manure had been applied to the fileds, while in Sotkamo these were not used before the experiments started. In Juva, the soils were tentatively classified as Dystric Regosols (FAO 2006) in all fields (Table 1). The chemical characteristics were similar for both analysed soil depths (0-30 cm and 30-60 cm) in fields 1 and 2. The soil of the Sotkamo field had quite a coarse soil texture in the upper part of the field and it was classified as Cambic Podzol (Yli-Halla et al. 2000) and the lower part of the field was more silty and tentatively classified as Dystric Regosol (FAO 2006). The soils of both fields in Mietoinen were clay soils and they were tentatively classified as Vertic, Stagnic Cambisol (field 1) and Gleyic Cambisol (field 2) (FAO 2006). The pH and status of macronutrients of the surface soils in all locations were about the same or higher than the average in Finnish fields, except for Ca in Juva field 3, K in Sotkamo and Mg in all fields, which were lower than the average of those soil types in Finland (Mäkelä-Kurtto and Sippola 2002).. 19.
(21) 20. Sandy loam Clay loam. Gyttja clay. Sandy loam. Dystric Regosol. Dystric Regosol. Dystric Regosol. Vertic, Stagnic Cambisol. Gleyic Cambisol. Haplic Podzol / Dystric Regosol. Juva 1. Juva 2. Juva 3. Mietoinen 1. Mietoinen 2. Sotkamo 3. 12. 11. 28. 7. 37. 14. 12. 24. 11. 26. 74. 130. 170. 143. 134. 105. 75. 171. 74. 140. Extracted with acid ammonium acetate (0.5M CH3COONH4, 0.5M CH3COOH, pH 4.65). Soil:extractant = 1:10 v/v.. 6.2. 5.1. 6.5. 6.6. 6.7. 5.9. 6.1. 6.5. 6.1. 6.6. K 2). mg lsoil-1. pH 1) P 2). 2). 0.15. 0.31. 0.63. 0.19. 0.33. 0.14. 0.31. 0.30. 0.20. 0.31. %. Total N. Suspended with H20. Soil:water = 1:2.5 v/v.. 3.0. 1.8. 30-60 0-25. 5.6. 0.5. 30-60 0-30. 1.7. 0-30. 2.9. 1.5. 30-60 0-25. 3.0. 1.2. 30-60 0-30. 2.1. %. Org. C. 0-30. cm. Depth. 1). Sandy loam. Sandy loam. name. Experiment. Texture. Soil. Field /. 1203. 1500. 3440. 1200. 1840. 790. 1020. 2040. 740. 1610. Ca 2). 140. 100. 150. 84. 86. 95. 62. 114. 82. 156. Mg 2). II. I, III. I, III. II. I, III, IV. I, III, IV. Paper. Table 1. Soil properties of the experimental sites. Soil names are defined tentatively according to FAO (2006) classification. Soil nutrients are mean values from several samples..
(22) 2.2. Field experiments. Alltogether six field experiments in three locations were carried out to study the growth of red clover based leys and the residual effect for the subsequent two cereals. All seed mixtures of leys consisted of 5 kg ha-1 red clover (Trifolium pratense L.) and 16 kg ha-1 grasses (timothy, Phleum pratense L. and meadow fescue, Festuca pratensis Huds. or tall fescue, Festuca arundinacea Schreb.). Experiments 1 and 2 were not fertilised, but experiment 3 was fertilised with aerated cow slurry in Juva and with cow manure in Sotkamo. Papers I, III and IV deal with different phases of experiments 1 and 2 (Table 2), where 1-, 2- and 3-years old red clover leys were cultivated as pre-crops to spring wheat (Triticum aestivum L.) or winter rye (Secale cereale L.) followed in both cases by spring oats (Avena sativa L.). Monoculture cereal cultivation with barley (Hordeum vulgare L.) was also included in the experiments. The effect of ploughing time of the ley on soil mineral N was studied as well. In the experiments, cereal species nested with appropriate ploughing time (winter rye with early autumn ploughing and spring wheat with late autumn or spring ploughing) acted as the main plot and crop rotations with different leys and cereals as sub-plots (Table 2).. Table 2. Crop rotations (sub-plots) in experiments (Exp) 1 and 2 and crop rotation in experiment 3. Exp 1. 2. Sub plot. 1993. 1994. 1995. 1. Barleya. 1996. 1997. 1998. Oats. Oats. 2. Barleya. Barley. Rye/ Wheat. Oats. 3. Barleya. Ley 1. Rye/ Wheat. Oats. Barley. 4. Barleya. Ley 1. Ley 2. Rye/ Wheat. Oats. 5. Barleya. Ley 1. Ley 2. Ley 3. Rye/ Wheat. Oats. Ley 1. Ley 2. Rye/ Wheat. Oats. Oats. 6. Barleya. Ley 1. Rye/ Wheat. Oats. Rye/ Wheat. Oats. 1. Ley 1b. Oats. Barley. Rye/ Wheat. Oats. 2. Ley. 1b. Barley. Ley 1. Rye/ Wheat. Oats. 3. Ley. 1b. Ley 1. Ley 2. Rye/ Wheat. Oats. 4. Ley 1. Ley 2. Ley 3. Rye/ Wheat. Oats. 5. Ley 1. Ley 2. Rye/ Wheat. Oats. Oats. Rye/ Wheat. Oats. Rye/ Wheat. Oats. 2003. 2004. 2005. 2006. Barleya. Ley 1. Ley 2. Ley 3. 6. 3. Ley. 1b. Oats. Barley a. a. a. a. Ley undersown. b. Ley was ploughed under in May 1994, cereals are spring cereals except winter rye. 21.
(23) The experiments were located in Juva and in Mietoinen, with two fields in each. Mineral N (NO3--N and NH4+-N) was analysed from soil at depths of 0-30 cm, 30-60 cm and 60-90 cm. The soil samples were taken after breaking up the leys, i.e. during cereal cultivation. Samples were taken in May (the beginning of the growing season), August (at harvest) and November (before first frost), as well as during the growing season from the uppermost soil layer.. Figure 1. The experimental fields of Juva 3 (upper map) and Sotkamo 3 (lower map) with 105 and 100 plots of 10 m x 1.5 m. The 42 black plots in Juva were used for BNF measurements with the 15N enrichment technique.. 22.
(24) In experiment 3 in Juva and Sotkamo, the spatial variation in yield, clover content and amount of BNF of red clover leys was studied for three production years (Table 2, Paper II). The variation of soil nutrients in plough layer was also studied. Based on this variation, the relationships between soil nutrients and yields and BNF of the leys was further examined and the results appear in this summary only. Experiments were carried out with a geostatistical method using the spatial variation technique, model-based kriging, which results in maps describing the variation of different parameters as well as gives distances, where the spatial dependence ends. This in turn describes the appropriate distances between points for sampling of certain parameters. Studies were performed on two-hectare-fields, where 100-105 plots of 15 m 2 size were established with different distances between plots (Figure 1). Some ley samples were also collected from 10 organic farms in 1994 and 1998 to find out ley yields and red clover contents in farms (Paper I). The farms were close to Juva and represented red clover-grass leys of different ages. All farms had animals and leys were harvested for either hay or silage. Soils were mainly sandy, with one exception of peat soil.. 2.3. Methods of analyses and measurements. Biological N fixation (BNF) of red clover was measured with the 15 N enrichment method in experiment 3 in Juva (Paper II). In the early spring of each of the three years, 42 permanent 1 m 2 micro-plots were enriched with a 15 N (20 atom%)-double labelled NH4NO3 solution at a rate of 5 g N m-2. 15 N enriched NH4NO3 was dissolved in deionised water and pipetted onto the surface of the soil, followed immediately by deionised water. The proportion of clover N derived from the atmosphere (Ndfa) in ley mixture was calculated according to the following equation (Peoples et al. 1989): Ndfa = (1- (atoms %clover – 0.3663 / atoms % grasses – 0.3663)) x 100, where 0.3663 is the atom% 15 N of the atmosphere, and atoms % grasses represent the soil-derived N. The amount of N2 fixed (BNF) was then calculated: BNF = (clover dry matter x N% x Ndfa) / 100. The methods used for analyses and measurements in all six reported field experiments appear in Table 3.. 23.
(25) Table 3. Methods used in the analyses and measurements of the experiments. Property. Method. Paper. Plants Dry matter. Weighing of samples dried at 105ºC. I-IV. Total N. Dry combustion at 950 ºC, N determined from the heat I-IV conductivity of the gases, LECO. Total C. Dry combustion at 950 ºC, infra-red determination, LECO. I-IV. Red clover content Sorting by hand I Near Infrared Reflectance (NIR) Spectroscopy determi- II nation 15N. Atom Mass Spectroscopy determination. II. Soil NO3- and NH4+. Extraction (2 M KCl), colorimetric determination. III. Total N Total (organic) C pH. Dry combustion at 950 ºC, N determined from the heat II conductivity of the gases, LECO Dry combustion at 950 ºC, II infra-red determination, LECO Water extraction. I-IV. AAAc extraction, Inductively Coupled Plasma Mass Spectrometry (ICP) determination P AAAc extraction, Spectrophotometric determination Co, Cu, Fe, Mn, Zn AAAc-EDTA extraction, ICP determination Mo AAAc-EDTA extraction, Atomic Absorption Spectrometry (AAS) determination. I-IV. B. II. Ca, Mg, K. Hot water extraction, ICP determination. I-IV II II. AAAc = Acid ammonium acetate (0.5M CH3COONH4 + 0.5M CH3COOH, pH 4.65). AAAc-EDTA= AAAc + 0.02M Na2EDTA(C10H16N2Na2O8). 2.4. Calculated parameters. The amount of BNF in harvested ley biomass of leys in all experiments was calculated using the formula developed by Carlson et al. (2003), which was considered to be sufficiently accurate based on the 15N measurements in Juva 3 experiment (Paper II): BNF (kg ha-1 a-1) = red clover dry matter yield (kg ha-1 y-1) * 0.022 + 7. 24.
(26) N balance was calculated for ley cultivation over three production years in experiments 1 and 3 by subtracting the total amount of N in harvested (removed) ley biomass from the BNF. In addition, a regression was calculated for red clover content and N balance to find out the critical clover content resulting a positive N-balance in red clover-grass ley cultivation. This was done in all experiments except Sotkamo 3, where Ntot of the yield was not analysed. These results appear only in this work. Total N incorporated into the soil in experiments 1 and 2 (Paper III) was calculated from the harvested total N yield and BNF of the leys by multiplying harvested N yields and BNF amounts of leys by 0.6, assuming, that about 40% of the total biomass N is in roots, stubble and harvest residues (Evans 1977, Hansson 1987, Granstedt 1992, Høgh-Jensen and Schjørring 2001, Høgh-Jensen et al. 2004, Huss-Danell et al. 2007). Red clover content, N content and C:N in the incorporated biomass was calculated as a mean, weighted by the corresponding ley yield of the first and second cuts. The total N uptake of cereals in experiments 1 and 2 (Paper III) was calculated by summing up the N uptake of grain and straw, which were calculated by multiplying the grain and straw yields by their N contents, respectively. The cumulative N uptake for the first and second cereal after leys was calculated, as well. NUE of these cereal grains was calculated by regression analysis as the slope of grain N uptake versus the amount of N incorporated into the soil.. 2.5. Description of the CoupModel. CoupModel (Jansson and Karlberg 2007) is a physically based model to simulate fluxes of water, energy, carbon and N in the soil-plant-atmosphere system. The model structure consists of coupling into a single plant-growth model the soil water and heat model SOIL (McGechan et al. 1997) and the soil N model SOILN (Kätterer et al. 1997, Eckersten et al. 2001). The coupled plant growth model enables simulation of dynamic interactions between the abiotic environment and the plants. In this study, plant growth was based on a logistic growth curve approach, where the potential yield and N uptake were given as an estimated maximum uptake of the cultivated area. Actual growth was the potential growth reduced by linear response functions for adverse air temperature, N availability and water stress. The soil water and heat model provides driving variables for the soil N model, i.e. infiltration, water flow between layers and to drainage pipes, unfrozen soil water content and soil temperature. The model has a one-dimensional vertical structure, with the profile divided into 10 cm layers. Snow dynamics, frost, evapotranspiration, infiltration, surface run-off and drainage flows are included, as well. The model uses standard daily meteorological data as input to predict soil water and heat conditions in the soil profile.. 25.
(27) The soil N model includes the major processes determining inputs, transformations and outputs of N in arable soils. Inputs of N can be atmospheric deposition, manure and inorganic fertilisers added to the topsoil. In our case there was no fertiliser, and manure was replaced by input from crop residues, stubble and roots of the preceding ley. N uptake by plants as well as leaching and denitrification constituted the N outputs. The turnover rate of the organic N pools and other biological activities were also regulated by the moisture and temperature conditions in each layer. Two litter pools with different decomposition parameters and humus comprised the OM pool. Organic carbon pools were included in the litter fractions in order to regulate N decomposition and mineralisation. Simulations were made in experiments Juva 1 and Juva 2 for sub-plots 1-4 for spring wheat and spring oats after continuous spring cereal cropping and leys of different ages (Table 2). The model was first calibrated against measured biomass N uptake and soil mineral N in spring wheat and spring oats grown in cereal monoculture plots. The model was then validated comparing the measured and simulated values of these parameters (Paper IV). The transpiration affecting state variables like leaf area index, plant height and root depth were estimated to reach for optimal values of 3.0, 0.5 metres and 0.7 metres as maximum, respectively. Maximum plant N uptake was set to 9 g m-2, which was 120% of the highest measured N uptake in above ground biomass during the experimental period. The humus decomposition rate was increased from 0.005% day-1 up to 0.01% day-1 in order to provide a sufficient inorganic N supply to the cereal crops. Although the higher value is double the lower, it is well in the range of reported values by other authors (Johnsson et al. 1987, Korsaeth et al. 2003, McGechan et al. 2005). The humus was assumed to consist of material with a constant C:N of 10, while the incorporated plant materials were placed in the two litter pools. N (0.9 g m-2) and C:N (54-74) in incorporated cereal straws were as measured and the N amount of root residues (C:N = 15) was estimated to be 20% of the N amount in the aboveground biomass. N (7-9 g m-2) and C:N (17-22) of the incorporated biomass of leys were calculated as described in chapter 2.4.. 2.6. Statistical analyses. The yield data of leys in experiments 1 and 2 (Paper I) was analysed as a repeated-measures design, because the measurements were made over three years from the leys growing in the same plots. The main plots were combined for ley yields because the main plot effect (time of ploughing in the ley) appeared after ley cropping. The locations were analysed separately, but the experiments were analysed together in both locations. The results for clover contents were not analysed statistically because of the great variation. The correlation coefficients for red clover and total N content were calculated using Spearman’s correlation coefficient. The yield and N uptake data for cereals cultivated after leys (Paper III) were gathered from all experiments with the split-plot experimental design and they were analysed together. All measurement times and ex26.
(28) periments were analysed separately for NO3--N and NH4+-N data (Gomez and Gomez 1984). The analyses were made by the MIXED procedure of the SAS software (Littell et al. 1996). Data from the 1994 farm samples (Paper I) were not analysed statistically, but data from the 1998 farm samples were analysed as a complete randomizedblock design where each farm represented one block. The paired tests were made by Tukey’s t-test and all the analyses were done using the GLM procedure of the SAS software (SAS 1989). The spatial variation of soil nutrients and yields, red clover contents and BNF of leys in experiment 3 were analysed using a geostatistical method called model-based spatial interpolation (kriging). With this method it is possible to interpolate the value of the property under the study at any point in the field, although the measurement would originally have been made at a particular point in the field. Before the interpolation, spatial dependence was modeled with variograms (Bailey and Gatrell 1995, Lark 2000, Brooker 2001). The geostatistical analyses were done with the VARIOGRAM-, NLIN- and KRIGE2D-procedures of the SAS-program, version 9.1 (SAS 2004). Principal component analysis (PCA) was done for dry matter yields, red clover contents and BNF of leys in experiment 3 to find out which of the six cuts followed a similar spatial pattern in the field despite the varying weather conditions from cut to cut. Soil nutrients in the plough layer of the fields were analysed by PCA as well (Paper II). PCA resulted in factor scores for each field plot and principal component (PC) extracted during the analysis. In this summary, it was investigated whether yields or BNF of leys and some soil characteristics were related and they were put into the same PCA analysis. In the last step, PCs identified were described in the same way as original variables using the kriging. Correlation analysis by Pearson correlation was used to analyse the relationships between several parameters. In trials 1 and 2 the analysis was used for the identification of associations between the ley yield parameters (ley yields, BNF and N amounts incorporated into the soil as well as C:N in the incorporated biomass) and cereal yields, N uptake and NUE (Paper III). In trial 3 the correlations between soil nutrients and BNF, Ndfa and red clover yields of the leys were analysed in this summary. Relationships were identified with CORRand FACTOR-procedures (SAS 2004).. 27.
(29) 3 Results 3.1. Nitrogen input from red clover based leys. 3.1.1 Ley yields and red clover contents The yields of red clover–grass leys were highest in 2-year-old leys on organic farms (6 400 kg ha-1 DM) and also in most experimental fields under study, but the differences between 2- and 3-year old leys were not high in most cases in experimental fields being 6 700 kg ha-1 DM and 6 600 kg ha-1 DM, respectively (Paper I, Paper II). Väisänen et al. (2000) and Mela (2003) also found 2-year-old red clover-grass leys to have the highest production and Huss-Danell et al. (2007) reported the highest yields in 3-yearold red clover-grass leys. Still, several studies with no or only minimum N fertilisation indicate that the clover content and the yield of red clover-grass leys decreases with increasing age of the leys even after the first year of the ley mainly because of N fertilisation or plant diseases (Salonen and Hiivola 1963, Huokuna et al. 1985, Granstedt and Baeckström 1998, 2000). In Juva 3, the yields diminished dramatically after the first year of production, which might be for several reasons. Firstly, in this field, as well as on farms, the cropping practices are done by farm-scale machines after plot harvesting. The heavy machinery and traffic, which does not occur in the plot experiments, may cause injuries to the red clover plants and make them more vulnerable to diseases like clover rot (Sclerotinia trifoliorum) and root rot (Fusarium spp.), which can kill or weaken the plants (Ylimäki 1962, 1967). In these studies, the plant diseases were not determined. Secondly, the ley had almost three weeks longer growing time before the first cut in the first production year compared to the second and third production years. The cutting time of the second and third year leys might have been too early in relation to the physiological development stage especially for red clover, causing lower yields. Both red clover and timothy are known to be plants of a two-cut-system meaning that they do not tolerate cutting too early (Mela 2003). Thirdly, the cultivation history of the field is different from that of the other fields under study. That field has been under organic farming with red clover in crop rotation for 20 years, which might cause so-called ‘clover tiredness’, most probably associated with clover diseases. Considering the data as a whole, statistically significant correlations between the yields and red clover contents of leys were found only occasionally and in some cases even negative correlations appeared. This is the fact, although in the figures presenting mean values only, there seems to be a positive correlation especially in Juva 3 and Sotkamo 3 (Paper I, Paper II). This is surprising, as it has been a general belief, at least in Finland, that leys with higher red clover content have higher yields in organic farming. The explanation for non-correlation most probably is the mineral N content 28.
(30) of the soil, as the higher N in soil benefits grass growth, which increases ley yields. The variation of red clover content was very high both temporally and spatially, ranging from 10% to 95%. The yields of the second cuts were always lower than those of the first cuts being on average 30% of the total DM yield (Figure 2). This was explained by the shorter time for growth in the second cut compared to the first cut (54 vs. 66 days) in all leys except in Juva 3 experiment in 2005 and 2006 (71 days for the second cut vs. 55 days for the first cut). In these two cases in Juva, the reason might have been too early cutting time, as explained in the previous paragraph. Red clover started flowering very soon after the first cut depressing dry matter production (visual observation from the field). Huss-Danell et al. (2007) reported the opposite in their ley yield results from Umeå, explaining the difference by a higher temperature for the second cut. The red clover yield accounted for less than half of the harvested herbage biomass in the first cut in all locations (i.e. red clover content below 50%), which is in line with other results from Scandinavia (Gustavsson 1989, Nesheim and Øyen 1994, Huss-Danell et al. 2007). This is explained by the slow start of BNF associated with the growth of red clover in low soil temperatures in spring. On the other hand, the red clover yield was higher in the first cut, reflecting the higher total ley yield in the first cut (Figure 2).. -1. kg ha , dm 10 000 8 000 6 000 4 000 2 000 0. Juva 2. Mieto 2. 1995. Juva 1. Mieto 1. Juva 1. 1996 Clover 1. Mieto 1. 1994-96. Clover 2. Grass 1. Juva 3. Sotkamo. 2004-06. Farms 1998. Grass 2. Figure 2. Mean DM yields of red clover and grasses in the six field experiments and on farms of the study (recalculated from data in Papers I and II, 1 and 2 in the legend indicate first and second cut, respectively, Mieto = Mietoinen).. 29.
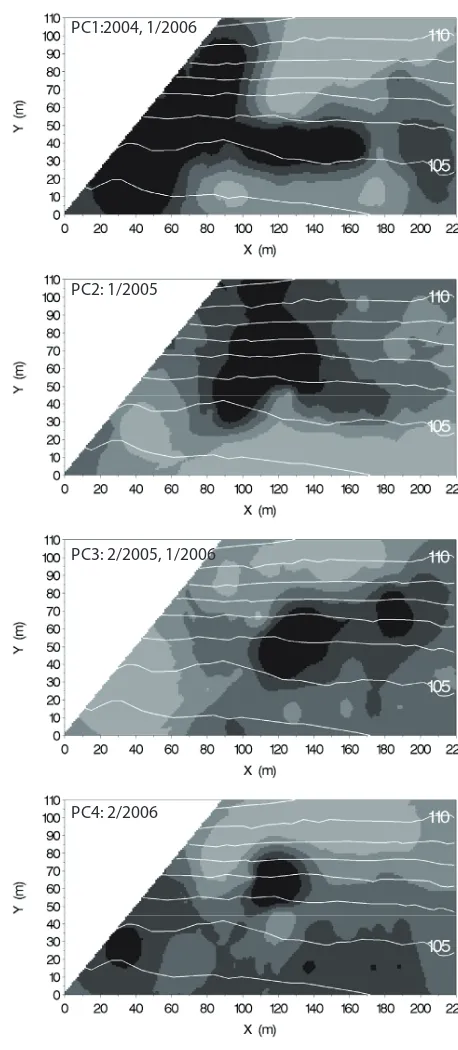
(31) The variation of ley yields between fields and years was very high, as the lowest yields were about 2 800 kg ha-1 year-1 and the highest were almost 11 500 kg ha-1 year-1. The highest yields were achieved on fields with longer and warmer growing season (Mietoinen), with higher OM content in soil (Juva 2 and Mietoinen 2), a cultivation history of conventionally cultivated grasslands without manure application or red clover (Sotkamo 3) or manure application in establishment (Juva 3, Sotkamo 3) (Figure 2). Higher OM content and manure application affected the grass yield, not the red clover yield, which can be seen when the yields of Mietoinen 1 and 2 as well as those from Juva 1 and 3 are compared (Figure 2). This is probably because grasses can benefit from a higher N in the soil more effectively than clovers and partly compete red clover out. The nutrient status of the main nutrients in the soils was mostly satisfactory except in Mietoinen 2, where the values were at a good or even high level (Table 1). Good yields were possible to achieve with good nutrient status together with higher OM content in soil. The within-field variation in ley yields was also very high. The difference between the highest and lowest yields was roughly as high as the mean yield itself (Paper II). In the Juva 3 and Sotkamo 3, the spatial variation of yields and red clover contents within the fields could be described in a very informative way using maps from the kriging method. Based on the results of PCA and kriging, it was realised that ley yields are affected by climatic factors, which is quite reasonable. The high and low yields were located in different parts of the fields for example in rainy year 2005 (PC2) and dry year 2006 (PC4) (Figure 3). Additionally the age of the ley seem to have an effect as the differences were often explained by different cuts and years, i.e. age of the ley. Therefore, combination of kriging and PCA seem to be a powerful tool for this kind of measures with low number of variables. Soil nutrients and pH influenced the growth of red clover-grass leys. According to PCA analysis (presented in the Summary only) of Juva 3 and Sotkamo 3, the total yields of leys were connected to all measured nutrients in different production years (Table 4). In Juva 3, the PCs were influenced by climatic conditions, as different nutrients were connected with dry growing season for the second cut in 2006 than than with all other cuts. In Sotkamo 3, the age of the ley had an effect on the PCs, as the mactonutrients were conncted in different way with younger than with older leys.. 30.
(32) PC1:2004, 1/2006. PC2: 1/2005. PC3: 2/2005, 1/2006. PC4: 2/2006. Figure 3. Relative yields of red clover-grass leys in four principal components (PC) found in Juva 3 in six cuts in 2004-2006. Colours describe relative yields: black describes high amounts and light grey describes low amounts.. 31.
(33) Table 4. Principal component loadings for variables of measured ley yields and BNF in six cuts (1 2004 – 2 2006) and soil nutrients in Juva 3 and Sotkamo 3. Macro- and micronutrients have been analysed separately for ley yields and in same analysis for BNF. Loadings below 0.5 are omitted for clarity. Juva 3. Sotkamo 3. Yield Macronutrients. BNF Micronutrients. Nutrient. Yield Macronutrients. BNF Micronutrients. Nutrients. Variable. PC1. 1 2004 2 2004. 0.9 0.8. 0.8 0.7. 0.7 0.6. 0.6 0.5. 0.7. 1 2005 2 2005. 0.9 0.8. 0.9 0.8. 0.8. 0.8. 0.7 0.7. 1 2006. 0.9. 2 2006 Ctot Ntot. PC1. PC2. 0.8 0.6. 0.8. PC1. K. 0.6. PC2. PC1. PC2. PC1. PC2 0.6. 0.7. 0.7. 0.8. 0.8. 0.6. 0.7. 0.8. 0.7. 0.7. 0.7. 0.5. -0.5. -0.8. 0.9 -0.5. PC1. 0.7. 0.8. pH Ca. Mg P. PC2. 0.7 -0.7 -0.9. 0.8 0.7. -0.9 -0.9. 0.7 0.6. -0.6 0.5. B. -0.7. Mo Cu. 0.8 0.6. Fe. 0.8. Mn Zn. 0.9. 0.7. -0.7 0.7. 0.8 -0.8. -0.5. 0.5. -0.6. -0.6. In Juva 3, the yields of leys were higher, if the concentrations of Ntot, Ctot, K, Mo, Cu, Fe and Mn in soil were higher and pH lower (Table 4). In the second cut, during the dry year 2006, higher yields were connected to lower Ca, Mg, P and Zn in PC2. In Sotkamo 3, macronutrients were important for crop growth in the first three cuts as well as Mo and Zn. Negative loadings in Ca, B and Zn appeared for PC2 during the last three cuts. These negative loadings are difficult to explain as they are connected with higher yields. The negative loading of pH in three out of four PCs reflects the fact that the optimal pH for red clover leys might be below 6, which was also apparent from results of Carran (1991) and Sparrow et al. (1995).. 32.
(34) Even though kriging with PCA seems to be a good method to describe the spatial variation of ley parameters within the field, it might not be as effective in connecting the ley parameters with soil nutrients. The variation in soil nutrients was high, as the nutrient concentrations fell into 3 to 6 classes out of the 7 according to the Finnish soil testing system. On this basis the method should work well. It is although possible that other factors, which have the same spatial variation as these nutrients, can limit the growth of the ley. In addition, method can’t give estimates on what will happen, if the concentration of one single nutrient changes. More sampling points or less variables in the same analysis could make the analysis more powerfull. Based on the analysis of spatial variation, the spatial dependence for ley yields disappeared after 60 metres and for red clover contents after 40 metres in the Juva 3 and Sotkamo 3 experiments. This means that samples for yield measurements should be taken every 120 metres and for red clover content determination every 80 metres. (Paper II). In practice this means, that farmers should take on average 2-3 samples per hectare from every field, which is too much during the busy harvesting time. Farmers can also estimate the yield harvested based on volume weights in storage, as some estimates (700-800 kg m-3, fresh weight) are given in professional magazines. Rinne et al. (2008) have developed a method for red clover content estimation of red clover-grass silage. The method is based on the different Ca-content of grasses and red clovers being as an average 4 g kg-1 and 14 g kg-1, respectively. Rinne et al. (2008) determined the red clover content and analysed the Ca-content of 40 samples taken from each cut of the ley yields in the Juva 3 and Sotkamo 3 experiments. An equation for red clover content was set to be -3.1 + 4.22 × Ca-content. This is a very useful method for farms, as Ca-content determination is routinely done for silage in Finland.. 3.1.2 Biological nitrogen fixation The mean amounts of BNF in the harvested biomass of red clover based leys of different ages ranged from 40 to 150 kg N ha-1 year-1 over all fields under investigation including the organic farms sampled in 1998 (Table 5). The variation of BNF within a field was also high, ranging from 20 to 250 kg N ha-1 and from 40 to 180 kg N ha-1 for lowest and highest value within a field in Juva 3 and in Sotkamo 3, respectively. In general, the highest values were almost double the mean value and the lowest values were half of the mean value.. 33.
(35) Table 5. Amounts of BNF (kg ha-1) in the first and second cuts of leys of different ages and means of total BNF over the three year test period in six fields from 1994 to 2006 (Paper II and recalculated from Paper I). Standard deviation is shown in brackets. Ley 1 Cut 1 60 (12) Mietoinen 2 60 (34) 1996 Juva 1 34 (10) Mietoinen 1 108 (25) 1994-96 Juva 1 23 (3) Mietoinen 1 31 (9) 2004-06 Juva 3 70 (25) Sotkamo 3 77 (25) 1998 Farms 42 (17) Mean 58 1995. Juva 2. Ley 2. Ley 3. Mean. Cut 2. Cut 1. Cut 2. Cut 1. Cut 2. Total. 30 (6) 42 (37) 38 (14) 28 (7) 39 (17) 32 (6) 78 (25) 24 (7) 48 (22) 39. 43 (10) nd 49 (8) 68 (19) 27 (7) 97 (30) 21 (8) 81 (21) 62 (18) 55. 29 (4) nd 39 (10) 28 (5) 32 (9) 33 (12) 21 (6) 34 (9) 44 (16) 31. 66 (13) 41 (8) 53 (10) 76 (14) 53 (16) 76 (14) 18 (5) 78 (19) 25 (14) 58. 33 (9) 21 (5) 41 (5) 29 (6) 41 (5) 29 (6) 21 (9) 44 (17) 25 (15) 32. 87 82 85 112 72 99 76 113 84 91. In our studies, the age at which the ley had the highest BNF level varied from field to field and was strongly connected to the biomass of red clover, which was also reported by Lindström (1984a). As an overall mean, the highest BNF was in 1-year-old leys of 97 kg N ha-1 (Table 5), which agreed well with studies of Heichel and Henjum (1991), Farnham and George (1993) and Nesheim and Øyen (1994). On the other hand, Heichel et al. (1985), Kristensen et al. (1995) and Väisänen et al. (2000) found the highest amounts of BNF in the second production year of the ley, which is quite the opposite to our results, at least in terms of the overall mean, which was lowest for 2-year-old leys. It is also good to realise that the BNF is not necessarily high eventhough the yield is high. This is obvious from our results as the highest yields were in 2- and 3-year-old leys and highest BNF in 1-year-old leys. The BNF was mostly higher in the first cut than in the second cut (Table 5). This can be explained by the fact, that BNF is strongly connected to the clover yield, which was higher in the first cut than in the second cut. On the other hand, the levels were quite often equal in the first and second cuts in the Juva fields. This might be because in Juva, the leys were harvested earlier than in Mietoinen and in Sotkamo. Lindström (1984a) and Warembourg et al. (1997) have reported nitrogenase activity to be highest just before or at flowering, which was the growth phase in Juva for the first cut. In Mietoinen and Sotkamo, the red clover was already flowering in the first cut and it had more time to fix N quite effectively. The optimum temperature for red clover nodules is 20-30 ºC (Dart and Day 1971) and temperatures over 20 ºC are reached only occasionally in June, July and August in the top soil in Finland (Heikinheimo and Fougstedt 1992). A mean temperature over 7 ºC, the lowest temperature for nodulation (Roughley 34.
Figure


+7


Related documents
In Yang [], the author derives similar results for the bi-Laplacian operator in dimension four and Yang [] constructs the existence and multiplicity of a weak solution for
The present study is different as it analyses the role of microfinance in empowering Muslim women as well as non-muslim women in a comparative perspective and
It is still an open question whether an elaborate rep- resentation and understanding of the story is needed for evaluating student writing, or whether encod- ing features that
Thus, what can be identified as explanatory factors of MMR, inter alia , are broadly social determinants including GDP, GDPP and household poverty, housing, education
is a performative act rather than an explanatory one (although more often than not the performance is mistaken for an explanation!), but they have a different temporal relationship
fertilizer and soil significantly affected fresh grain compared to fresh husk.. Distributed under a Creative Commons CC
The results of the current study are consistent with our previous re- port that memantine can significantly reduce the number of MHC II-IR microglia in the hippocampus of young
Pricing includes a 1 location imprint up to 5-colors with no set up fees (logo will be on the golf balls only unless otherwise specified) Pricing valid 1/1/16-12/31/16 or
