a Case Study of Tasmanian Manufacturing in the Context of Australian Manufacturing.
by
ANTHONY H. HILL B.A.
Being a thesis submitted in part fulfillment of the requirements for the degree of
Master of Environmental Studies.
Centre for Environmental Studies, University of Tasmania.
PREFACE
This thesis provides the first detailed analysis of the relation between trends in energy use, employment and output in the Tasmanian economy. It is based on the major energy using sector of the Tasmanian economy, manufacturing. This approach has reduced the complexity of this type of anal-ysis, but even despite this simplification, there still remained a large number of difficulties. This is one of the few analyses of this type carried out to date, and the first in Tasmania, so there was no straightforward direction to follow and certainly no blueprint for the results from a study of this type. Interest in energy related matters has only developed recently and there is an extreme shortage of official data on energy. A large amount of effort was re-quired to develop a suitable data base for the thesis. These difficulties have meant that, while the recommended length for theses produced for the Master of Environmental Studies is 50 pages, it has been necessary to exceed this length in order to present a unified analysis of this topic.
1 The Production, Employment and Energy Problem
1.1 Energy Use 1.2 Employment 1.3 Output
1.4 The Interaction of Energy Use, Employment and Output in the Manufacturing Process
1.4.1 Structural Change 1.4.2 Macro-economic Policy 1.4.3 Labour Productivity
1.404 Integration of Energy Use, Employment and Output
1.5 Conclusion 1.6 References
2 A Data Base for Manufacturing Energy Use, Employment and Output
2.1 Employment 2.2 Output 2.3 Energy Use
2.3.1 The Department of National Development and Energy Energy Use Survey
2.3.2 Manufacturing Census Energy Use Data 2.3.3 Electricity
2.3.4 Gas and Other Fuels
2.3.5 Coal and Petroleum Products 2.4 Conclusion
2.5 References
Method of Analysis
3.1 Previous Studies of the Relation between Energy, Employment and Output
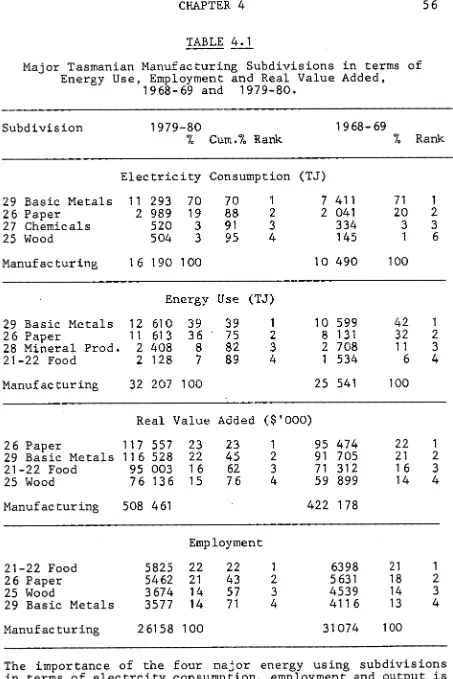
4 Energy Use, Employment and Value Added in Tasmanian Manufacturing
4.1 Structure of Tasmanian Manufacturing: Energy Use, Employment and Output
4.2 Trends in Tasmanian Manufacturing Energy Use, Employment and Output
4.2.1 Energy Use
4.2.2 Output and Employment
4.3 Trends in the Energy and Labour Intensity of Tasmanian Manufacturing
4.3.1 Energy Intensity of Output 4.3.2 Energy Intensity of Jobs
4.4 The Structure of Tasmanian Manufacturing in Terms of Energy and Labour Intensity
4.5 Conclusion 4.6 References
5 A Comparison of Tasmanian Manufacturing with Australian Manufacturing
5.1 The Significance of Tasmanian Manufacturing in Australian Manufacturing
5.2 Comparison of the Structure of Tasmanian and
Australian Manufacturing: Energy Use, Employment and Output
5.3 Trends in Manufacturing Energy Use, Employment and Output
5.3.1 Energy Use
5.3.2 Output and Employment
5.4 Trends in Manufacturing Energy and Labour Intensity 5.4.1 Energy Intensity of Output
5.4.2 Energy Intensity of Jobs
5.5 Comparison of the Structure of Tasmanian and Australian Manufacturing in terms of Energy Intensity
5.6 Conclusion
6 The Social Implications of Manufacturing Energy Use in Tasmania
6.1 Tasmania's Pattern of Economic Development 6.2 Trends in Energy Use, Employment and Output 6.3 Changes in the Manufacturing Process
6.4 The Social Implications of Changes in the Manufacturing Process
A Description of Australian Standard Industrial Classification (ASIC) Manufacturing Subdivisions Illustrative Source Data from the Department of National Development and Energy (DNDE) Energy Use
Survey
C Illustrative Source Data from the Australian Bureau of Statistics Manufacturing Census
D Tasmanian Manufacturing Energy Use by Subdivision, by Fuel, 1968-69 to 1979-80
ABSTRACT
CHAPTER 1 - The Production, Employment and Energy Problem
When the Organisation of Petroleum Exporting Countries (OPEC) introduced large price increases and supported this with an oil embargo in 1973, the world became much more aware of energy as an issue. A major concern was the econ-omic effect of the oil price increases and embargo. This concern directly related to the effects on economic growth and employment. Fears of the dire effects of the oil embargo were worst in the United States, which has the highest level of per capita energy use in the world. In the United States
the oil embargo set off a flurry of studies aimed at deter-mining the economic effects of the oil embargo (Commoner
1976; Eckstein and Heiem 1978; Grossman and Daneker 1977; United States, Energy Information Administration 1978; United States, Federal Energy Administration 1975; United States, General Accounting Office, Energy and Minerals Division 1979).
The changes that occurred in the oil market in 1973 have affected Australia and Tasmania differently to the United States. Australia's domestic supplies of energy, particular-ly oil and coal, have largeparticular-ly insulated it from events occurring in overseas energy markets. These Australian domestic supplies of energy have meant that Australia has not had the same experience of the 'energy crisis' as the rest of the world, but not that there has been no change in Australia's energy supply situation.
Australia has been affected by changes in overseas energy markets in two ways: through awareness of energy as an issue, especially as it relates to large economies such as the United States, and through energy price changes occurr-ing in Australia. However, there have also been domestic energy issues which have affected Australia separately. These domestic issues include the debate over the
construc-tion of further hydro-electric dams in Tasmania, shortages of electricity, particularly in New South Wales, the devel-opment of the 'resources boom' (with its associated energy intensive mineral processing), and the debate over the mining and export of uranium. All four of these Australian energy issues have been associated with questions of employ-ment and economic developemploy-ment. Further, while they are domestic Australian issues, or even indigenous to particular regions of Australia, they nevertheless have much in common with the energy related issues that have developed overseas. In summary, Australia has not had the same experience of energy issues over the 1970s, but it has had its own domestic energy issues which have a number of parallels with overseas experience.
CHAPTER 1 2 use and, employment and output, using Tasmania as a case study, so as to provide a basis for the analysis carried out in this thesis.
1.1 Energy Use
The most prominent aspects of the 'energy crisis' have been oil price increases and shortages of oil. These two aspects were particularly surprising for the United States and Europe. In Australia, these two aspects did not have the same impact until the introduction of world parity oil pricing by the Federal Government in the 1978 Budget.
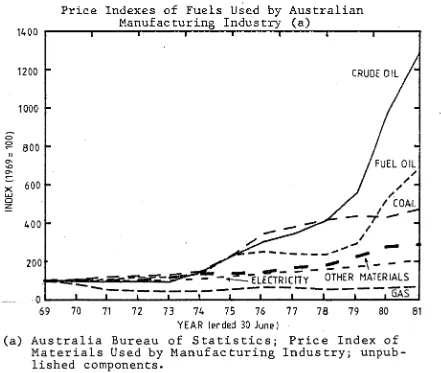
[image:8.558.42.483.354.727.2]Three periods can be identified with respect to Australia's energy situation during the 1970s and these are exemplified by the graph of energy price indexes for fuels used by Manufacturing Industry shown in Figure 1.1. The first period was between 1969 and 1974, when there was little change in
FIGURE 1.1
Price Indexes of Fuels Used by Australian Manufacturing Industry (a)
1200
1000
— 800 so
600
400
200
0
69 70 71 72 73 74 75 76 77 78 79 80 81 YEAR (ended 30 June)
(a) Australia Bureau of Statistics; Price Index of Materials Used by Manufacturing Industry; unpub-lished components.
energy prices. The second period started in 1974, with the introduction of large oil price increases by OPEC. In Aust-ralia there were only comparatively small energy price creases during this period resulting from oil price in-creases being transferred to other fuels because of fuel substitutability, and the then Labor Government's limited world parity oil pricing policy. The introduction of full world parity oil pricing in 1978 by the Fraser Government marked the beginning of the third period. This period was characterised by much more steeply rising prices for petro-leum fuels including fuel oil and crude oil.
These three periods have had a strong impact in Australia, and the large increases in oil prices give the impression that there has been a strong increase in all fuel prices. Figure 1.1 shows that, with regard to manufacturing industry in Australia, this is not the case . The graph of the price index for non-fuel material inputs to manufacturing in Figure 1.1, provides a measure of the general rate of inflation for manufacturing inputs. This graph can be used as a dividing line between fuels with real price increases and real price decreases. Two fuels are below this line, electricity and natural gas. Both these fuels have had falling real prices during the 1970s. The price of natural gas has even fallen in absolute terms despite the infla-tionary environment. While Australia has had increases in some energy prices, particularly oil prices, these increases have come later than for the rest of the world. They have not been as large and they have not affected all fuels.
Data limitations prevent the separation of different price changes occurring in Tasmanian manufacturing. However it is likely that price changes in Tasmania have been of a similar order and timing to those in Australia as a whole. One important difference for Tasmania is that it does not have access to the large supplies of natural gas available on the mainland. Therefore manufacturing industry in Tasmania was faced with strongly increasing prices for petroleum prod-ucts, a smaller but still significant rate of increase in the price of coal and only one fuel with a declining real price, electricity. Thus Tasmania is likely to share most of the energy price changes occurring in Australia. However these changes have occurred later in Australia and Tasmania than they did elsewhere. Tasmania also shares some of the insecurity of uncertain supplies of petroleum products, but it is insulated from the full effect by Australia's high level of self sufficiency. Insecurity is likely to increase as Australia's self sufficiency declines in the 1990s.
CHAPTER 1 4 ply, pollution problems, the expense of running oil fired plants and controversy over the damming of further rivers in predominantly hydro grids, not to mention black-outs and brown-outs.
In Tasmania the most important issues related to electricity supply has been the level of public opposition to develop-ment of further hydro-electric power resources in South West Tasmania, which has been coupled with a growing concern
about the cost of further hydro-electric development. Public concern over the construction of further dams has developed as a greater proportion of the State's hydro-electric resources are used up, resulting in new developments being forced into more inaccessible locations. These locations are mostly in wilderness areas. As more wilderness is threatened by power and other developments (such as Forestry programs) more Tasmanians have become aware of the significance of wilderness. The most recent debate over the building of the Lower Gordon Power Scheme has been intense and divisive. The intensity of debate has increased since the debate over the flooding of Lake Pedder to the point where this issue con-tributed to the fall of the Labor Government in 1982.
The debate over the construction of further dams has arisen as the unused proportion of the State's potential hydro capacity has been reduced. The state has now used about 657 of its potential hydro-generating capacity (Tasmania, Hydro-electric Commission 1979), and is facing a shortage of hydro-electric power. It is important to distinguish between hydro-electric energy and hydro-electric power in this context. The existing hydro-electric dams in Tasmania will continue to provide renewable energy for a considerable period. However, the amount of energy that can be generated in a year, that is the State's hydro-electric power resources, is limited by rainfall in the dam catchments. With 657 of the State's potential hydro power resources used up and increasing public opposition to the building of further dams, Tasmania is now facing a shortage of hydro
power.
This situation of hydro power shortage is in marked contrast to earlier views of Tasmania's power resources. In 1937 the Tasmanian Government regarded these resources as virtually,
if not actually, unlimited, as shown by the following quote from the section of Tasmania - Jewel of the Commonwealth on Hydro-electric Development.
The water power resources of the State are of such magnitude that complete utilisation by way of ord-inary commercial and domestic requirements is not possible of attainment, but there is no doubt that
this state with its cheap power will as the years pass, attract more industries which will bring in
While Tasmania may have been seen as a place with plentiful power resources in the past, now its power generation cap-acity is recognised as being quite small. The power demand of industries now being constructed elsewhere is much larger than Tasmania's generating capacity. For instance, new add-itions to mainland grids are the size of the whole Tasmanian grid. The Eraring power station in New South Wales is rated at more than 1 GW average, and the Loy Yang power station in Victoria is rated at about 2.5 GW average (Australia,
Depar-tment of Industry and Commerce 1981), whereas the whole Tasmanian hydro-grid, including the Pieman, is only rated at
1.087 GW average (Tasmania, Hydro-electric Commission 1979). During the 1970s the Tasmanian energy supply situation has undergone some significant changes. Oil prices have increas-ed dramatically and supplies have become more uncertain. Tasmania is facing power shortages in its major indigenous fuel, hydro-electricity. Both these developments have over-seas parallels but the Tasmanian situation is significantly different. Oil price increases have occurred later and the electricity situation has a number of unique elements. These changes are strikingly demonstrated by the comparison of the Tasmanian Government's view of the State's power situation
in 1937 with that existing today. Just as overseas develop-ments have prompted concern over the economic consequences of energy developments so in Tasmania it is necessary to investigate the economic effects of the changes in the energy supply situation that have occurred during the 1970s. Tasmanian manufacturing industry takes on a special
signif-icance with respect to Tasmania's changing energy situation. Tasmanian manufacturing uses nearly 407 of Tasmania's energy and over 60% of its electricity. Since Tasmanian manufact-uring is so heavily dependent on energy it provides a good
starting point for an examination of the effects of the above changes. Studies of the economic effects of energy use have usually looked at the relation between energy use and, growth and employment over a whole economy. Selecting out
the major energy user, manufacturing, means that a large number of other influences on employment or growth, apart from energy use, will have been eliminated by the exclusion of industries which are not significant energy users. This
CHAPTER 1 6 percent of electricity used by manufacturing is purchased under bulk contracts on a take or pay basis. The electricity consumed under these contracts is used 24 hours per day, 365 days per year. Thus energy consumption could not be in-creased very much without increasing power consumption. Thus, for Tasmanian manufacturing, changes in electrical
energy use are closely related to changes in electrical power use.
1.2 Employment
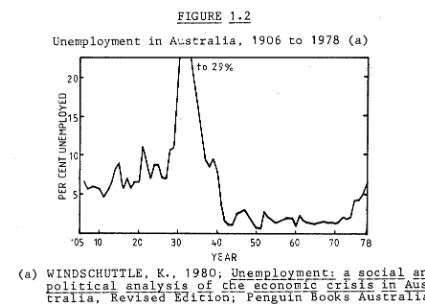
Unemployment has grown around the world over the 1970s. In a number of countries it has grown to its highest levels since the Great Depression. Australia has shared this world wide trend of increased unemployment. The graph of unemployment in Australia in Figure 1.2 shows that between 1942 and 1974, unemployment in Australia remained at its lowest level for
[image:12.559.44.469.333.637.2]this century. Prior to the Great Depression unemployment ranged between 57 and 107. However, by 1978 unemployment had once again risen to these pre-depression levels.
FIGURE 1.2
Unemployment in Australia, 1906 to 1978 (a)
'05 10 20 30 40 50 60 70 78
YEAR
(a) WINDSCHUTTLE, K., 1980; Unemployment: a social and Rolitical analysis of the economic crisis in Aus- tralia, Revised Edition; Penguin Books Australia, Ringwood, Victoria.
problem (Windschuttle 1980). The official statistics exclude people who have left the labour force because they are discouraged in their search for work. The survey used for measuring unemployment is designed to accurately sample the whole Australian population. So it may miss the unemployed because of their special characteristics, such as high mobility and poverty. Further, since these statistics cover broad regions they hide the local severity of unemployment, and since Tasmania often has the highest level of unemploy-ment, regional unemployment could be expected to be worse in Tasmania.
It is difficult to overstate the significance of having a job. Windschuttle (1980) has defined the role of employment in both a social and a personal sense. He argues that not only does work define
people's status, their incomes, [and] their personal identity [but,] ... in modern Australia the workplace is the central defining institution of society.
For a majority of people in Tasmania, as in most other societies, having a job is of overriding importance. The definition of unemployment used by the Australian Bureau of Statistics (ABS), a person seeking work in the four weeks prior to the survey (ABS 1982), implies that most, if not all, persons categorised as unemployed, have been excluded from work against their wishes. Further, this measure excludes people not covered by this definition but who still want a job, and this group may be as large as the 'official' unemployed (Windschuttle 1980).
The issue of employment has been tied to that of power development during the current debate over future power development. Many proponents of construction of the Gordon below Franklin dam have claimed that there is a vital link between employment and the provision of more energy. This link could exist on two levels. First, there is the emplOy-ment necessary for the construction of dams, estimates of which are included in the Hydro-electric Commission's Report on the Gordon River Power Development Stage II (Tas-mania, Hydro-electric Commission 1979). However, an analysis of this link by Davies, Jablonska and McCuaig (1981) shows
that the Hydro-electric Commission construction workforce has declined by over 1000 jobs between 1968-69 and 1977-78 and is characterised by an annual turnover rate of" up to 647 per annum.
CHAPTER 1 8
case, the claim relates to electricity in particular. Related to this claim is the common concern that if develop-ment is limited in order to preserve aspects of the envir-onment, for instance by the cessation of dam construction, the employment consequences will be disastrous. This second link will form part of the basis for the following analysis of the relation between energy use and employment in manu-facturing.
1.3 Output
Economic growth has traditionally been a major concern around the world. Especially in developed countries the rate of growth has provided an index of the health of the econ-omy. Economic growth has been seen as the basis for a wide range of social benefits, not the least of which is that, in a growing economy, it is not necessary for one person to be made worse off in order for another person's income to in-crease. Indeed it is possible for everyone's income to increase at the same time. Further, if increases in the workforce are not to result in unemployment, more jobs need to be created through economic growth. Hence any threats to the rate of economic growth have been seen as posing a threat to people's welfare, and possibly to social struct-ure. In this context any threat to energy supplies, has
traditionally been seen as limiting the rate of economic
-growth, with potentially dire consequences.
The above traditional view of economic growth has come under considerable criticism as being a shortsighted view of the wellbeing of either individuals or society as a whole. Economic growth has usually been measured as the rate of growth of gross national product (GNP). Using GNP as a measure of human wellbeing is overly materialistic. People rely on a certain level of material consumption, but to use GNP as the most important measure of human welfare denies all the other aspects of human existence. GNP is limited even as a measure of material wellbeing since it excludes such activities as unpaid domestic work and do it yourself activities. Further, because GNP is a monetary measure it does not provide an adequate valuation of either material or non-material items. For instance it does not distinguish between use value and exchange value, nor can it be expected to adequately value items beyond the market, such as wilder-ness. These criticisms of GNP as a measure of human welfare mean that it must be used with great caution. A simple equation between the rate of economic growth and the devel-opment of human wellbeing does not exist.
Given this caution GNP does provide a measure of a society's material welfare. It is therefore interesting to investigate
•the impact of changes in the energy situation that have
be most direct in those industries which are heavily depen-dent on energy. Therefore manufacturing is also a good starting point for analysis of the relation between energy use and output. The simplicity of the Tasmanian economy, compared to larger economies, means that Tasmanian manu-facturing is particularly interesting. Despite these two simplifying factors, the situation is complicated by Tas-manian economy's strong overseas connections and its status
as a peripheral economy (Wilde 1980), since outside forces may have a large impact on Tasmanian manufacturing. For instance, such influences as decisions made in interstate and overseas head offices, and Tasmanian firms competing on world markets, may have a stronger influence on Tasmanian employment and output levels than energy supply changes. In order to make an analysis of the relation between energy use and output with respect to manufacturing it is necessary
to select out its share of GNP. An industry's contribution to national output is defined as the amount it adds to the value of its products, that is value added. Value added is the difference between the value of sales by an industry and the value of its material inputs. If output was measured by simply summing the sales of all industries in the economy, the value of sales between industries would be double count-ed. Because inter-industry sales are used as the input for an industry, their value is included in the value of total sales by the purchasing industry. Thus, simply adding up the total sales of all industries overstates the economy's pro-duction. Using value added as a measure of an industry's output overcomes this problem because it is the value of sales of the industry less the value of materials used by that industry.
The result of the subtraction process used to derive value added is that value added consists of a mixed bundle of the various costs of production. It includes such items as depreciation, workers compensation insurance, other insur-ance, pay-roll tax, income tax, rates, advertising, interest on borrowed funds, bad debts, wages, salaries and profits (ABS annual a). Thus value added measures not only the con-tribution of a firm or industry to total production but also the economic return of an industry to Tasmanians and others in terms of wages, salaries and profits, amongst other items.
CHAPTER 1 10 unlikely that, in practice, the relation between inputs to the manufacturing process and output is as strong as this theory suggests. Nevertheless, the fact that producing out-put is the physical result of production means that outout-put must be considered not only by itself or in relation to the other parts of the production process, but also in looking at the relation between'other aspects of production. For instance, the role of output should be considered when analysing the relation between energy use and employment.
1.4 The Interaction of Energy Use, Employment and Output in the Manufacturing Process
Problems exist in relation to energy use, employment and economic growth. The problems in all three seem to have become worse during the 1970s all around the world. In Tasmania, the world wide influences have been added to by particular circumstances surrounding electricity supply. This thesis will investigate the interaction of energy use,
employment and output by looking at the effect that the changing energy supply situation has had on employment and output in Tasmania. While the changes occurring in energy supply over the 1970s have been spectacular, there are a number of different influences on output and employment. An integrated investigation of energy use, employment and out-put needs to be made in the light of these influences.
1.4.1 Structural Change
Western economies have shared trends of change in the struc-ture of employment over the 20th century. This changed structure has meant a declining proportion of employment in rural and manufacturing industries, which has been accompa-nied by increasing emphasis on employment in service
industries. However, more recently the proportional decline in rural and manufacturing employment has become an absolute decline.
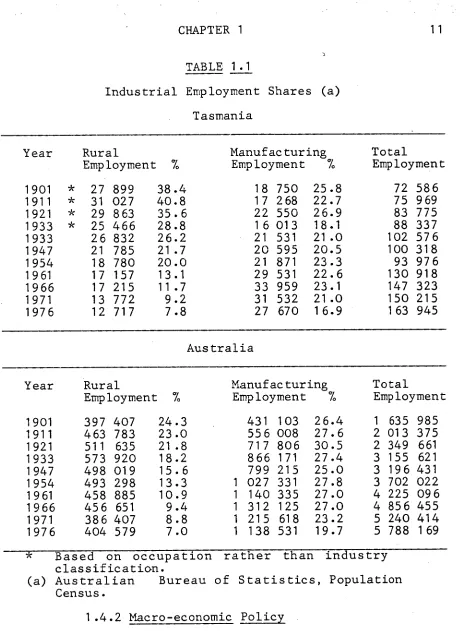
In Tasmania rural employment has declined from 387 of total employment in 1901 to 87 in 1976 according to the Population Census (Table 1.1). The share of employment by manufacturing has declined from 267 to 177 over the same period. While there have been times of high unemployment during this period of structural change (notably during the Great Dep-ression and recently) unemployment declined to its lowest level of the century between the early 1940s and early 1970s, despite the continuing structural change. However, the late 1970s have brought increased levels of unemployment (Figure 1.2). The decline of employment in rural and manu-facturing industries has not consistently led to high unemployment because of increased employment in service
TABLE 1.1
Industrial Employment Shares (a)
Tasmania
Year Rural
Employment %
Manufacturing Employment %
Total
Employment
1901 * 27 899 38.4 18 750 25.8 72 586
1911 * 31 027 40.8 17 268 22.7 75 969
1921 * 29 863 35.6 22 550 26.9 83 775
1933 * 25 466 28.8 16 013 18.1 88 337
1933 26 832 26.2 21 531 21.0 102 576
1947 21 785 21.7 20 595 20.5 100 318
1954 18 780 20.0 21 871 23.3 93 976
1961 17 157 13.1 29 531 22.6 130 918
1966 17 215 11.7 33 959 23.1 147 323
1971 13 772 9.2 31 532 21.0 150 215
1976 12 717 7.8 27 670 16.9 163 945
Australia
Year Rural
Employment %
Manufacturing Employment %
Total
Employment
1901 397 407 24.3 431 103 26.4 1 635 985
1911 463 783 23.0 556 008 27.6 2 013 375
1921 511 635 21.8 717 806 30.5 2 349 661
1933 573 920 18.2 866 171 27.4 3 155 621
1947 498 019 15.6 799 215 25.0 3 196 431
1954 493 298 13.3 1 027 331 27.8 3 702 022
1961 458 885 10.9 1 140 335 27.0 4 225 096
1966 456 651 9.4 1 312 125 27.0 4 856 455
1971 386 407 8.8 1 215 618 23.2 5 240 414
1976 404 579 7.0 1 138 531 19.7 5 788 169
* Based on occupation rather than industry classification.
(a) Australian Bureau of Statistics, Population Census.
1.4.2 Macro-economic Policy
[image:17.557.34.497.25.656.2]CHAPTER 1 12 We have therefore opted for a Budget which gives
priority to containing and reducing inflation and sustaining private sector growth.
Later in the Budget Speech, Mr. Howard stated that
The tighter policy framework which is now essential for containing inflationary pressures does of course carry some implications in the short term for activity and employment.
While the stated aims of the Fraser government are quite clear, it has not not been able to directly translate these aims into economic policy. During its period of office, the domestic budget deficit has mostly been around $2 billion, and the growth in the money supply has been 11% or more in all years except 1977-78 (Commonwealth Budget Statement No. 2 - The Budget and the Economy).
The Fraser Government's attack on inflation has only been partially successful. Over its period of offide inflation has been lower than it was prior to this, but it has not declined to the levels of the 1960s. Annual increases in the Consumer Price Index (excluding food and petrol) have not been lower than 7.67, and in the Implicit Price Deflator for Private Final Consumption Expenditure the increases have not been lower than 9%. While the Fraser Government's attempts to reduce inflation have not been very successful, its policies have been one of the factors contributing to a contractionary economic environment for Australian and Tas-manian manufacturing over the second half of the 1970s.
1.4.3 Labour Productivity
According to the Manufacturing Census, manufacturing employ-ment declined in absolute as well as relative terms over the
1970s, but this decline has not been matched by a decline in output by manufacturing industry (Table 1.2). In other words manufacturing output per job has been increasing. Output per job can only be increased by increasing the number of hours worked per job, or by increasing productivity per worker. The decline in average hours worked by males in Australian manufacturing from 44.1 hours per week in 1969 to 41.3 hours in 1980 (ABS annual c) implies that there has been an increase in labour productivity.
inanimate energy. However, it may be that the new machinery is more efficient in its use of both energy and labour. There is no reason to assume that more energy is used. For instance, machinery based on microelectronics may allow for reduction in the use of labour, materials and energy. The concept of technological change having a range of impacts on the use of labour and materials was developed by Hicks (1965). Technological changes may be described as 'Hicks neutral' if they do not affect the ratios in which the pro-cess uses labour and material inputs.
TABLE 1.2
Manufacturing Employment and Value Added Year Employment Value Added
'000 % 1978$M %
Change Change
Tasmania (a) 1969
1980
31.0
26.2 -15
422
508 +20 Australia (b)
1969 1980
1264.0
1154.2 -9
15 19
982
920 +25 (a) Australian Bureau of Statistics; Census of
Manu-facturing Establishments Details of Operations and small area statistics Tasmania, Catalogue No. 8202.6; Australian Bureau of Statistics, Tasmania. (b) Australian Bureau of Statistics; Manufacturing Establishments Details of Operations by Industry Class Australia, Catalogue No. 8203.0; Australian Bureau of Statistics, Canberra;
A number of authors have generalised from the overall trends in energy use and employment to suggest that technological change has consistently increased output per worker by
CHAPTER 1 14 changes in the ratio of energy use to employment to a wide variety of specific industrial processes.
Another view is represented by Grossman and Dandker (1977). This view is that industry has substituted energy use for human labour to increase labour productivity, which in turn has had the effect of reducing industry's demand for labour. While these authors do not provide a detailed analysis of the effect of technological change on the ratio of energy use to jobs either, their argument is not dependent on this level of detail since it relies on changes in the overall ratio, and does not generalise this to individual indust-rial processes, or predict future changes in the ratio.
The effect of technological change on various aspects of manufacturing processes, such as employment, is particularly complex, as even a brief examination of the Myers Report on Technological Change shows (Australia, Committee of Inquiry into Technological Change in Australia 1980). Without detailed consideration of the manufacturing processes involved, generalisations about the effect of technological change on the ratio between employment and energy use must remain generalisations. Even with the large amount of work that has been put into investigating the effect of tech-nological change on employment, it is not possible to make reliable generalisations about its effect in specific cir-cumstances. Thus, in view of the small amount of work that has so far been put into investigating the role of energy use in industry it will not be possible to go further than discussing the overall trends in the ratio of energy use to employment, in this thesis.
1.4.4 Integration of Energy Use, Emplo/ment and Output
The above discussion provides a brief description of the way that employment and output interact in the production pro-cess. This picture of their interaction has been developed over a considerable period. However the role of energy use in the production process is not so well understood because interest in investigating energy related matters has only developed recently. Some studies have been carried out that look at the interaction of energy use with other aspects of the production process over the whole economy (Berndt 1977; Darmstadter, Teitelbaum and Polach 1971; Darmstadter, Dunkerley and Alterman 1977; Fremont 1976; Hudson and Jorgenson 1978; Linden 1976; Starr and Field
1979; Winger 197E), but these studies do not investigate the detailed level of interaction.
combination of processes that constitute industrial struc-ture. The combination of processes will be much more impor-tant in industry than in households, for example, because of the much smaller range of energy uses by households.
One group of authors has investigated the relation of energy use to the production process at a more detailed level (Andrews 1979; Commoner 1976; Grossman and Daneker 1977). Commoner began the investigation by analysing the way that the three crises of energy, employment and the economy were related in the United States. He argued that solutions
to any one of the problems often appeared to aggravate the other problems, so that it was only by integrated study of all three that any acceptable solution could be found. Part of his investigation looked at the 'efficiency' with which various resources were used in the production process. Specifically he looked at the ratios of energy use, employ-ment and capital stock to output. He found that in the United States economy there has been a trend towards increasingly energy and capital intensive production, and away from labour intensive production. These trends made unemployment worse and contributed to increased dependence on energy and thus on foreign oil supplies.
Grossman and Daneker (1977) carried on from Commoner, and looked at the structure of energy use in the production process as a basis for developing an alternative strategy for industrial development. Both Grossman and Daneker, and Commoner, saw major problems with supply of the energy necessary for continuation of the past trends of industrial development. Further, they argued that continuation of these trends would only make problems with the economy and employ-ment worse. Their strategy involved the developemploy-ment of low energy intensity industries, supplied from renewable energy resources. Andrews (1979) has made a similar argument for Victoria. The unique features of Tasmania's energy supply situation and its industry mean that it is important to make a similar detailed analysis of energy use by Tasmanian manufacturing. This analysis should now be made to see how Tasmanian manufacturing energy use has been affected by the changes in energy supply over the 1970s, and how this relates to Tasmania's problems with growth and employment.
1.5 Conclusion
The aim of this thesis is to investigate the way that energy use interacts with employment and output. This investigation will be particularly concerned with the way that changes in • the energy supply situation have influenced manufacturing
employment and output over the 1970s. It will look at the response of Tasmanian manufacturing to these changes. While the changes in the energy supply situation over the 1970s have been particularly dramatic, there may not have been a
CHAPTER 1 16 be seen in the light of historical trends. While this analy-sis will concentrate on the response of manufacturing to the changes in energy supply, it will also shed some light on the potential policy freedom in Tasmania. For instance, it will show whether increased electricity supply has
effect-ively contributed to job creation in manufacturing industry over the 1970s.
This type of investigation into the interaction of energy use, employment and output has rarely been undertaken any-where in the world. It has never been attempted in Tasmania. This means that there is little precedent for undertaking a
study of this type. It also means that there is little suitable information on which to base a study of this type. Therefore a major part of this thesis is devoted to
1.6 References
1. ANDREWS, J., 1979; Jobs, energy and economic growth in Australia in Diesendorf, M. (ed.) Energy and People:
Social Implications of Different Energy Futures; Society for Social Responsibility in Science (ACT), Canberra.
2. AUSTRALIA, COMMITTEE OF INQUIRY INTO TECHNOLOGICAL
CHANGE IN AUSTRALIA, 1980; Technological Change in
Australia; Australian Government Publishing Service, Canberra.
3. AUSTRALIA, DEPARTMENT OF INDUSTRY AND COMMERCE, 1981;
Major Public and Private Infrastructure Projects; Depar-tment of Industry and Commerce, Canberra.
4. AUSTRALIAN BUREAU OF STATISTICS, 1982; Unemployment,
Australia, June 1982: Preliminary Estimates; Australian Bureau of Statistics, Canberra.
5. AUSTRALIAN BUREAU OF STATISTICS, annual a; Census of Manu-facturing Establishments, Details of operations and
small area statistics Tasmania, Catalogue No. 8202.6; Australian Bureau of Statistics, Canberra.
6. AUSTRALIAN BUREAU OF STATISTICS, annual b; The Labour
Force, Australia, Catalogue No. 6204.0; Australian Bureau of Statistics, Canberra.
7. AUSTRALIAN BUREAU OF STATISTICS, annual c; Earnings and Hours of Employees, Australia, Catalogue No. 6304.0; Australian Bureau of Statistics, Canberra.
8. BERNDT, E.R, 1977; Canadian energy demand and economic growth in Watkins, C. and Walker, M. (eds.) Oil in the Seventies: Essays on Energy Policy; Fraser Institute, Vancouver.
9. COMMONER, B, 1976; The Poverty of Power: Energy and the
Economic Crisis; Bantam Books, New York.
10. DARMSTADTER, J., TEITELBAUM, P.D. and POLACH, J.G., 1971; Energy in the World Economy a statistical review
of the trends in output, trade and consumption since
T725;
Resources -Tor the Future, Washington DC.11. DARMSTADTER, J., DUNKERLY, J. and ALTERMAN, J, 1977; How Industrial Societies Use Energy: a Comparative
Analysis; pa-lished for Resources for the Future by the
CHAPTER 1 18
12. DAVIES, R.J., JABLONSKA, K.A. and McCUAIG, M.A., 1981;
Emp_loy_ment and Energ_y Use: the effects of Hydro-industrialisation in Tasmania 1969:1979, Project Report 1980/3; Centre for Environmental Studies, University of
Tasmania, Hobart.
13. ECKSTEIN, A.J. and HEIEM, D.M, 1978; A Review of Energy
Models with Particular Reference to Employment and Man-power Ana-r-y-sis; Employment and Training Administration, Washington, D.C.
14. FREMONT, F, 1976; Electricity spurs jobs productivity,
Electrical World 186(12), 58-62.
15. GROSSMAN, R. and DANEKER, G., 1977; Jobs and Energy;
Environmentalists for Full Employment, Washington DC. 16. HICKS, J., 1965; Capital and Growth; Clarendon Press,
Oxford.
17. HUDSON, E.A. and JORGENSON, D.W., 1978; Energy prices
and the U.S. economy, 1972-1976, Natural Resources
Journal 18(4), 877-897.
18. LINDEN, H.R., 1976; Energy consumption and economic
wellbeing, Gas Engineering and Management 16(9), 309- 328.
19. MACLEAN, W.E., 1937; Hydro-electric Development,
Compre-hensive Scheme for Cheap Power Supply in Parker, C. (ed.) Tasmania, the Jewel of the Commonwealth; an illus-trated account of the island state of Tasmania, its natural resources and advantages, its activities and
enterprises, and the opportunities it affords, thanks to its wonderful hydro-electric system, for the establish-ment of secondary industries; Tasmanian Governestablish-ment, Hobart.
20. STARR, C. and FIELD, S., 1979; Economic growth,
employ-ment and energy, Energy Policy 7(1), 2-22.
21. TASMANIA, HYDRO-ELECTRIC COMMISSION, 1979; Report on the
Gordon River Power Development Stage Two; Hydro-electric Commission, Hobart.
22. UNITED STATES, ENERGY INFORMATION ADMINISTRATION, 1978;
Sector employment implications of alternative enerei scenarios; Energy InriTrmation Administration,
Washington, D.C.
23. UNITED STATES, FEDERAL ENERGY ADMINISTRATION, 1975;
24. UNITED STATES, GENERAL ACCOUNTING OFFICE, ENERGY AND MINERALS DIVISION, 1979; Analysis of the Energy and
Economic effects of the Iranian Oil Shortfall; General Accounting Office, Washington, D.C.
25. WILDE, P.D., 1980; Industrial Structure and Change in
Tasmania: Regional Development in a Peripheral Econom/,
Occasional Paper 7; Department of Geography, University of Tasmania, Hobart.
26. WINDSCHUTTLE, K, 1980; Unemployment: a social and
poli-tical analysis of the economic crisis in Australia,
Revised Edition; Penguin Books Australia, Ringwood, Victoria.
27. WINGER, J.G, 1976; The worldwide economic and social necessity of an adequate supply of energy, American Gas
CHAPTER 2 20
Chapter 2 - A Data Base for Manufacturing Energy Use, Employment and Output
Manufacturing industry is one of the better described sect-ors of the Australian economy. The Australian Bureau of Statistics' Manufacturing Census provides regular and com-prehensive information about manufacturing, including data on employment and value added. The Manufacturing Census also provides some data on energy use. Another source of inform-ation on manufacturing energy use is the Department of National Development and Energy (DNDE) survey of energy use. However, neither source of energy use data is particularly suitable for this integrated study. This chapter will des-cribe four aspects of the data: which information sources are available, the way that these have been developed for this study, the problems that exist with this data and the implications of these problems for the use of the data. Data for the three areas, energy use, employment and output, will be discussed separately, and since obtaining data on employ-ment and value added is more straighforward, these two will be discussed first, followed by a more detailed discussion of energy use.
The period covered by this study is largely determined by events occurring in relation to energy use. Manufacturing has been selected as the subject for the study and the major
source of information about manufacturing is the Manufactur-ing Census. This census underwent a major change in 1969 due to the ABS Integration Project, which was aimed at integrat-ing the ABS' collection of economic statistics. The effect of the Integration Project on the Manufacturing Census was to substantially change the basis for the collection, by introducing the the Australian Standard Industrial Class-ification (ASIC) (ABS 1979). This change makes it difficult to compare information on manufacturing collected before 1969 with that collected after 1969. However, this change-over date coincides with events occurring in the energy supply situation, giving three years of data prior to the 1973 oil embargo (no census was carried out in 1970-71). Thus the period covered by this study is between 1968-69 and
1979-80, the latest available Manufacturing Census.
One issue is particularly important in a study which looks at the relationship between three variables. It is the comparability of the data describing the variables. Measures •of employment can differ considerably. For example,
will largely be taken from one source, the Manufacturing Census, despite some problems with converting this data into a suitable form.
2.1 Employment .
Information on employment was taken from the Manufacturing Census for Tasmania and Australia. Manufacturing Census employment is the average for the year and is based on the following definition:
Working proprietors and employees on payroll, including those working at separately located administrative offices and ancilliary units.
Basically the measure shows the number of jobs provided by manufacturing industry. Use of this measure ignores the nature of the job, that is whether it is full time or part
time, filled by a male or a female, has high or low skill levels or where it is located. All these aspects of employ-ment are important, but the scope of this project has not allowed an analysis of the quality of jobs provided by Tasmanian manufacturing industry. It will concentrate on the number of jobs provided.
An analysis based on the number of jobs is important because of the personal and social significance of having a job, and because of the current levels of unemployment. Analysis of the number of jobs available, no matter what their quality, needs to be the starting point for analysis. In this respect the following analysis will differ from an economic analysis of the functioning of manufacturing industry, which would be more likely to investigate measures dealing with the input of labour to the production process. For example this would probably mean measuring labour input in terms of 'man-hours'.
2.2 Output
In this thesis output will be measured using value added. Value added provides a generalised measure of output which can be used across the wide range of manufacturing products. As mentioned in Chapter 1 value added is calculated as the difference between a firm's turnover (plus the change in net stocks) and its purchases of material inputs. Value Added data for this project has been taken from the Manufacturing Census.
CHAPTER 2 22 Tasmanian manufacturing value added. This is an Australia wide index and so it does not allow for regional differences in inflation. However, components of this index are avail-able which measure price changes for each subdivision as well as the manufacturing division, and so it has been possible to deflate value added for each of these separat-ely. This technique has provided a measure of real manufact-uring production in 1978 dollars.
2.3 Energy Use
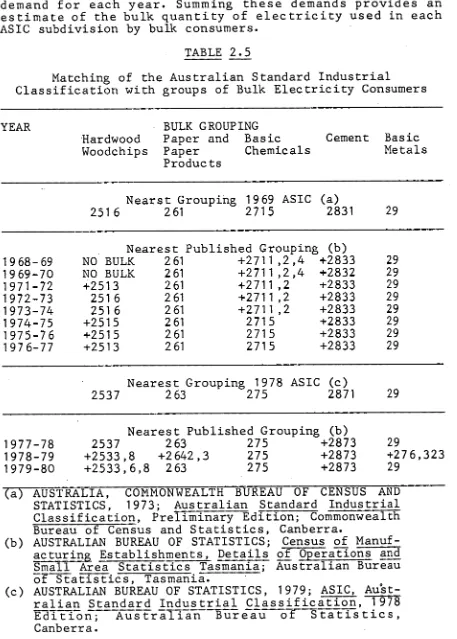
There are two sources of information about energy use by manufacturing industry: the Australian Bureau of Statistics Manufacturing Census (ABS annual a; ABS annual b) and the DNDE survey of industrial energy use (Australia, Department of National Development and Energy 1980). Both these sources cover manufacturing industry in Australia and Tasmania. They are both based on ASIC but the DNDE Survey has
con-tinued to use the 1969 edition rather than transferring to the 1978 edition. Both surveys provide information down to the subdivision or 2-digit level of the classification. (Appendix A provides a brief description of the manufactur-ing subdivisions of ASIC. Appendices B and C show the relevant tables of information from the DNDE Survey and the Manufacturing Census respectively.)
2.3.1 The Department of National Development and Energy Energy Use Survey
While the DNDE Survey has the advantage that it deals specifically with energy use by manufacturing industry in the energy units required by this study, this advantage is overridden by the following disadvantages. The Survey only provides reliable information from 1973-74 onwards. The survey was carried out in two years previous to this, 1971- 72 and 1972-73, but this information is regarded by the Department as less accurate (Ian Walker, Executive Officer, Forecasting and Modelling Section, DNDE, Personal Commun-ication). Electricity use data, from the Survey, is only provided back to 1976-77. The survey divides primary and secondary energy use separately. Practically, this means that electricity use cannnot simply be added to primary fuel use because some primary fuel use (that used for the generation of electricity) will be double counted. If
elec-tricity use by manufacturing firms is to be combined with their primary energy use an allowance must be made for self generation of electricity. The extent of self generation by firms is regarded as confidential by the DNDE, and the only estimates that can be made are by taking predicted propor-tions of purchased electricity to self generated elec-tricity (Australia, Department of National Development and Energy 1981) and applying these proportions to the
histor-ical electricity use for each subdivision.
problem with using the survey results for Tasmania. Confid-entiality precludes the Department publishing a large number of fuels separately for subdivisions. Also, energy use is published in petajoule units which do not provide sufficient detail for the level of energy use in Tasmanian industry. Changes in energy use in Tasmanian subdivisions are often not reflected by the 1/10th of a petajoule units which are
the minimum published from this survey.
The problem of comparability mentioned above exists with using energy use information from this survey. The only source of information about value added and employment in manufacturing industry is the Manufacturing Census, and this data is unlikely to be comparable with energy use data from the DNDE survey for the following reasons. First, the DNDE Survey has not changed to the 1978 edition of ASIC. Second, the Department gathers its information from a survey which covers 857 of primary fuel usage and 607 of electricity generated by public utilities (Australia, Department of National Development and Energy 1980). This subjects its results to sampling errors which are not present in the Manufacturing Census.
2.3.2 Manufacturing Census Energy Use Data
Energy use information from the Manufacturing Census, how-ever, has the advantage that it is comparable with value added and employment. Because it is a census its results are not subject to sampling errors. It covers a longer time span than the DNDE Survey. The Manufacturing Census has a greater level of detail than the DNDE Survey but it still has some problems with confidentiality arising mainly from the small number of firms in some subdivisions in Tasmania.
A disadvantage of using the Manufacturing Census is that fuel usage information is not collected in energy units. For most fuels this does not present a great problem since usage is given in quantity (for example tonnes), but for Electricity and the grouping of Mains Gas and Other Fuels only expenditure information is reported and there are diff-iculties in converting this expenditure information to energy units. There are some problems with obtaining a continuous series of data from the Manufacturing Census. Since 1976 the census excluded firms employing less than four employees. In 1978 the ASIC was changed with the main effect being that iron ore pelletising was moved from Div-ision C Manufacturing to DivDiv-ision B Mining. In Tasmania this meant the transfer of one firm, Savage River Mines. However, these two changes have not had a very large impact on the subdivision totals.
CHAPTER 2 24
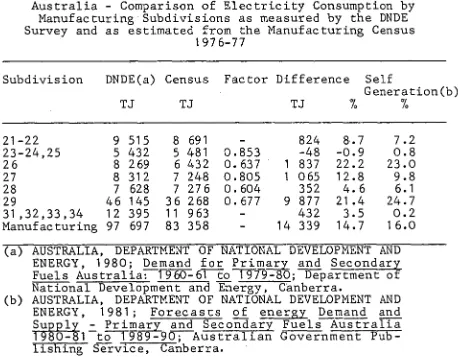
facturing Census. A comparison of the two sources shows that they often have different levels and different trends. In Table 2.1 the two sources are compared for manufacturing as a whole and for subdivision 29 Basic Metals as an example. It is beyond the scope of this study to investigate the reasons for this difference between the two sources of data,
TABLE 2.1
Comparison of Manufacturing Energy Use (excluding electricity) as measured by the DNDE Survey and as estimated from the Manufacturing Census
Year Manufacturing
Census DNDE(a)
PJ PJ
Diff. PJ
Subdivision 29 Census DNDE(a)
PJ PJ
Diff. PJ
1968-69 1969-70 1970-71 1971-72 1972-73
15.051 15.055
n.p. 15.287 15.709
n.p. n.p. n.p. n.p. n.p.
TASMANIA
n.p. n.p. n.p. n.p. n.p.
_ _ -
- -
- - - _
3.188 3.581
n.p. 3.453 3.362
1973-74 16.963 16.5 0.5 3.480 3.5 0.0
1974-75 15.536 16.0 0.5 2.629 2.9 0.3
1975-76 14.788 15.1 0.3 2.254 2.7 0.4
1976-77 14.797 16.4 1.6 2.605 2.9 0.3
1977-78 12.293 15.6 3.3 0.925 2.9 2.0
1978-79 12.286 16.9 4.6 n.p. 3.4 -
1979-80 16.017 17.4 1.4 1.317 3.7 2.4
AUSTRALIA
1968-69 650.1 n.p. 380.3 n.p.
1969-70 451.7 n.p. 179.2 n.p.
1970-71 n.p. n.p. n.p. n.p.
1971-72 386.9 725.5 338.6 128.2 350.1 221.9
1972-73 395.5 820.6 425.1 135.3 432.4 297.0
1973-74 425.7 864.0 438.2 158.9 424.1 265.1
1974-75 407.5 879.2 471.8 159.3 466.6 307.2
1975-76 417.5 865.2 447.7 176.0 436.1 260.2
1976-77 415.9 881.4 465.5 195.1 435.3 240.2
1977-78 368.0 879.9 511.9 177.0 431.7 254.7
1978-79 281.9 886.5 304.6 366.0 452.9 86.8
1979-80 389.1 894.9 505.8 195.4 446.8 251.5
n.p. - not published
(a) AUSTRALIA, DEPARTMENT OF NATIONAL DEVELOPMENT AND
ENERGY, 1980; Demand for Primary and Secondary
but the difference does underline the difficulty of obtain-ing reliable data on energy use generally in Australia.
Using the Manufacturing Census as the basis for energy use data means that considerable effort must be put into con-verting the Census information into an appropriate form. This conversion is particularly difficult for electricity and gas. The following sections provide a description of the method used to convert the published information on each fuel into the appropriate energy use data for this thesis.
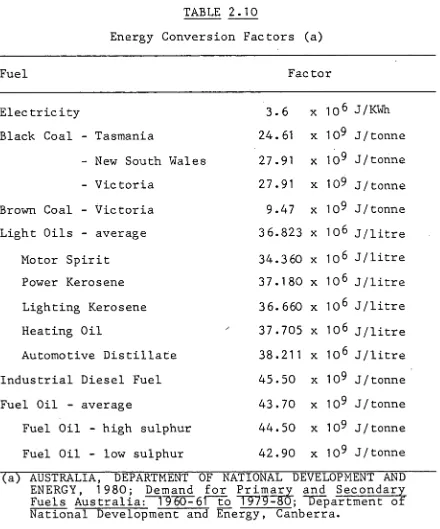
2.3.3 Electricity
Only expenditure on electricity is published in the Manu-facturing Census (see Appendix C). Converting this money value into an energy quantity is difficult. In principle it is only necessary to divide the value of expenditure by a price to obtain a quantity. However, sales of electricity to manufacturing industry are characterised by secret contracts for large electricity users. Prices on these contracts are not publicly available and are usually substantially lower than published tariffs for other electricity users. Thus while it is necessary to rely on the basic approach of dividing value by price to obtain quantity, more sophisti-cation is necessary if accurate results are to be obtained. Due to the complexity of Australian manufacturing, it has been necessary to take a slightly different approach to estimating electricity use in Tasmania and Australia. The method used for Tasmania is discussed first.
a) Tasmania
The Centre for Environmental Studies has already published estimates of industrial electricity use up to 1974-75 for each Tasmanian manufacturing subdivision in its Working Paper No. 9 Growth and Development of Tasmania's Energy S/stem (Hartley, Jones and Badcock 1979.) The method the authors used to estimate electrical energy use is described in their Appendix B.
CHAPTER 2 26 published by the Electricity Supply Association of Australia
(ESAA) in Statistics of the Electricity Supply Industry in Australia, and then dividing the resulting general value by
the general quantity. Expenditure by the remaining sub-divisions was divided by this average general price to estimate general consumption. Bulk and general consumption were then added to give total manufacturing electricity consumption.
The problem with this approach was that the estimated bulk quantity was becoming increasingly different from the amount of bulk sales published by the HEC after 1974-75, the latest year of Hartley, Jones and Badcock's published data. An
estimate of the difference is shown in Table 2.2. HEC bulk sales are made to mining as well as manufacturing firms, so an allowance must be made for mining electricity use. Hartley, Jones and Badcock assume that 30% of mining
elec-tricity expenditure is made under bulk contracts, allowing the calculation of a mining bulk quantity by dividing this expenditure by the bulk price.
The resulting difference between the estimated total bulk sales and actual bulk sales shows that bulk electricity consumption was underestimated, and that the error nearly doubled in 1975-76. The error is the result of poor matching of bulk consumers with the electricity expenditures pub-lished in the Manufacturing Census, and of the variation in contract prices between bulk users. Thus it has become necessary to develop a different method of estimating the bulk usage of electricity.
The method used to estimate bulk electricity consumption in this thesis is based on the contract power demand of each bulk user. A table of the contract demand for each bulk user between 1968-69 and 1979-80 has been compiled from
informa-tion published in H. Raggat (1969), HEC (1978) and HEC (1979), together with information about expansion programs by major companies published in the Tasmanian Year Book (Table 2.3). Each bulk consumer has been classified to its appropriate ASIC subdivision, thus providing an estimate of the contract demand of each ASIC subdivision.
TABLE 2.2
Estimated Bulk Electricity Usage based on Hartley, Jones and Badcock (1979) (a), compared with HEC Bulk
Electricity Sales
Bulk Electricity Expenditure estimated from the Mining and Manufacturing Censuses
Year Bulk Expenditure Total
Subdivisions(b) Mining(c) Value
26,27,28,29 Total 2 x 0.3 1+3
$'000 $'000 $'000 $'000
1 2 3 4
Estimated Quantity
4/8 GWh
5
1974-75 21 753 3372 1012 22 765 3545.950
1975-76 22 028 3858 1157 23 185 3326.399
1976-77 26 23 -6 4283 1285 27 393 3880.028
1977-78 n.p. 5341 1 602
1978-79 n.p. 6322 1897
1979-80 36 034 6547 1964 37 998 4773.618
HEC Bulk Sales(d) Price Estimated Difference
Value Quantity 6/7 from 5 7-9
$'000 GWh c/KWh GWh GWh TJ
6 7 8 9 10 11
1974-75 23 382 3639.745 0.642 3545.950 96.0 345.6 1975-76 24 380 3496.551 0.697 3326.399 170.2 612.7 1976-77 28 814 4079.014 0.706 3880.028 199.0 716.4
1977-78 31 899 4298.296 0.742
1978-79 38 172 4713.013 0.810
1979-80 37 944 4765.119 0.796 4773.618 -8.5 30.6
n.p. - At least one subdivision was not published from the Manufacturing Census in this year.
(a) HARTLEY, M.J., JONES, R. and BADCOCK, R.L., 1978;
Growth and Development of Tasmania's energy system:
a statistical analysis of supply and demand 1 950-
1975 , Environmental Studies Working Paper 9; Board of EnvironmentalStudies, University of Tasmania, Hobart.
(b) AUSTRALIA BUREAU OF STATISTICS; Census of Manu-facturing Establishments, Details of Operations and
Small Area Statistics Tasmania; Australian Bureau of Statisitics, Tasmania.
(c) AUSTRALIAN BUREAU OF STATISTICS; Mining Tasmania;
Australian Bureau of Statistics, Tasmania.
CHA
P
TER
2
090'gZ4g 9GO'GOCG 9G2'192g 9g0'2444 919'2491 , 960'9200 9609200 9609204 005'6292 220'1g42 9106492 91G'4292 dA3
SI3VHINO3 1V191. STUD 6599222 244'9882 HAO 124'2992 4220G42 4064442 200242 G44'6292 1406404 154'9642 2102144 962'0624 61r9m,
rina 0311 49480 49800 04100 61160 0900 04060 4226'0 49260 10g60 06160 69800 29640 HO10V1 2699404 0206944 0209240 9140424 915'9402 9660202 9669202 9668202 904'2492 006'56G2 492'4642 494'2442
HAD 1V01 ONINALOVJONVW
92.200g 922'525 922'52g OVI'222 001461 001'461 001'46I 001461 001'461 Zgo'ggi 250g5T Zg0'gg1 RAO MAIO
1013T. Aw 0'0 0'0 0'0 0'0 NO ø0 00 00 00 9'62 9'02 9'02 960202 960200 960202 0000 000 . 0 0000 0000 0000 0000 0000 0000 000 . 0 HAD
OATH 39VAVS 04 0'4 0'4 0'6 O'f 0'4 00 00 00 00
O't
0'4
AO HAD Oftrg2 040W 060'52 040*G2 040'52 040'52 060'52 040*G2 08004 00004 00004 00002. NODINAH Aw 5'g g'g G•g g'g g'G g'5 4•5 g'g 5•5 g•g 5•5 0'4
02219 OOT'04 001'00 091'8t 00104 001•80 00T'8P 081'04 031'04 001'96 00I'00 OUT'OV HAD
11311 IWO AW 2'5 Z'g Z'G 001 001 001 O'OI O'OT O'OI 0'01 0'01 001 0092.0 02 00940 02 00940 02 00940 0'2 00940 0•2 00948 0• 2 009•1d 02 009•49 02 009"40 02 Egg'51, 02 Zgg'gt 0•2 2g4,
30 02
HAD AR103S011
'2'1 AW
002'92 002'92 002'92 002'92 002'92 002"92 002'92 082'92 082'92 002'92 09292 082'92 HAD 31101113AV 244'14.GC 20 -1442 2g94252 0061602 002.'0042 004'0042 804'0042 004092.2
940*G052 940g9g2 940•gbg2 940'gOGZ dAD 62
1V101 AN g'2.2 g'42 6'42 5•42 5'42 5'42 442 11'42 524 5'24 424 g'24 001'529 001'529 001'529 001'529 006'0 n 00601,2 006002 008-'042 006002 00601 , 2 006'0 n 006'0 n OW
00W31 AW 9'42 9•42 91'2 91'2 912 99'e 942 912 912 0•0 00 00 0000 000'0 0000 960202 960202 960202 960'202 960202 960'202 960202 96roe 960'202 HAD uniu
30311V0 MO 0'50 O'g0 0'43 010 2'06 . 2'96 , 2'06 2'06 2'06 2'06 2•86 2'06 222'090 222099 222'090 222090 222'099 222'098 -zevo9e 222'090 009144 009404 009404 009104 HAD LUVOOH
'2'1 AW 004I O'OPI 006T watt 0001 O'OPI 0941 0014 0001 0'222 0422 01.22 021• 9402 021'9402 022'2202 0009621 0049621 0049621 0049621 0049621 0049621 0049621 0049621 01.109621 HAD 001)1400 00940 00940 00940 00940 00940 00940 00940 00940 00948 00940 00940 004'69 1119 02
7'1101 MO 51. 001 O'OI 001 001 0'01 001 O'OI O'OI 001 0•01 001 0091.0 0091.0 00940 0091.0 0091.0 0091.0 0091.0 0091.0 0091.0 00913 00940 004'69 HAD 111V1100 090'291 004'821 004'02T 251'221 251. 22I 229. 5TI 229g11 ZE9'511 229•911 229'5I1 22951T 229511 HAO 42
111101 AW O'C 02 02 02 02 ve 02 O'g O•G O'G • O•g O'g
imEret 4'21
e0a.
et, 0-01 00024 wen 00924 2'01 00924 Z'OT 002'92 Z'OT 002'92 Z'OI 08V9Z Z'OT 099Z Z'OT 002'92 Vol 002.
92 . 2'01
002'92 2'01 dAD 3813011 MW
092'811 00946 00916 0260 252'60 2g2'60 2g2'69 2g2•60 2g2'60 2g2'60 2g2"60 2g2'60 HAO 3(11)0V3 VNOH10311 961'026 946140 9461'10 249100 2491.00 249400 249109 249400 2491.00 249'409 950904 9g0104 HAD 92
1V101 AW g"2 g"2 g•2 5•2 g•2 5•2 4'2 2 5• 42 g.c g•e g'2 01)902 09902 099'02 09902 09902 09902 099702 099•02 099'0C 099112 09902 09902 HMO
W.14 All 925 9'2g 9'2g 9•25 9•25 9'2G 9•2G 9•24 9•24 0"81 005 O'OG • 00000g 000001 0001005 944'094 944090 944094 944091 944091' 94409P 944'094 944094 944094 HAD
NAV AA 41 g'I l'21 21 • I'CI 1'21 I•cl 1'21 1'21 121 121 1•21 952.1II 9G441I •G4111 9g41II 9g4111 9g4111 9541II 954411 9S411I 9g2.1II 041'21 041'21 HAD 31V11 I31S314
:WddV AW 012 0'22 0•22 0'22 CZ O• 0•22- 022 012 0'22 012 012 5•22 004402 090102 004102 004102 006102 0134102 08r102 034102 000102 0E0102 094102 084102 HAD 311411011 :WddV 4021.11 492'411 402411 402411 002411 4021.I1 402111 '4021.11 02494 0001) 0001) 0001) dAD 52
1V101 MO 00 013 010 2"g C*5 2'5 2'5 2'g 2"g 2'G C'g 2'5 021 0 90 02494 024130 02494 024134 82494 02494 024'90 824'94 0000 poro acwo HAD
Hddi AN 01) 01) 013 WO 92 9•2 9•2 2 9• 2 9• 9•2 9'2 9•2
924-12 92G'12 92g-12 925'I2 92512 92412 92412 925'12 00011 0000 0001) 0001) 014,
Sd1HDHOOM AMMON MO 00 00 00 0•0 41 , VI vf 41 g't G't 41 g'1' 020'62 020'62 02462 02462 02462 02462 02462 0241)2 0000 0000 00013 0000 HAD 113V311 31401 :14d3) LL6I 0461
Z461 2461 g461 02.61 6461 0061 1461
0461 9461
6961
0621803 SONVW19 1.011011403
'0861.
oa
6961. 'yTurusuq, LIT slouiluo0 )1Ing aaptin premaa
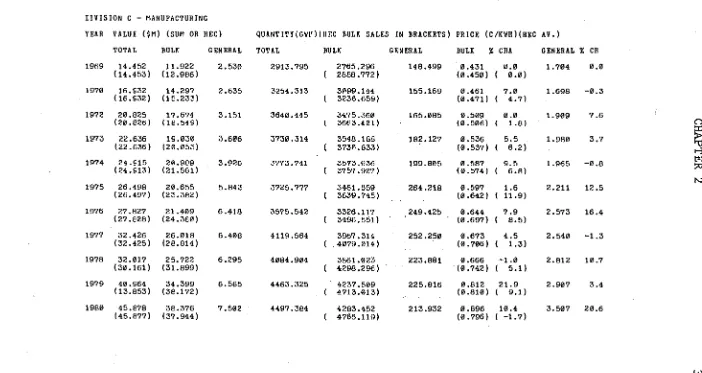
Electricity Consumption by Tasmanian Manufacturing and Tasmanian
SUBDIVISION YEAR VALUE
TOTAL
Manufacturing Subdivisions, 21-22
($M) QUANTITY (GWH) BULK ' GENERAL TOTAL BULK
1969 to
GENERAL
1980.
PRICE BULK
(C/KWH)
% CEA GENERAL % CH 1969 1.035 0.000 1.035 60.750 0.000 60.750 0.000 0.0 1.704 0.0 1970 1.092 0.000 1.092 64.305 0.000 64.305 0.000 0.0 1.698 -0.3 1972 1.276 0.000 1.376 ' 72.090 0.000 72.090 0.000 • 0.0 1.909 7.6 1973 1.512 0.000 1;512 76.266 0.000 76.366 0.000 0.0 1.980 3.7 1974 1.681 0.000 1.681 85.551 0.000 85.551 0.000 0.0 1.965 -0.8 1975 2.000 0.000 2.000 90.439 0.000 90.439 0.000 0.0 2.211 12.5 1976 2.632 0.000 2.632 102.288 0.000 102.288 0.000 0.0 2.573 16.4 1977 2.981 0.000 2.981 117.347 0.000 117.347 0.000 0.0 2.540 -1.3 1978 3.009 0.000 3.009 107.015 0.000 107.015 0.000 0.0 2.812 10.7 1979 3.554 0.000 3.554 122.247 0.000 122.247 0.000 0.0 2.907 3.4 1980 3.747 0.000 3.747 106.852 0.000 106.852 0.000 0.0 3.507 20.6 SUBDIVISION
YEAR VALUE TOTAL
23 ($M)
BULK GENERAL
QUANTITY TOTAL
(GWH)
BULK GENERAL
PRICE BULK
(C/KWB)
% CNA GENERAL % CH 1969 0.202 0.000 0.302 17.726 0.000 17.726 0.000 0.0 1.704 0.0 1970 0.224 0.000 0.324 19.080 0.000 19.080 0.000 0.0 1.698 -0.3 1972 0.359 0.000 0.359 18.802 0.000 18.808 0.000 0.0 1.909 7.6 1973 0.405 0.000 0.405 20.455 0.000 20.455 0.000 0.0 1.980 3.7 1974 0.421 0.000 0.421 21.426 0.000 21.426 0.000 0.0 1.965 -0.8 1975 0.289 0.000 0.389 17.590 0.000 17.590 0.000 0.0 2.211 12.5 1976 0.497 0.000 0.497 19.315 0.000 19.315 0.000 0.0 2.573 16.4 1977 0.513 0.000 0.513 20.194 0.000 20.194 0.000 0.0 2.540 -1.3 1978 0.502 0.000 0.502 17.854 0.000 17.854 0.000 0.0 2.812 10.7 1979 0.540 0.000 0.540 18.574 0.000 18.574 0.000 0.0 2.907 3.4 1980 0-512 0.000 0.512 14.601 0.000 14.601 0.000 0.0 3.507 20.6 SUBDIVISION 24
YEAR VALUE (iM) QUANTITY (GWH) PRICE (C/KWH)
TOTAL BULK GENERAL TOTAL BULK GENERAL BULK % CHA GENERAL % CH 1969 0.011 0.000 0.011 0.646 0.000 0.646 0.000 0.0 1.704 0.0 1970 0.012 0.000 0.012 0.707 0.000 0.707 0.000 0.0 1.698 -0.3 1972 0.013 0.000 0.013 0.681 0.000 0.681 0.000 0.0 1.909 7.6 1973 0.016 0.000 0.016 0.808 0.000 0.808 0.000 0.0 1.980 3.7 1974 0.021 0.000 0.021 1.069 0.000 1.069 0.000 0.0 1.965 -0.8 1975 0.017 0.000 0.017 0.769 0.000 0.769 0.000 0.0 2.211 12.5 1976 0.018 0.000 0.018 0.700 0.000 0.700 0.000 0.0 2.573 16.4 1977 0.019 0.000 0.019 0.748 0.000 0.748 0.000 0.0 2.540 -1.3 1978 0.017 0.000 0.017 0.605 0.000 0.605 0.000 0.0 2.812 10.7 1979 0.017 0.000 0.017 0.585 0.000 0.585 0.000 0.0 2.907 3.4 1980 0.018 0.000 0.018 0.513 0.000 0.513 0.000 0.0 3.507 20.6
Z
IIS
Ic