OF TITANIUM (III)
by
frekult
John F. Ashton B. Sc. (Hons.)
Submitted in fulfilment of the requirements
for the
Degree of Master of Science
UNIVERSITY OF TASMANIA
HOBART
Original manuscript August,
1973
4eii)
Abstract
In this investigation a combination of physico—chemical techniques namely potentiometric, conductometric and spectrophotometric methods have been used to study several aspects of the chemistry of titanium(III) in aqueous solutions. The results obtained have provided new information about the hydrolysis of the hexaquotitanium(III) ion and complex formation in titanium(III) thiocyanate and sulphate solutions.
It is shown that the hydrolysis of hexaquotitanium(III) ion
•in chloride solutions takes place in two stages. At low pH values primary hydrolysis occurs as given by the equation
Ti(H 2 0) 63+ + OH k .4- i(OH)(H 2 0) 5 2+ (1)
At slightly higher pH values secondary hydrolysis occurs as given by the equation
Ti(OH)(H 2 0) 5 2+ + 20H— ,--- Ti(OH) 3 (s) (2)
Both the primary and secondary hydrolysis products dimerise on standing forming hydroxy—bridged and oxy—bridged species respectively. Under certain conditions the secondary hydrolysis products oxidise with the evolution of hydrogen to form 1:1 mixed oxidation state species. The rate of evolution of hydrogen is dependent on the hydroxide ion
concentration. The pH range over which the respective hydrolysis reactions occur depends on the total chloride ion concentration.
Titanium(III) forms two complexes in aqueous thiocyanate solutions; a,1:1 cationic species Ti(NCS)(H- 2 0) 5 and a 1:4 anionic 2+ species Ti(NCS) 4 (H 2 0) 2 — . A 1:1 titanium(III):titanium(IV) mixed
oxidation state species is formed during the oxidation of titanium(III) thiocyanate solutions.
2 Ti(H20)6 3+
Ti2(504)(H20)10
Ti(SO4)2(H 0)4 —
2— 4+ (3)
(4)
(5) + SO
(S(3 4)(H0)
42 210
— 4+
+3504 Ti(502 4)2(H20)4 —
+ 25042 — ,;----Ti(SO4)4(H20)25—
The latter 1:4 complex persists in sulphate solutions up to about
4 molar and at higher concentrations forms polymers. At very high
sulphuric acid concentrations i.e. about 15-18 molar, these polymers
collapse to form the anhydrous species Ti(HSO4)(504). The relatively
stable pale violet 1:2 tetrahydrate can be crystallised from solution
and readily converted to the anhydrous form.
Ti(HSO4)(504)(H20)4 pale violet
Vac. 98°C , moist air
Ti(HSO4)(504) pale blue
Hydroxy sulphate species are formed during the hydrolysis of the above
complexes and mixed oxidation state titanium(III) titanium(IV) species
are formed when solutions containing the above complexes are allowed to
oxidise in air.
Where possible, stability constants are estimated for the
complexes formed in each system.
From this new information together with existing data for
other systems, trends in the co—ordination behaviour for titanium(III)
are discussed.
In each of the systems studied titanium mixed oxidation state
species were detected during the oxidation of titanium(III) complexes.
Following from this the mixed valence chemistry of titanium has been
reviewed and the significance of this type of behaviour in understanding
To the best of my knowledge, this thesis contains no
material which has been accepted for the award of any other degree
or diploma in any university and contains no copy or paraphrase of
material previously published or written by another person, except
where due reference is made in the text.
to the only God, our Savior through
Jesus Christ our Lord, be glory, majesty,
dominion, and authority, before all time
and now and for ever. Amen.
AEKNOWLEDGMENTS
Many thanks are extended to Dr. P.W. Smith for his superivision
and interest in this work.
The author also wishes to express his appreciation to the
following:—
The teaching and technical staff of the Chemistry Department
for their help during this work.
Mr. M. Ashton, for assisting with the kinetic runs.
Mrs. J. Roberts, for typing this thesis.
Mrs. H. Hen, for copying the diagrams for this thesis.
The author also acknowledges the award of an Australian Titan
Page
Chapter 1. Introduction 1
Chapter 2. The hydrolysis of titanium(III) in aqueous
chloride media.
Chapter 3. Titanium(III) thiocyanate complexes in 42
aqueous media.
Chapter 4. Titanium(III) sulphate complexes formed in 56
aqueous solutions.
Chapter. 5. Some aspects of the solution chemistry of 93
titanium(III).
Appendices 99
CHAPTER I
Introduction
In the industrial processing of titanium compounds, titanium is almost always present as titanium(IV). Many processes involve reactions in solution and studies have been made of complexes formed in aqueous titanium(IV) systems. Titanium(IV) can be easily reduced to titanium(III) in aqueous solution. Consequently the use of titanium(III) compounds as alternative intermediates in industrial processes seems feasible. However, by comparison with titanium(IV), much less is known about titanium(III) complexes. For example, it is surprising that only limited studies of the hydrolysis of titanium(III) have been made and the exact nature of
titanium(III) hydroxide precipitates has not been investigated in detail. As well, there appears to be very little information available on the nature of the titanium(III) species present in sulphate solutions.
The relatively limited extent of studies of titanium(III) systems may reflect the problems associated with titanium(III) being a reducing agent. Titanium(III) in aqueous solution is a mild reducing agent.
2+ + —
3+
1TiO ,+ 2E + e kaq) \ Ti(ag) 1120
0 .
0.1 volt This aerial oxidation of titanium(III) solutions is significantly retarded in strong acid solutions 2-4 and acidic solutions of titanium(III) salts are quite stable in an inert atmosphere e.g., under nitrogen.In very dilute hydrochloric acid solutions titanium(II1) exists
5-7 — —
as the hexaquo [Ti(H 2 0) 5 3 i i on . When ligands such as OH F Cl — ,
2— 2—
'
3— complexing
' CN 9 NCS
SO4 9 C 2 0 4 PO4 and / organic ions are added to solutions containing the hexaquo ion, complexes of the type [TiL
detail the hydrolysis of the hexaquotitanium(III) ion in chloride
solutions and to study the nature of the titanium(III) complexes formed
in aqueous thiocyanate and sulphate solutions. The results obtained
have enabled complex formation in these systems to be understood. Trends
in the co—ordination behaviour of titanium(III) have become more apparent
and attention has been drawn to the significance of mixed valence
3
CHAPTER 2
The hydrolysis of titanium (III) in aaueous chloride media
2.1 Introduction
One detailed study of the hydrolysis of the hexaquotitanium (III)
ion in dilute solutions has been reported
20
. However the results presented
did not take into account dimerisation reactions which are very common in
hydrolytic equilibria. More recent studies in 1968 and 1970 of the
hydrolysis reaction
21
'
22
showed that dimerisation does occur but data are
reported only for concentrated halide solutions (ionic strength
3
molar).
All the results in the above three studies were based on potentiometric
measurements. In additions, the studies were limited in detail to primary
hydrolysis behaviour, i.e., the formation of soluble 1:1 Ti (III) : OH
species. No detailed studies of secondary hydrolysis behaviour involving
the formation of titanium (III) hydroxide precipitates, have been reported.
A preliminary investigation of the system showed that both
spectrophotometric and pH measurements were time dependent. In an attempt
to understand this behaviour and relate it to the overall hydrolysis picture
measurements were made
(a)
as soon as possible after the addition of base and vigorous
mixing,
b)
after the solutions had equilibrated and measurements were stable
These are referred to as "initial" and "equilibrated" solutions respectively
in this chapter.
It was also noted that hydrogen evolution occurred in the presence
of some insoluble species. This behaviour was investigated in a separate
. kinetic study.
In this chapter, results of a new investigation of both the
in dilute solutions and the solubility product of insoluble titanium(III) hydroxide are reported for the first time. The nature of the insoluble species is discussed and a new explanation for the formation of these different coloured precipitates,is presented with supporting evidence. Also a mixed oxidation state hydrolysis species has been discovered. The results obtained include potentiometric, analytical and spectral data as a function of pH, chloride ion concentration and time, for the hydrolysis system.
2.2 Experimental
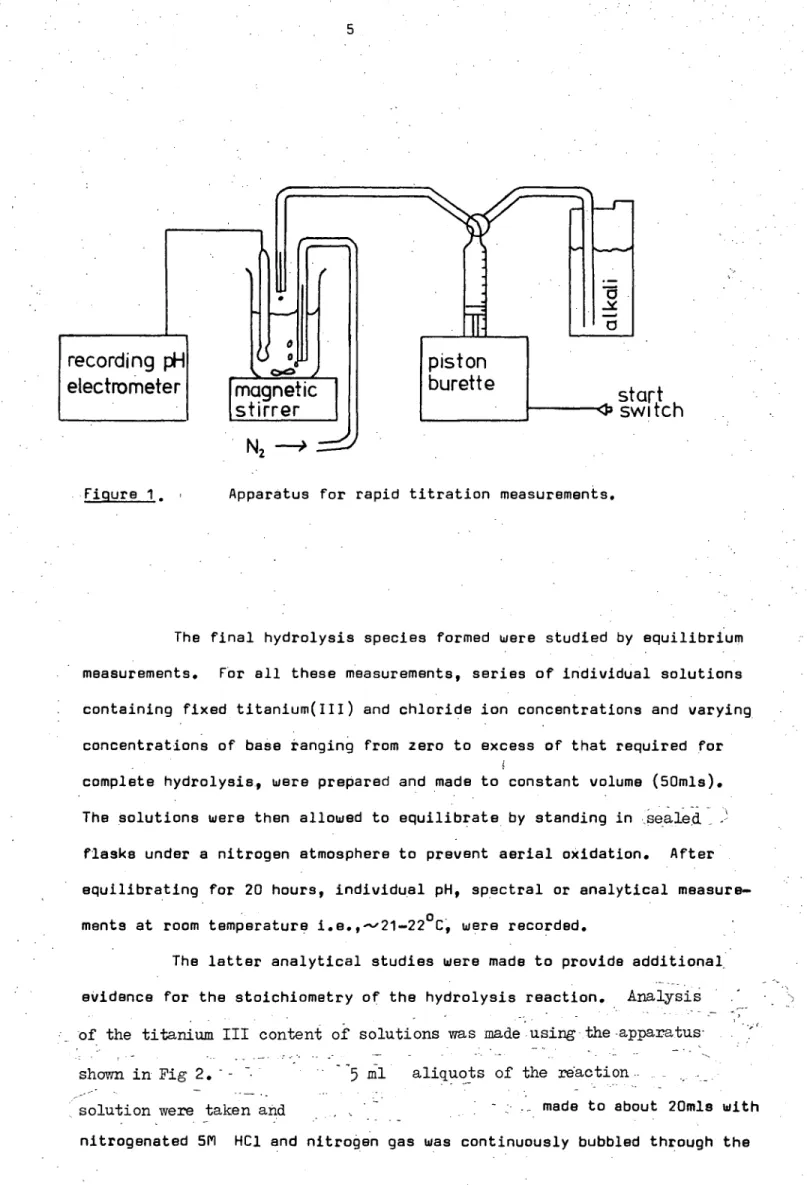
Rapid potentiometric titrations were used to study the species first formed. Fast stirring was used to ensure rapid mixing of the reactants, total titration time being usually less than 4 minutes.* The apparatus for rapid titration measurements is shown in Figure 1. It
consisted of a combined pH electrode coupled to a recording pH electrometer s
' together
- with a motor driven 20m1 piston burette calibrated to0.01m1. Solutions of titanium(III) in dilute hydrochloric acid (see
Appendix 1) were titrated with sodium hydroxide. During the titration the solutions were stirred and nitrogen bubbled through rapidly to prevent aerial oxidation.
The total chloride ion concentration was varied by
_ "--- -
_
NH4C1.:Ammonium salts have minimal ageing effects on glass electrodes: -
ancl,etable. -
high chloride ion concentrations to be obtained. Consequently solutions high in chloride ion concentration were alsotitrated with ammonium hydroxide.
Spectroscopic studies were made (see also Appendix 2) to obtain more information about the nature of the hydrolysis species present in solution. The spectra of the initial species present were obtained from solutions where a fixed aliquot of titanium(III) solution was added to prepared solutions containing known amounts of base. These solutions were then transferred after shaking, to glass cells and their absorbance
-Y
•
•• • • • • .= • • •
recording pH
electrometer
(5
0r
-Crg
magnetic
stirrer
N2 —0 -
piston
burette
start
<13
switch
Figure 1. , Apparatus for rapid titration measurements.
The final hydrolysis species formed were studied by equilibrium
measurements. For all these measurements, series of individual solutions
containing fixed titanium(III) and chloride ion concentrations and varying
concentrations of base ranging from zero to excess of that required for
complete hydrolysis, were prepared and made to constant volume (50m1s).
The solutions were then allowed to equilibrate by standing in
sealed_
flasks under a nitrogen atmosphere to prevent aerial oxidation. After
equilibrating for 20 hours, individual pH, spectral or analytical
measure-ments at room temperature i.e.,-,,21-22°C, were recorded.
The latter analytical studies were made to provide additional •
evidence for the stoichiometry of the hydrolysis reaction.
Analysis
of the titanium III content of solutions was made using the apparatus -
shown in Fig 2. - - T
----
,solution were taken and
5
Mi
aliquots of the reaction_
made to about 20mls with
perspex
top
stoppered
funnel
(for adding
sample)
N2
y
Magnetic
stirrer
250m1
pyrex
beaker,..-4
Figure 2. Apparatus for titanium(III) analyses'
solution during the titration. A 10% NH 4 SCN solution (5m1s) was added as indicator and the solution titrated immediately with nitrogenated 0.020M NH
4Fe(S04)2 solution. Chloride ion determinations were made by Volhard's method, titanium(III) being oxidised to titanium(IV) with nitric acid
titrating beforehand, or by estimating• the total TiC1
3 and HC]. concentrations '10Y / to pH 7.0 with
/ standard sodium hydroxide solution.
high pressures) and a mercury manometer. Both manometers were connected to a glass stoppered conical flask. The apparatus was immersed in a water bath thermostated to 30.0oC, and the solution being studied was stirred magnetically from
'below-
The rate of evolution of hydrogen Was followed by measuring the change in pressure (i.e. the change in height of the manometers) with time. The apparatus was initially flushed withnitrogen (by bubbling through the manometers). The volume . of the apparatus was determined by water displacement.
2.3 Results
Figure 3 shows the typical pH behaviour observed during rapid titrations of titanium(III) in dilute chloride media. In region (a) primary hydrolysis occurs resulting in the formation of a soluble 1:1 Ti(III):0H -complex. In region (b) the uptake of another two equivalents of OH— occurs, corresponding to the formation of Ti(OH) 3 (brown precipitate). Similar titration curves were obtained over the chloride ion concentration range 0.4 to 4.5 M (see also Appendix 3). Equilibrium potentiometric titration. data for individual solutions containing varying amounts of beware shown in Figure 4 (see also Appendix 4). A 1:1 complex is still formed in the
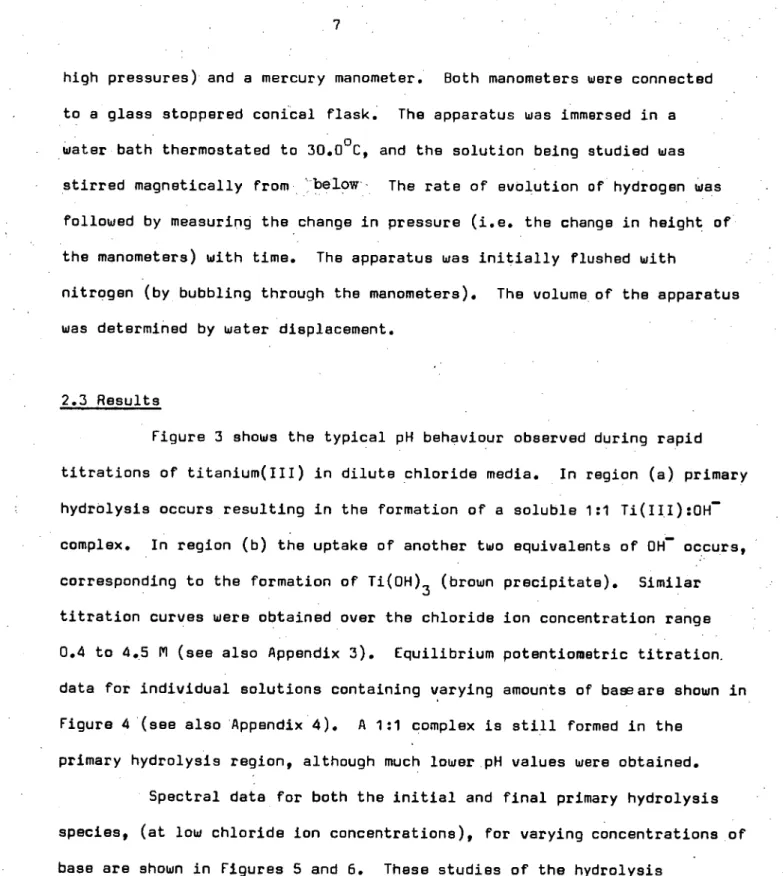
primary hydrolysis region, although much lower pH values were obtained. Spectral data for both the initial and final primary hydrolysis species, (at low chloride ion concentrations), for varying concentrations of base are shown in Figures 5 and 6. These studies of the hydrolysis
behaviour show that in non—equilibrated solutions where measurements were made immediately after mixing, the intensity of absorption increases with increasing concentration of base and the position of maximum absorption shifts from 495 nm towards 480nm. On standing (to give equilibrated solutions) the intensity of absorption in each solution increases further but there is no change in the position of the peak. From individual
5.0
4.0
pH
3.0
2.0
region (b)
region (a)
0.0 1.0 2.0 3.0
Figure 3. Rapid pH titration curve for 0.113M titanium(III) (80 mls) with 1.97M NaOH.
5.0
4.0
3.0
1.0 pH
2.0
0.0 1.0 2.0 3.0
A
bsor
ba
nce
10
400 440 480 520 560 600 640 Wavelength (n m)
Figure 5. Spectra of initial ( ) and equilibrated
(- -) solutions of titanium(III) where Tf = 0.00 (•),
0.31 (A), 0.50 (CI ), using 1 cm cells. [Ti(III)] = 0.0892M. [C1] = 0.334M.
fraction of titanium(III) which has undergone hydrolysis, the extinction coefficients of the primary hydrolysis species present in the initial and equilibrated solutions were calculated (see Appendix 5) to be
—1
11
400 500 600 700 800 900
Wavelength (nm)
Figure 6. Spectrum of equilibrated titanium(III) solution where
71 =
0.64, using 1 cm cells. [ Ti(III) =.0.0950M„ [C1]= 0.364M.400 500 600 700 Wavelength (nm)
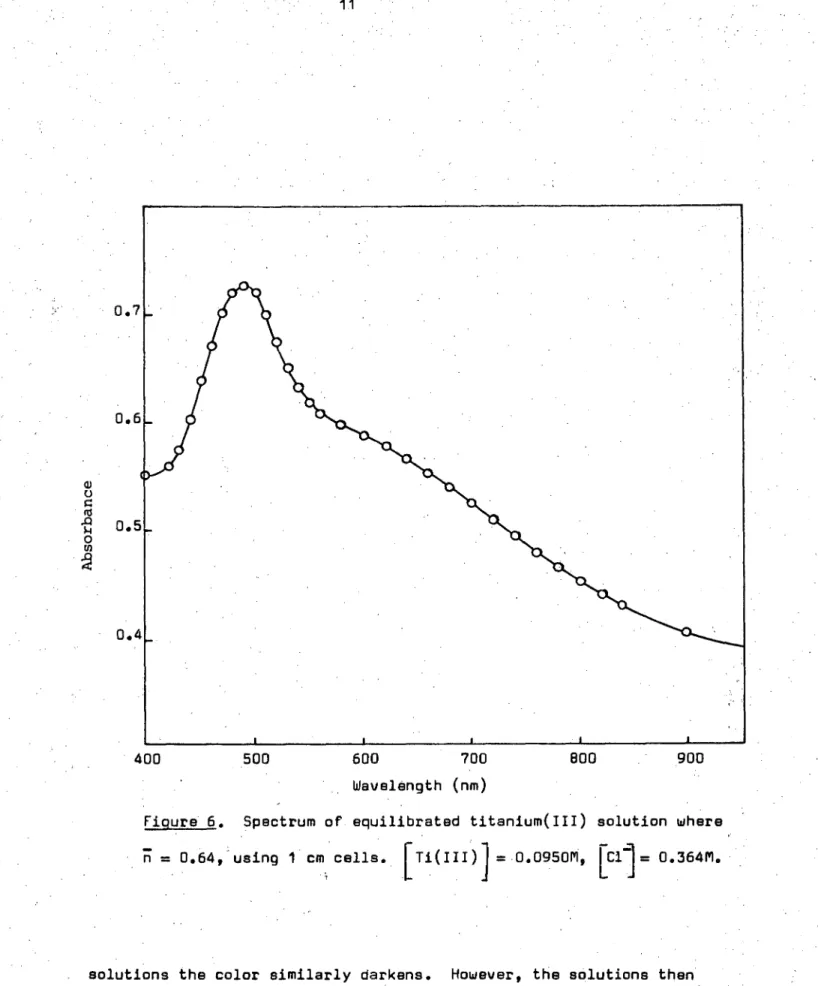
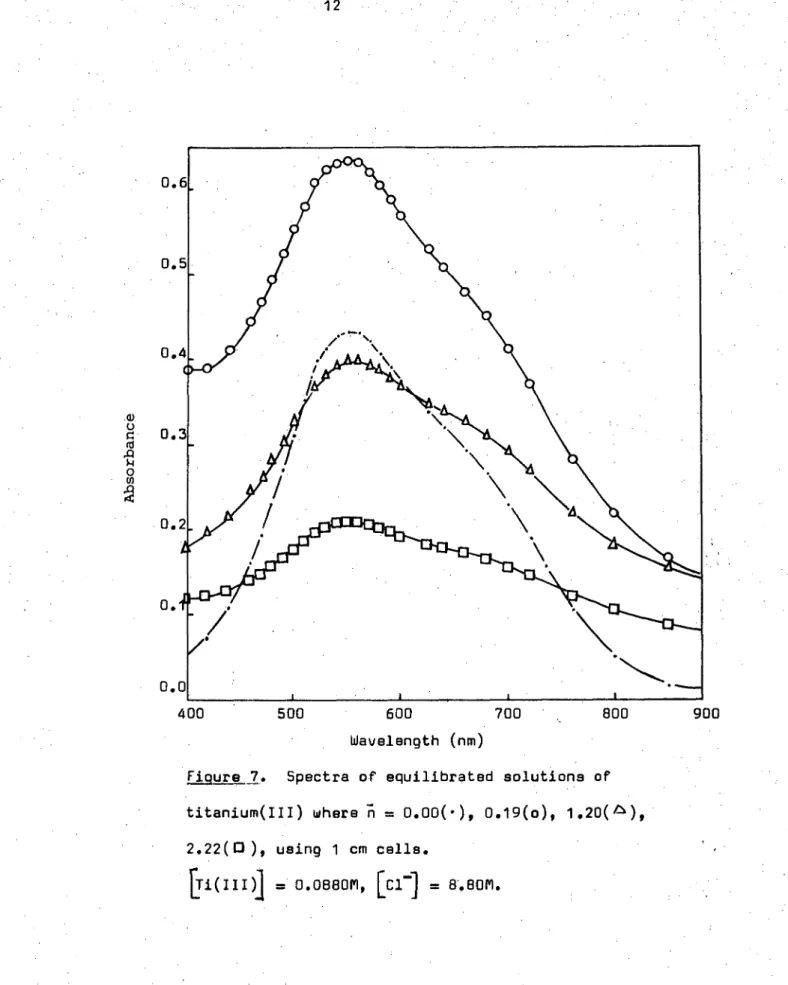
Figure 7. Spectra of equilibrated solutions of titanium(III) where n = 0.00(.), 0.19(o), 1 •20(A), 2.22(0), using 1 cm cells.
= 0.0880M, [C1 -] = 8.8011.
more completely, leaving minimal turbidity in the supernatant solution. Solution spectra for these solutions containing varying amounts of base are shown in Figure 7. No change in the position of maximum absorbance
(550 nm) was observed showing that the initial titanium(III) species in solution remains unchanged. i.e. There was no evidence of primary hydrolysis occuring. The variation of the absorbance of individual
0.6
0.5
0.4
0.1
0.0
13
0.0 1.0 2.0 3.0
Figure 6. Absorbance at 550 nm) of equilibrated solutions of titanium(III)
solutions at 550 nm, as base is added is shown in Figure 8 No change in
absorbance is observed until precipitation occurs. Then the value jumps
sharply due to an increase in absorbance caused by scattering of the light
by some colloidal particles of the precipitate remaining suspended in the
solution. However, overall the absorbance decreased uniformly towards
zero as the - ratio of hydroxyl ions added tended towards 3. This latter
observation being confirmed by the analytical work.
The results of analytical studies of the variation of the
titanium(III) content of equilibrated solutions during hydrolysis in dilute
chloride media are shown in Figure 9. The titanium(III) content remains
constant until precipitation •begins at
R =
1.0. After this titanium(III)is removed from solution at the rate of 1.00 Ti per 2.00 OH — added, by the
formation of brown Ti(OH)
3 precipitate (region (a) in Figure 9) until
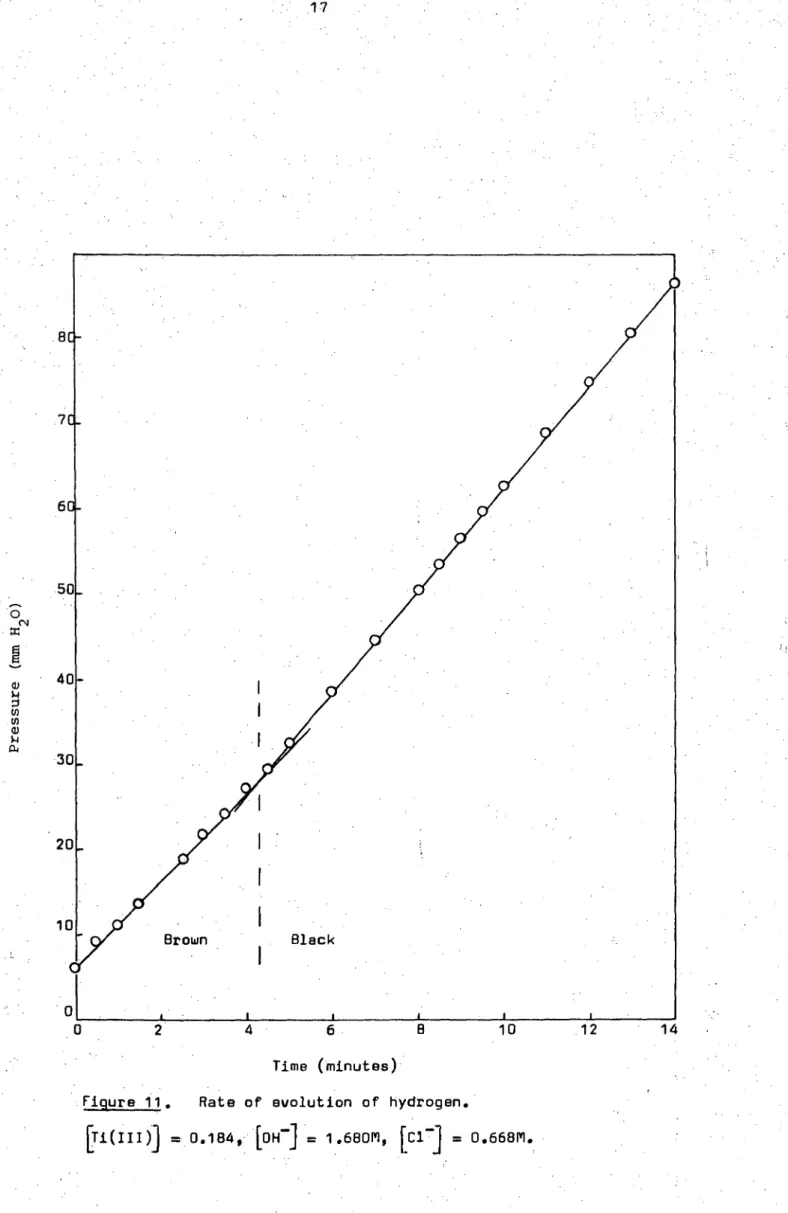
On standing the brown precipitate initially formed darkens
becoming black but no hydrogen evolution is observed in these solutions. In
region (b) there appears to be no increase in the amount of black
precipitate present. Instead, on standing, hydrogen evolution is observed
and a dark blue solution forms. Also the titanium(III) content of the
solution decreases at the rate of 1.00 Ti removed per 4.00 OH — added, in
this region. When an aliquot of the dark blue solution is added to 5.5M
HC1 solution, a white turbidity forms indicating the presence of titanium(IV).
In region (c) the dark blue species coagulates and settles on the bottOm,
and the rate of removal at titanium is again 1.00 Ti per 2.00 OH — added. At
high chloride ion concentrations a different analytical curve is obtained.
The variation of the titanium(III) conterit of these equilibrated solutions
is shown in Figure 10. A dark blue precipitate settles in the hydrolysed
solutions. Hydrogen evolution is also observed. The slope of the curve
shows that the titanium(III) is removed uniformly from solution at the rate
of 1.00 Ti per 3.00 OH — added. This confirms the earlier spectrophotometric
result.
Percentage of titanium(III) in solution
.WZG E*0 =
cont ent of e qui l ib rat ed s ol ut i o ns
31 NJ • 0
0
—0--
0.0 1.0 2.0 3.0
Figure 10. Titanium(III) content of equilibrated solutions during hydrolysis in concentrated chloride media.
= 0.0880M, [C17] = 8.80M.
Pres
su
re
CNJ
17
4 10 12 14
Time (minutes)
Figure 11. Rate of evolution of hydrogen.
- 120
- 100
1
200 400 600
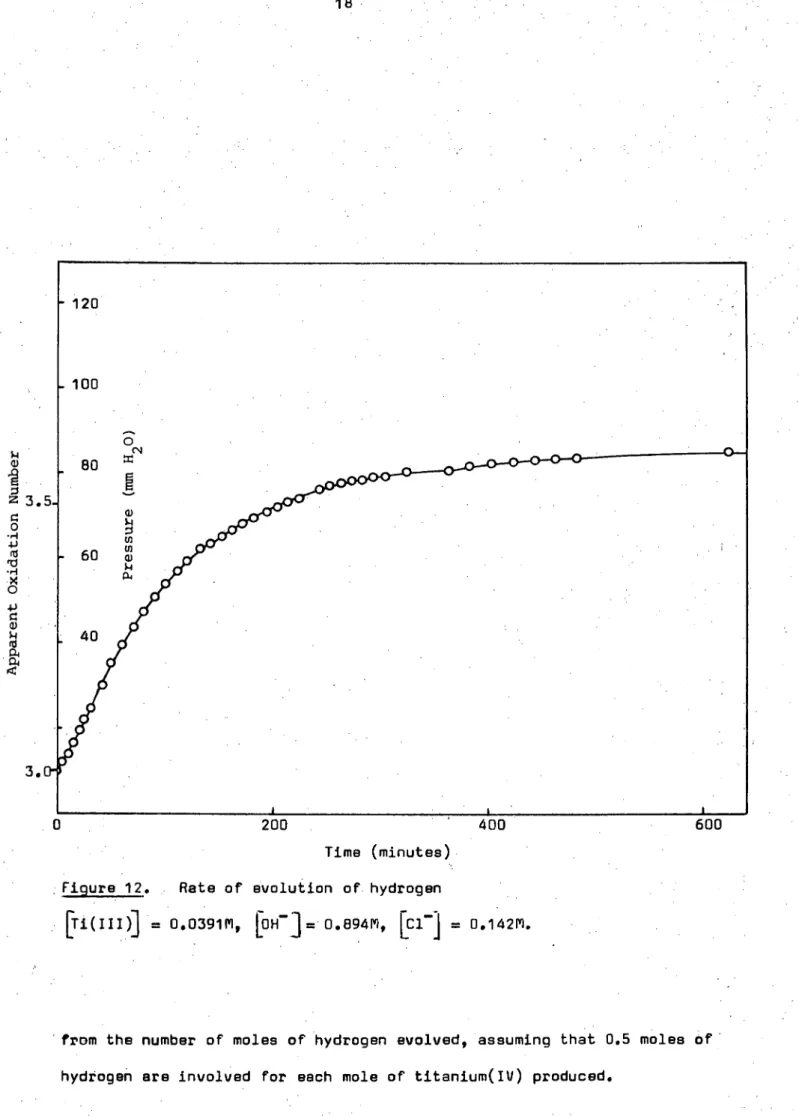
Time (minutes)
Figure 12. Rate of evolution of hydrogen
= 0.039111, LOH-3= 0.894F1 9 [01] = 0.14211.
isque48uo3 °lea opneed eq4 e4enTe1e ol epew set 4dwe44e ou squeweanseew esey4 6uT1np lue4suo3 4ou sem 446uea4s oTuoT ey4.esne3eg olue4suo3 e4ea aepao •puz opnesd 844 sT Z >1 easym
[_ 0][III)
T1]
( 4P
uoT4enbe eyq Aq uenT6 sT e4e4TdTpead moeTq eq4 Jo eouesead eq4 UT suoT4nTos woaJ uoT4nTone ue6oapAy Jo e4ea eta •vt,),u easym suoT4nTos UT penaesqo eq pTnom uoT4nTone ueboapAy ou ley4 uTe6e 6uTw1TJuo3 $ V1, = u "e'T WOZ .0 4e e4ea oaez ane6 uoT4eTodealxe
'osTe uoTpeea sTy4 aoj .Sseq Jo uoT4eaqueouoo eql o4 TeuoTlaodoad ST ean6Tj UT umoys ST uoT43esa puooes 844 Jo e4ea 844 uo eseq Jo 43elJe Gnu .4ue4suo3 e4ea aepao goz opnesd eq4 sT eaaym
413
( 0
—
, 0] [(III)Til L >I = Z(
-
OP
uoT4enbe ay4 Aq ueA16 sT uoT4nTone ue6oapAy Jo e4ea eq4 ATTeTll'uT sn41 L. edoTs Jo BUTT 40Tea4s e senT6 ean 5 T3)
uoT4ealueoup3 SOT ensaan e4ea Sot Jo goid e 4 e4ea oaez 4e uoT4eaqueouoo eseq aoJ 6uT43eaaoo ae44v = u o4 dn penaesOo sT uoT4nTolui — -ue6oapAy ou 4844 suoT4en1esqo 38
xTpueddv 888) g■ L = u o4 spuodseaaoo 4 3 Thm WOZ°0 enTen eq4 senT6 egea oaez o4 peleTodea4xe usym yoTym peuTe4qo sT enano 14400ws ç ean6Tj
UT umoys sT 6 e4e4Tdpe1d umoaq ey4 Jo eouesead eq4 UT "e'T ATIRT4TuT su0T4nT0e WOJJ U0TVITOA8 ue6oapAy Jo e4ea eq4 uo eseq Jo 43840 eqi o8u0T43esa (nog 104 UOTq8.14U83UO3 (III) ,wnTue4T4 ol 43edse1 1.44 -cm aepao
ATqeqoad sT yomm ee eq 219.40 ANeToeadde lou pinoys 4uesead (III )wnTuelT4 Jo lunowe 8(44 UOT4388.1 eq4 UT p8ATOAUT eae (sele4TdT3ead) se -coeds (III )wnTue 4T4 PTTos EmuTS .ATenTloedsea selelTdToGad moevi eq4•
pue umoaq eq4 ao4 'uoT4nTone ue60apAi4 "e0T uoT4epTxo—one Jo elea egg, ol puodseaaoo su0T4oes aeeuTT TeT4TuT om4 eq4 Jo sadoTs eq
e4ea ey4 eseo sTy4 uT
0
CD
ft
cn
04
(ITT) pue sTsAToapAH Aaepuooes (TT) sTsAToapAH AaewTad (T) isuoTloes
c
uT moTeq pessnosTp eao4eaey4 sT (III )wnTue4T4 4o sTsAToapAti eta .ueboapAg
4o uoT4nTone eq buTATonuT suoTpeea uoTlep1xo—o4ne aeg41n4 o6aepun
6suompuoo uTe4ae3 aepun 4se4e4TdT3ead ese(44 uomppe uT •sTsAToapAy
Aaepuooes se o4 peaae4ea gpeppe sT eseq aeLpan4 uegm se4e4Tdpead epTxoapAti
wnTuelT4
Jo
uoTlewaoj ay (TT) faTsAToapAti AaewTad se o4 OBJJ8J8.16peppe sae eseq JO 84unowe 'Hews ATuo ueHm SeToeds AxoapAil wnTue4T4
aTqnTos jo uoTleWao4 eyi (T) •se6e4s om4 uT eoeTd sele4 (III)wnTue4T4
4o
sTsAToapAy e04 4E44 umogs eney s4Tnsea enOqe etauoTssn38TO 074
• '107E£70 = 6W046070 = [(HI) 11]
.uoT43eea TeT4TuT 30J uoT4ea4ue3uo3 uoT 9pTxoap4
uoT4nTone ue6oapAy JO 8483 JO uoT4eTaeA 'EL ean5 TJ
W11
7
1
0.4
0.0
—0.6
21
0.4 1.0 1.4 2.0
log OH — ‘concentration arbitrary units (see appendix 6)
Figuse 14.
2.4.1 Primary Hydrolysis
Evidence for the primary hydrolysis reactions has been obtained from pH, spectrophotometric and analytical data.
The pH titration curves Figures (3) and (4) show the formation of a soluble 1:1, Ti:OH — complex. The lower pH values obtained for
equilibrated solutions as compared with those obtained on rapid mixing could be caused by the following phenomena.
(i) An oxidation type reaction
(ii) Slow completion of the hydrolysis reaction
2
1
Ra
te
o
f Hy
drog
en
e
vo
lu
t
io
n
0
0.42 0.84 1.26 1.70
[OH— ] M
Figure 15. Variation of rate of hydrogen evolution with hydroxide ion concentration for second reaction
[Ti(III)] = 0.0920M, [c1] = 0.334M.
No evidence of oxidation was observed in the primary hydrolysis region. This was confirmed by the analytical data which showed that the titanium(III) content remained unchanged (Figure 9). The possibility of the reaction having not reached completion is also eliminated because the shift in the peak position from 495 nm towards 480 nm (Figure 5) is observed immediately after mixing. The only change in the spectrum on standing is a slight increase in absorbance. This type of behaviour has been observed for other transition metals 23 and it is well known that dimeric species are
23
Schaffer and Jorgensen in their work on binuclear complexes 26 of chromium(III) suggest that the spectra of complexes with central atoms coupled by two hydroxy-bridges - do not differ greatly from the spectra of mononuclear complexes. The presence of oxygen bridges, however, has been • found to influence the spectra quite considerably.
For the titanium(III) solutions, since the dimerisation-is accompanied by only a slight increase in band intensity, this suggests the formation of a hydroxy bridged species (i.e. 1i 2 (OH)2(H 2 ) 84+) rather than
4+, an oxy bridged species (i.e. Ti
20(H20)10 ).
The potentiometric, spectrophotometric and analytical studies thus suggest that the primary hydrolysis of titanium(III) in dilute
chloride solutions involves the formation initially of a monomeric species Ti(H 2 0) 83+ +01-(- ====ATi(OH)(H 2 0) 52+ -(3) followed by dimerisation
2Ti(OH)(H 2 0) 52+ Ti(H 2 0) 4 (OH) 2 Ti(H2 0) 44+ +2H 2 0 -(4) This is in agreement with the conclusions reached by previous workers from limited studies in 3 molar halide solutions 21'22
Similar behaviour has been observed in the vanadium(III) system. Pajdowski23 showed by a spectrophotometric study that the primary hydrolysis involved the formation of both monomeric WOH)(H 2 0) 8 and dimeric 2+
V 2 (OH) 2 (H 2 0) 84+. The latter species has the higher extinction coefficient. A subsequent magnetic study of the vanadium(III) hydrolysis strongly supported the presence of hydroxy bridges in the dimeric species27. Similar behaviour also occurs in the aluminium(III) system as recent 27A1 NMR.studies by
Akitt et a128 of the hydrolysis and polymerisation of the A1(H2 0) 6 '
3+-cation .
have shown the positive existence of A1(H20) 83+ - 1, Al(OH)(H 2 0) 52+, and dimeric Al
2 (OH)2 (H-2 0)8 4+
.
•
The hydrolysis constant/3.i for the monomeric species was evaluated using the method outlined below. •
24
=
+
2 6 Ti(OH)0 2 0) 5
2+ +H
[Ti(OH)(H 2 0) 5 2-1[H+]
[Ti(1+2 0) 631 .
is a stable Complex, then If Ti(OH)(H
—
where n represents the ratio of hydroxyl ion added to titanium(III) ion initially present.
i.e. log (3i = log ) pH -(8)
Using equation (8) and the potentiometric titration data, the constant for the primary hydrolysis of Ti(H 2 0) 63+ was calculated at six equally spaced points in the region 0 4 75(1 (region (a) in Figure 3) to be log/?1 = —2.89 + 0.20 and —2.91 + 0.20 on duplicate runs (see Appendix 3). The standard — deviation of 0.20 was due to (i) experimental errors associated with very rapid titrations and pH measurements, and (ii) competition from the
25
Table 1
Comparison of log/5
1 values for the primary
hydrolysis in dilute solutions of metals of
the first transition series.
Metal logp i Ionic Strength Temperature
Scandium(III) -4.9 0.1 20
*
Titanium(III) -2.9 0.4 22
Vanadium(III) -2.9 1.0 20
Chromium(III) -4.3 0.5 20
Iron(III) -2.6 0.1 20-22
Cobalt(III) -1.8 1.0 24
*This work.
Some workers report stability constants i.e. log Kl values, for the hydrolysis species. However this is less practical as it requires • knowing accurately the pKw value for the solution under the hydrolysis
conditions. For the reaction Ti(H20)6 +0H-,,====1Ti(OH)(H3+ 20)52+
[Ti(OH)(H20)5
[Ti(H20)63 10H-]
and log Kl = pKw + log/31 -(11)
30 From published data 29 pK
w was calculated to be 14.38 in 0.41M NaCl', at 22 ° C (see Appendix 8). • Thus, from equation (11) log K 1 equals 11.48 + 0.20
at 22oC. •
The extent of dimerisationcan be gauged from the change of pH with time. An example of this is shown in Figure 16. The curve implies that for this solution approximately 25% dimerisation has occurred after 20 minutes. The hydrolysis data reported by Pecsok and Fletcher 20 -
—(g)
pH 2.8
2.6
2.4
20 40 60
Time (minutes)
80 100
Figure 16. Change of pH with time for a solution17 = 0.64
[Ti(III)] = 0.07811 , [C1 —] = 0.411.
were obtained from measurements made over a period of 20-30 minutes. Obviously significant dimerisation would have occurred during this time. This would explain the higher K l values which they report (e. g. log K l = 11.80 in 0.50 KBr at 25 0 C).
As the chloride ion concentration was increased up to 511 no significant change in the shape of the rapid titration curve was observed (see Appendix 3). Using the theory outlined by equations (5) to (8), log i4 values were calculated (see Appendix 3) at these higher chloride ion
27
--6.0
-8.0
-2.0
logpi
-3.0
1.0 2.0
aiglre'..17. Effect of chloride ion concentration on the
primary and secondary hydrolysis constants (I = total chloride ion concentration).
constant Values for the monohydroxy species increase with increasing
chloride ion concentrations as z result of the increasing ionic strength.
Thus the behaviour appears to obey simple Oebye—Huckel theory, since under
-these conditions activity coefficients also increase with increasing ionic
strength.
This behaviour also suggests that titanium(III) chloro complexes
formed in these solutions have relatively low stability (which is in
agree-ment with reported stability data7), as if this were not so, competition
from chloride ion to form chloro species would tend to cause a decrease in
the stability of the hydroxy species as the chloride ion concentration
increased. Other studies of the primary hydrolysis of titanium in 3M KC1 22
and 3M KBr21 have been reported and these results are also compared in
Figure 17.
By using the equilibrium pH data it was also possible to
calculate the hydrolysis constant for , the dimeric species. For the reaction
Ti(H 2 0) 6 3+ + H 2 0 Ti 2 (OH) 2 (H 2 0) 8 4 +H+ +
[Ti
2
(oH)
2
(H
2
o)
841qH1
/3 12
[Ti(H 2 0)6 31 [1.1 2 0]
[Ti(III)Nei
(1-771)(Ti(III)] for a stable complex
—(12)
—(13)
—(14)
log/ 2 = i log 2 r2 — pH — log (1 —;) — log I.Ti(III)] —(15)
Using equation (15) and data as in Figure 4, lo gi/12 values calculated at
four points in the region o< .ri< 1 gave a mean of —1.64 and a standard
deviation of 0.04 (ionic strength constant at 0.352M) (see Appendix 4).
Other workers report lo g/412 values at 25oC of —1.65 and —1.95 — 0.17 in
3M K8r21 and 311 KC122 respectively.
At low chloride ion concentrations e.g. 0.3511, negligible
29
However, as the chloride ion concentration is increased the amount of
secondary hydrolysis occurring in the lower pH region also increases
until at very high chloride ion concentrations (—, 9 molar) no primary
hydrolysis is observed in the equilibrated solutions. This is discussed
•in more detail in the next section. For this reason no attempts were
made to calculate/6
12 values at higher chloride ion concentrations.
The stability constant K
12 for the dimeric species, and the
dimerisation constant K 22 , at low chloride ion concentrations were
calculated from the pH data. For the reaction
K
12
Ti(H 2 0) 6 +OH 3+ Ti
2(OH)2(H20)84+ 2H20
—(16) — ,
log K 12 was calculated to be 12.74:± 0.04 at 22 ° C (ionic strength 0.351'I)
(see Appendix 9) and for the reaction
N
2Ti(OH)(H20)52
K 22
+ , Ti (OH)
2(H20)8 4+
2H20 —(17) log 1< 22 was calculated to be 2.52 — 0.24 (see Appendix 9). The
comparative Stability_of the mononuclear and binuclear primary- hydrolysis
-
species for some metals of the first transition series
oan be gauged
25•
from the log K
22
values given in Table 2.
-Table
Metal log. K 22 , Ionic Strength Temperature ° C •
Scandium(III) 3.9 0.5 25
Titanium(III) ' 2.5* 0.4 22
Vanadium(III) .1.8 1.0 20
Chromium(III) 5.3 , 1.0 25
Iron(III) 2.6 1.0 20
2.4.2 Secondary Hydrolysis
From the results section it can be seen that three secondary hydrolysis products are formed, namely brown, black and blue precipitates. Under certain conditions the brown species changes to black then blue on standing. Thus time is an important variable. As the behaviour is also affected by the chloride ion concentration it too has to be considered. In this section the behaviour at verylow chloride ion concentrations is
discussed first. Then the effect of increasing the chloride ion concentration up to a very high value (about 911) is compared.
Information about the brown species was obtained from the rapid titration data. The rapid potentiometric titration curve (Figure 3) shows the uptake of another two equi4alents of OH— in the pH range 3.8 to 5.7. It is in this region that a brown precipitate is formed. This corresponds to the reaction 2H+ + 201( 21120
and Ti(OH)(H 20)5
2+ ,
N Ti(OH)
3 (s) +2H +
31120 —(18) The hydrolysis constant/ for this reaction was evaluated from the pH data as
2 [H1
[Ti(OH)(H 2 0) 521
i.e. 109/33 = — log [Ti(OH)(H 2 0) 521 — 2pH
since Ti(OH)(H 2 ) 52+ is a stable complex,
[Ti(OH)(H 2 0) 521 = (1—;) [Ti(III)]
- ( )
-(20)
- (21) where is the fraction of titanium(III) precipitated, i.e. the ratio of ' 20H— added to the titanium(III) ion initially present [Ti(III)]).
i.e. log/23 = — log (1—m) [Ti(III)] — 2pH —(22) Using equation (22), log/33 values calculated at twelve equally spaced points in region (b) gave mean log/' of-8.02 and-8.07 with a
31
The solubility product value for the brown precipitate was
also determined from the pH data.i.e. For the reaction
—
Ti(OH)(H 2 0) 5 2+ +20H Ti(OH) 3 (s) + 5112 0 —(23)
log K 3 was calculated to be 20.71 ± 0.08. Thus for the insoluble brown
precipitate Ti(OH)
3 log Ksp = —32.19 — 0.28 (see Appendix 9).
As no study of the complete hydrolysis of titanium(III) has
been reported previously no solubility product data for titanium(III) axe
hydroxide / available for comparison. However log K
sp values for other
trivalent transition metal hydroxides25 are shown in Table 3.
Metal
Table 3
Ionic Strength Temperature log K
sp
Scandium(III) —29.7 0 25
Titanium(III) —32.2* 0.5 22
Vanadium(III) —34.4 25
Chromium(III) —30.2 0 22
Iron(III) —38.6 25
Cobalt(III) —40.5 0 25
* This work.
Thus titanium(III) hydroxide has a similar solubility product
to other transition metal hydroxides.
Log P values obtained from titration data for solutions
3
containing higher chloride ion concentrations (see Appendix 3) are compared
in Figure 17.
The equilibrium potentiometric titration curve (Figure 4)
compared with the rapid titration curve (Figure 3) shows the significant
'changes in pH which occur on standing. Further information on this unusual
titanium(III) present in solution after the addition of varying amounts of
sodium hydroxide to solutions containing 0.090611 Ti(III) and 0.35211 Cl - and
allowing them to equilibrate, is shown in Figure 9. The titanium(III)
content remains constant until precipitation begins at = 1.0. After this
titanium(III) is removed from solution at the rate of 1.00 Ti per 2.00 . OH
added, by the formation of brown solid Ti(OH) (region(a) in Figure 9)
'until71.2a1.5.
On standing, the brown precipitate darkens becoming black b t:ho
hydrogen evolution is observed, so that it is unlikely that the precipitate
contains any titanium in the +4 oxidation state. Instead this darkening is
probably associated with the replacement of hydroxide groups by oxide ions.
Also in this region after equilibration, the pH values decrease with
increasing addition of OH- . If it is argued that in the primary hydrolysis
region OH ions are supplied by the reaction
Ti3+ +OH - -(24)
then in the region 1.04
F4
1.5, as the black insoluble species is formed from the TiOH2+ ions, it reduces the concentration of this latter ion,-
consequently reducing the equilibrium concentration of OH ions and thus the
pH. The minimum in the pH curve occurs at
F =
1.5, the pH then being 2.30. If as seems likely, the black insoluble compound is the oxy-hydroxy speciesK
iqi 2 (OH) 2 (H 2 0) 8 4+ +20H- 23 TiO(OH).nH 2 0 (s) -(25) + (5-n) H2 0
1
K23 =
i (OH)2(H20)84 1 q0H-] -(26)
log K 23 = 2p0H - i . log [Ti 2 (OH) 2 (H 2 0) 8 4 1 -(27)
After the addition of 1..5 equivalents of OH - , 0.75 equivalents of
Ti 2 (OH) 2 (H 2 0) 8 4.4* remain (0.25 equivalents being precipitated as the hydrated
oxide) and
(OH)2(H20)844] = 0.75 ,
2 [Ti(III) -(28)
log K D = log K p — log K
b
rown Pblack 33
giving from equation(27), (pK w = 14.38), log K 23 = 24.89 see also Appendix 4).
Since this value was calculated at the minimum in the pH curve, the actual value is log K 23 24.89.
Therefore, for the equilibrium
—
TiO(OH).nH 2 0(s) %Ti(H 0) 6 + 30H —(29) from equations (26) and (16)
• log K = — log K
23 — log K12 —(30)
sp
i.e. log K —37.63 sp
Also, for the equilibrium
Ti(OH) 3 (s) TiO(OH).nH 2 0(s) —(31)
• (brown) (black)
-(32)
i.e. log K D >, 5.44
The black precipitate was very readily oxidised and extreme care was necessary to eliminate contamination from oxygen. The stability of this precipitate was also very sensitive to chloride ion concentration and as a result it was only present in equilibrated solutions when minimum chloride ion concentrations were used. Otherwise oxidation to the dark blue soluble species discussed below tended to occur.
In region(b) (of Figure 9) the precipitate which forms initially is brown, but this turns black within a few. minutes. However, on standing hydrogen is evolved and the additional precipitate which would normally be expected, appears to redissolve to give a dark blue solution. This reaction is completed in about 20 hours, (Note: the amount of precipitate formed in part(a) (see Figure 9) does not appear to increase during the further reaction in region(b).) Because a soluble species is formed, the loss of titanium(III) in this region must be due to oxidation to titanium(IV). The ratio of
titanium(IV) formed to [OH—lis 0.5045:2.0000. As the overall change in 2+
in every two titanium ions which react with hydroxide ions is also oxidised to the +4 oxidation state. That is, the dark blue species contains Ti(III) and Ti(IV) in the ratio 1:1. When aliquots of the dark blue solution are added to 5M HC1 solution, a white turbidity forms, confirming the presence -of Ti(IV).
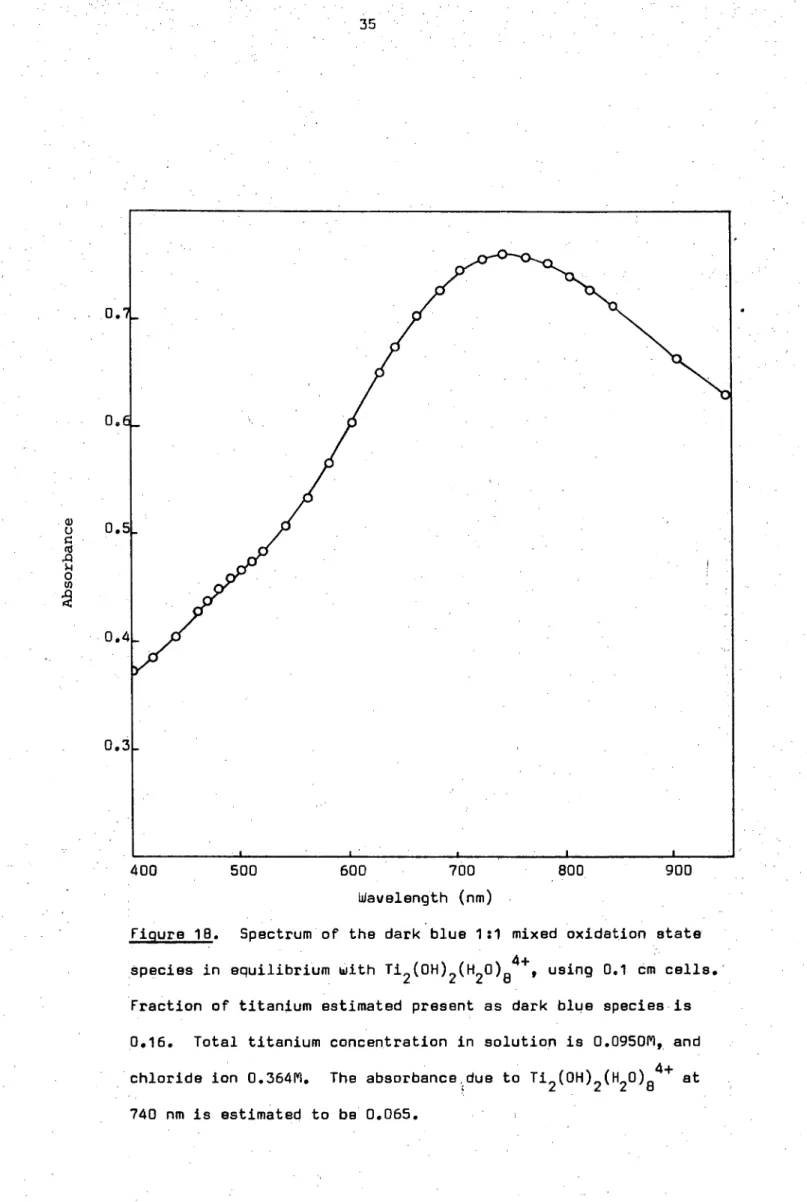
The dark blue species is quite stable in solution and no further hydrogen evolution is observed on standing. Absorbance data at 740 nm from a series of solutions gave an extinction coefficient in the order of 500
-1 -1
moles litres cm (see Appendix 10) so that the complex probably corresponds to the polynuclear species observed by Pecsok and Fletcher20. An example of the *solution spectrum is shown in Figure 18. The high extinction coefficient of this complex would seem to be indicative of a mixed oxidation state complex.
In region(c) (of Figure 9) the dark blue species had coagulated and settled as a colloidal gel like precipitate. The rate of removal of titanium(III) confirmed that the stoichiometry outlined by equation(23) was still being obeyed. This salting out effect is typical of the behaviour of the colloidal precipitates often formed by hydrated metal oxide or hydroxide species.
No mixed oxidation state titanium hydrolysis product appears to have been positively identified prior to this work although, Hartmann and Schlafer5 in 1951 speculated that the dark blue precipitate formed by the addition of base to titanium(III) solutions might be a mixed oxidation state compound.
Investigation of the nature of the brown and black titanium(III) hydroxide precipitates is very difficult because of their extreme sensitivity to aerial oxidation and auto-oxidation, and their colloidal properties. In the similar iron(III) system, which does not have the same oxidation problems, despite innumerable studies of precipitation in hydrolysed iron(III) solutions very little is known about the relationship between hydrolysis products in solution and the mechanism by. which a solid phase is produced31. However it seems likely that the formdtion of a solid phase initially involves
35
400 500 600 700 800 900
Wavelength (nm)
Figure 18. Spectrum of the dark blue 1:1 mixed oxidation state Species in equilibrium with Ti 2 (OH) 2 (H 2 0) 84+, using 0.1 cm cells. Fraction of titanium estimated present as dark blue species is 0.16. Total titanium concentration in solution is 0.0950M, and chloride ion 0.364M. The absorbance,due to Ti
2(OH)2(H 0)8 4+
•
oxolation . reactions. Atkinson et al32 proposed that the hydrolysis proceeds by progressive elimination of H+ from Fe(H
20)6 3+
followed by formation of polymeric species with oxo and hydroxo linkages. Studies of the ageing
behaviour of iron(III) hydrolysis products show that if iron(III) is initially precipitated under rapid conditions i.e. using excess base, as iron(III)
hydroxide gel, then the ageing of this precipitate produces, depending on the other ions present, (0(,/5, or') Fe0(OH) 31 32 . Analytical studies of
33
iron(III) hydroxide sols by Spiro et al showed that they contain
predominantly hydroxyl bridging. In the gallium(III).system which has also been extensively studied34 Ga(OH) 3 is precipitated initially by the action of bases on gallium salts. On standing the precipitate ages forming GaO(OH). Similar aluminium hydroxides are also known;'— Al(OH) 3 Bayerite,—Al(OH) Hydrargillite and js— AlO(OH) Boehmite, and the position of the protons in
35 these compounds has been derived from Proton magnetic resonance studies .
The change from brown to black in the titanium(III) hydroxide system is a similar ageing process; and by comparison with the more studied iron(III), gallium(III) and aluminium(III) systems it seems reasonable t o
propose that the brown precipitate is an hydroxy bridged polymeric species represented by the formula Ti(OH) 3 .mH 2 0, and that the black precipitate is TiO(OH).nN 2 0.
It is known that at very high chloride ion concentrations (greater than about 8 molar) titanium(III) chloro complexes predominate in solution7'9 and it is interesting to compare the different equilibrium hydrolysis behaviour in these solutions. Using LiC1, chloride ion
concentrations of about 9 molar could be obtained readily, however under these conditions accurate pH.measurements could not be made 36-38
Consequently this section of the work is mainly qualitative and based on spectral and analytical data.
Spectral studies of solutions containing titanium(III), (0.088M) and chloride ion, (8.8011) showed that the observed spectrum
37
and Fritz1 for solid trans — [TiC1 2 (H 2 0) 1-11 C1.2H20
max= 545 nm). When base is first added to the violet solutions of TiC1 2 (H 2 0) 4+ such that
El< < 1, the color becomes darker. This suggests the formation of the chloro primary hydrolysis species TiC1 2 0H(H 2 0) 3 which probably dimerises rapidly. •The solutions quickly become turbid, precluding spectral studies of the chloro hydrolysis species. When base is first added to the original violet TiC1
2 (H2 0)4 -I- solutions such that 1<5 <3 a brown precipitate -is formed which rapidly darkens. In both regions the precipitates are slowly .oxidised to a dark blue species, hydrogen being evolved simultaneously. The
final result is the formation of a dark blue precipitate in solutions over the range 0< Ti <3, with the unhydrolysed TiC1 2 (H 2 0) 4+ species remaining in solution above the precipitate (see spectra Figure 7). The variation of the absorbance of the solutions at 550 nm„ as base is added is shown in Figure 8. No change in absorbance is observed until precipitation occurs. Then the value jumps sharply due to scattering of the light by a small amount of the precipitate remaining suspended in the solution as colloidal particles. However, overall the absorbance decreased uniformly towards zero as the number of hydroxyl ions added tended towards
3.
The variation of the.titanium(III).content of these equilibrated solutions is shown in Figure 10. . The slope of this curve also corresponds to titanium being removed as the dark blue precipitate at the .rate of 1.00 Ti(III) per 3.00 OH— added and confirmed that complete precipitation of the titanium occurs.
Thus in equilibrated concentrated chloride scilutions secondary hydrolysis probably results from the following reactions
Addition ofexcess base
TiC1 . (OH)(H 0) + 20H— Ti(0H)
3(s) + 2C17 (rapid) —(33) 2
(brown) and subsequently
Ti(OH) (s) TiO(OH).nH 2 0(s) —(34)
(black)
Cl (OH) (H 0)
2 4 2 2 4 • 2TiO(OH).ny(s) + 4H+ 4C1 — (slow) —(35) (black)
(iii) Auto oxidation of the black precipitate to form the dark blue mixed oxidation state species which settles as a gel like precipitate at these high chloride ion concentrations.
2.4.3 Reactions involving the evolution of hydrogen.
The evolution of a gas from solutions containing titanium(III) hydroxide precipitates is an unusual phenomenon. The gas was observed to cause a lighted match to explode, establishing that it was hydrogen being evolved. Spontaneous hydrogen evolution from a metal hydroxide in solution is relatively rare and only associated with low oxidation states of
transition type metals. Titanium(III) hydroxide had been known to undergo this type of behaviour for some time39 but no detailed study of the reaction appears to have been made previously. Hydrogen evolution also occurs in some titanium(III) — fluoride systems. The very slow evolution of hydrogen from titanium(III) fluoride solutions in hydrofluoric acid has been reported 14 and KTiF
4 is oxidised by water with the evolution of hydrogen 18
according to the reaction
2KTiF
4 + 4H20 ' H2 TiO3 + K2 TiOF + 4HF + H2
f
—(36) The only other well known case of hydrogen evolution involving a metal in solution in the trivalent state is that of uranium(III). If a-red hydrochloric acid solution of uranium(III) chloro complexes is added toaqueous ammonia, a pale orange—red precipitate of U(OH) 3 is observed which 40-42 subsequently changes to pale green U(OH)
4 with the evolution of hydrogen . . Several metals in the divalent state liberate hydrogen from
solution. T1C1 when dissolved in water liberates hydrogen 9 and V(H 0)
2 2 62+
9,43
similarly liberates hydrogen but not in acid solution . Chromium(II) ions are also unstable in aqueous solution and evolve hydrogen at rates varying with acidity and the anions present 44,45 .
39
of ruthenium(II) in 2.519 KC1 (pH 1.5,30°C) by water has been studied by Rechnitz and Catherino46 . No pH effect was observed in the pH range 0.5 to 1.5, and the reaction was also independent of chloride ion concentra-tion in the range 1-4 molar. From the evidence it was concluded that water itself acts as the oxidising agent, the overall reaction being
Ru(II) + H 2 0 Ru(III) + iH271 +OH— —(37) The mechanism proposed was
H 2 0 + Ru(II) H
2
0—
+ Ru(III)
—(38).
H 20
—
+H + fast H + H
20 —(39)
i.e. a 1st order rate was observed. The ruthenium case is therefore quite from
different J., that for titanium where a strong dependence on OH concentra- tion was observed.
For the titanium(III) system the dependence of the rate of hydrogen evolution on the hydroxide ion concentration was different for the brown and black hydroxide precipitates. A simple reaction mechanism
suggested by equation (1) would be K
4
2X +OH— 2A —(40)
(slow k
+OH product —(41)
thus rate = k [11110H-1 —(42)
[Al = K4
1-01 rx1
-(43)
d(H )
.. • 2 =
k 3K
I
xi
ftodt
2 - (44)
and from equation (2) for the, black precipitate would be 6
Y
slow k •,5 %
B + OH— ■ • products' thus rate = k 5
[Afar]
[B] = 1<
5
EY]
... d(H2) = k
5K6 [Y][0H—]. dt
-(45)
- (46)
—(48)
—(49)
moeTq 641 ao umoaq egg aaillTe Jo uoTqepTxo one eyq Aq suoTleaqueouoo. uoT epTxoapAy umaeo le • ewaoj sT seToeds aeqqeT sTql . (AI )wnTueviq pue (TrOwnIus4T4 40 squnowe Tenbe 6U1u1eluo3 seToeds eqeqs uoIlsPIxo PsxTw
S sT peuTelqo elevidTpead opTxoapAy, enTq maep 0(44 ;egg mous ol pequesead ueeq.seq.e3uepTA3 . *lawq qsaTJ > eyq apj poolsaapun eq mou ueo seleqTdToead opTxoapAy,.(III )wnTuevrq moeTq pus umoaq eq4 Jo eanleu eq AT4uenbesuo3
(Mosiq) (umoaq)
( LE)- (s) p31-1u°(H0)0T1 (s)OZHL0E(HO)T1
umoaq
(0ZH)(HO)T1
(£Z)- (s) Aill•C(H0)T1c=--- -1- HOZ +
+Z
.6uTpue4s uo sesTaewTp Alluenbesqns nsTe yowl apeppe sT eseq 8JOW JT 4 seToeds sTeAToapAy Aaepuooes eTqnTosuT ue Jo uoT4ew1oj eq4 pue
(p )- 0H+ Z Z +v 8(OZH)Z(HO)ZT1 %
+ZS(0
ZH)(HO)TI2
9. Z
(C )- •+z9(0ZH)(H0)T1 -HO+
buTpuels uo sesTaewTp yoTym saToeds sTsAToapAy AaewTad aTqnTos e JO U0T48WJ0J 841 •sde4s omq Jo s4sTsu03 sTaAToapAy eq4 qey4 umoys useq stay qi •uoT (III )wnTueviq -onbexey 9144 jo sTsAToapAy e4eTdwo3 8144 Jo 6uTpueqs1epun - ue awn 4saT4
844 JOJ U8/T6 . S84 MJOM ST44 UT 4no paTaaeo uoT4ebT4senuT eta
uoTenTou00
.peTpnqs ueeq soy adAq sTy4 Jo anoTneyeq gein awTq 4saTJ eq4 sT sT4i .sdnoa6 TAxoapAy Jo uoT43npea eq4 WOJJ sq -Ensea ue6oapAy Jo u0T4nTone eyq .e•T
(L
s)—
H4 + + _HO+ (AI)TI;E"===-1' (HOU suoTlenbe eq4 Aq pesTaewwns axe penTonuT eTaqTTTnbe xopea eta
•maom sTy4 Jo edoos eyq epTslno sT yoTym 4 /cony; 3T4euTm . enTqueqxe Us eaTnbea pTnom
•umoum lou sT su0T43e81 atiq UT seToeds eqeTpewaequT Jo ean4eu pus aeqwnu - can. 6 peATonuT AaqsTweyo uoTqnTos xeTdwoo eql Jo esne6eq J8A8MOH .seToade •
41
At high chloride ion concentrations the formation of
titanium(III) chloro—aquo species tends to promote thedimeiisatiorireactions, . ,
the auto oxidation reactions and the formation of the secondary hydrolysis
species. Thus the effect of chloride ion concentration on the hydrolysis
behaviour would seem to support the suggestion of Glebov47 that the
replacement of water molecules by chloride ions in the co—ordination sphere
of titanium(III) increases the rate of exchange of the molecules in the
hydration shell of the titanium ion.
The studies of the rate of evolution of hydrogen which takes
place during the auto—oxidation of the brown and black precipitates, appear
to be the first studies of this type carried out for the titanium(III) system
and have suggested that the actual species reduced is hydroxide ion. It has
also been noted with interest that, if excess base is not present, this
oxidation process stops once the composition of the 1:1 titanium(III)
• titanium(IV) mixed oxidation state species is reached. This emphasises the
Titanium(III) thiocyanate complexes in aqueous media
3.1 Introduction
Several studies of complex formation between the thiocyanate
— ion and titanium(III) in aqueous solution have been made3 '40 '4851
However these have been limited in-extent and the reported data appear to
contain some inconsistencies. For example, Jorgensen40 suggests that a
1:3 Ti(III) : NCS — species is formed in solution, while from a similar
solution Sutton52 isolated a 1:4 complex. Van der Pfordten 53 reports the
preparation of a 1:6 compound but more recent work has been unable to
confirm this52. Several workers have proposed the formation of a 1:1
complex in solution3'49-51 but no direct evidence has yet been presented.
Consequently the titanium(III) thiocyanate system in aqueous solution is
still not clearly understood.
In this chapter, results of a new investigation of complex
formation in aqueous solution over the thiocyanate ion concentration range
0-7 molar are presented. These results enable discrepancies in the
literature to be explained. Direct evidence confirming the formation of the
previously reported 1:1 Ti(NCS)(H 2 0)5
2+
species has been obtained. The
existence of .a 1:4 complex Ti(NCS) 4 (y) 2 — in solution has been demonstrated
and its formation constant estimated. No study of the actual bonding
between the thiocyanate ligand and titanium(III) has been made in this work.
However a comprehensive infra—red study of vanadium(III) thiocyanates by
Bohland and Malitzke 54 has established 'that the thiocyanate is bonded to the
vanadium via nitrogen rather. than sulphur and it is assumed from this
evidence that the anions in the titanium thiocyanate complexes are also
N—bonded.
The oxidation of titanium(III) thiocyanate Solutions in air has
also been studied and evidence is presented for the formation of a new 1:1
43
3.2 Experimental
The studies involved conductometric and spectral measurements
of titanium(III) — thiocyanate solutions.
Conductometric measurements were used to determine the metal:
ligand ratios of the complexes formed in solution. A conductance cell of
similar design to that used by Jones and Bollinger55 was constructed o
pyrex glass. Platinum disc electrodes 0.80 cm diameter were used, the
separation distance being 25.50 cm. This cell gave relatively high
resistance values for the solutions (300-600 ohms) which resulted in good
sensitivity being obtained for the measurements. The resistance values were
obtained using an A.C. conductance bridge described by Leong56. By using an
A.C. technique, polarisation errors were minimised. The basic circuit was
essentially a modified Wheatstone Bridge (see Figure 19). The ratio arms
R
3 and R4 were kept equal at 100.00 ohms each and the measuring arm R2 was
a separate resistance box, capable of having resistance values between 0.02
and 10000 ohms. Resistance changes of 0.1 ohm were detectable. Conductance
measurements were made on a series of carefully prepared solutions. Each
solution contained a fixed quantity of titanium(III) in dilute hydrochloric
acid and varying amounts of ammonium thiocyanate. The solutions were made.
to constant volume and allowed to equilibrate to constant temperature.
Spectrophotometric measurements of the titanium(III)—thiocyanate
solutions were made to obtain information about the nature of the complexes
formed in solution and also to provide data for estimating the formation
constants of the various species. Series of individual solutions each
containing a fixed quantity of titanium(III) with varying amounts of
thiocyanate ion were prepared for different ranges of thiocyanate ion
concentrations. Absorbance measurements over a range of wavelength values
were made on each solution.
It was necessary to take precautions against aerial oxidation of
Conductance Bridge circuit. Figure 19.
(/ Oscillator
Screened and Balanced Transformer
Conductance Cell
Spectrophotometric studies were also found to be the most useful for monitoring the oxidation of titanium(III) in thiocyanate solutions. The procedure used involved following the changes in the spectra of solutions with time, during equilibration in air. The
45
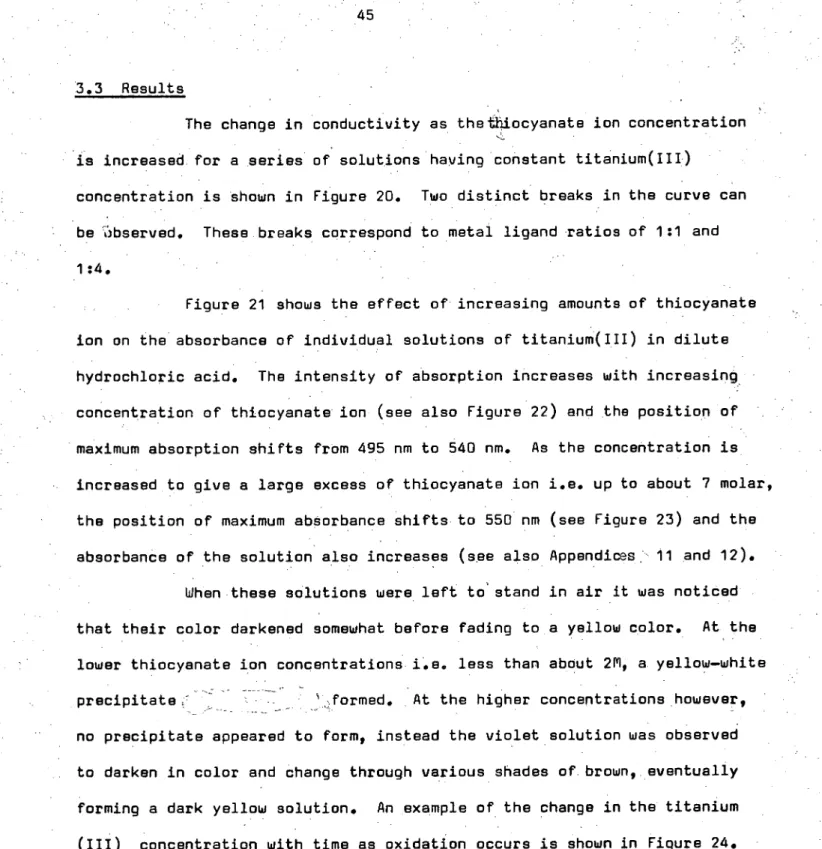
3.3 Results
The change in conductivity as theiiiiiocyanate ion concentration is increased, for a series of solutions having constant titanium(III)
concentration is shown in Figure 20. Two distinct breaks in the curve can be 'observed. These breaks correspond to metal ligand ratios of 1:1 and 1:4.
Figure 21 shows the effect of increasing amounts of thiocyanate ion on the absorbance of individual solutions of titanium(III) in dilute hydrochloric acid. The intensity of absorption increases with increasing concentration of thiocyanate ion (see also Figure 22) and the position of maximum absorption shifts from 495 nm to 540 nm. As the concentration is increased to give a large excess of thiocyanate ion i.e. up to about 7 molar, the position of maximum absorbance shifts to 550 nm (see Figure 23) and the absorbance of the solution also increases (see also Appendices. 11 and 12).
When these solutions were left to stand in air it was noticed that their color darkened somewhat before fading to a yellow color. At the lower thiocyanate ion concentrations i.e. less than about 211 a yellow—white precipitate: ',formed. At the higher concentrations however, no precipitate appeared to form, instead the violet solution was observed to darken in color and change through various shades of brown, eventually forming a dark yellow solution. An example of the change in the titanium (III) concentration with time as oxidation occurs is shown in Figure 24. The spectrum of the solution was also recorded at different stages during the oxidation. These spectra showed that as the total titanium(III) content decreased due to oxidation to titanium(IV) the absorbance peak (7\ max=550nm) similarly decreased, while absorbance in the ultraviolet increased strongly (Figure 25). For the results represented in Figure 25, the ionic strength and total titanium content were constant, and therefore the spectra
Con
duc
tance 24
34
32
30
28
0
x 26
22
20
18
16
0 3 4 5 6 7 8 9 10
Figure 20. Conductometric titration curve for titanium(III)
with thiocyanate ion. Temperature = 20.0oC.
A =
ratio INCS : [Ti(III)I47
a 1:1 mixed oxidation state species.
3.4 Discussion
The results obtained have enabled the stoichiometry and stability constants of the titanium(III) thiocyanate complexes, formed in solution, to
420 460 500 540 580 620
Wavelength (nm)
Figure 21. Spectra of solutions of titanium(III) where
/1 = 0.0(a), 1.30(b), 3.26(c), 6.52(d), using 0.5 cm cells.
be determined.
The two distinct breaks in the conductometric titration curve (Figure 20 can be interpreted as due to the formation of 1:1 and 1:4 species.
3 2 5 6 7
Figure 22. Variation of absorbance at 540 nm with
thiocyanate ion concentration for titanium(III) solutions.
,E=
ratio [NCS - 1: [Ti(III)]. Path length = 0.5 cm.49
0.0
420 460 . 500 540 580 620 660 700 Wavelength (nm)
Fiqure 23. Spectrum of titanium(III) in 7.20M ammonium thiocyanate ..solution (i.e.A-= 212) using 0.5 cells.
i • e. and
Ti(H 20)6
3+
+ NCS Ti(NCS)(H 2 0) 5 , 2+ +
Ti(NCS)(H 20)5
2+
+ 3NCS
4 (H2 0)2 — +3H 2 0
The formation of the former complex (as given by equation (1)) confirms —
previous work3,4951 , while the latter species, Ti(NCS)
4(H20)2 has not previously been identified in solution. However the solid complex
NH
4 Ti(NCS)4(H20)2 has been isolated from a solution containing 0.2519 TiC1
3.6H20 and 1.5019 NH4N c
S52. No evidence for the existence in solution
• of a Ti(NCS)
3(H20)3 species suggested by Jorgensen 40
was observed. This is not unexpected as the evidence for the existence of the 1:3 species was based upon the fact that a purple titanium(III) thiocyanate complex could be extracted into ether solution, and it was assumed that this was the neutral species. However, as NH 4 Ti(NCS) 4 (H 2 0) 2 was prepared by an ether extraction process it seems likely that the species reported by Jorgensen
in solution
was in fact the 1:4 complex. No evidence for the formation/of a 1:6 species, reported to have been isolated as (K,NH 4 ) 3 Ti(NCS) 6 .6H 2 0 by Van der Pfordten " , was observed. Repetition of Van der Pfordtenls work by Sutton52 failed to yield a pure sample of the violet thiocyanate complex from aqueous solution. It seems likely that the complex isolated by Van der Pfordten in 1886 was actually an impure sample of NH 4 T1(NCS) 4 (H 2 0) 2 . The spectrophotometric
results could not be used to confirm the composition of the species formed as a Yoe and Jones molar variation plot57 gave a smooth curve (Figure 22)
rather than intersecting lines.
Sufficient information, however, can be obtained from the spectrophotometric data to enable stability constants for the various titanium(III) complexes to be estimated.
For the 1:1 complex, from equation(1),
[Ti(NCS)(H 2 0) 5 2 1
—(3) [Ti(H 2 0) 6 31 ][NCS
51
20 40 . 60 80 100 120 140
Time (hours)
Figure 24. Rate of oxidation of titanium(III) to titanium(IV) [Ti(III)j initial = 0.03411, [C11 = 0.28119 [NH 4 NCS] = 6.4011.
600 nm for solutions where the NCS — :Ti(III) ratio ranged from 0 to 9, gave log K l values of 0.410 and 0.407 and Emax (540 nm) = 27.0 ± 0.3 moles —1 1
—1
cm (temperature 20oC). A value of log K
52
found for the mono thiocyanate complexes of aluminium and several of the
trivalent "f-block" elements (see Table 4) 25• Other trivalent transition
metal M(NCS)(H 20) 5 complexes e.g. where M = V(III), Cr(III), Fe(III) and 2+
Ru(III), are more stable.
Table 4
Stability Constants of some 1:1 metal thiocyanate complexes.
Metal Temp°C Ionic Strength
(M)
log K 1
Pu(III) . 25 1 0.46
Am(III) 25 1 0.50
Cf(III) 25 1 0.49.
Cm(III) 25 1 0.43
Ti(III) 20 0.5 0.41*
Al(III) 23 0 0.42
V(III) 25 1 2.1
Cr(III) 25 0 3.1
Fe(III) 20 1.2 2.1
Ru(III) 70 .1 1.8
This work.•
For the 1:4 complex, from equetion(2)
[Li (NCS) 4 (H 2 ) 2 1
[ri(NCS)(H2 0) 5 2 1[NCS1
Using the method described in Appendix 12, absorbance data at 520 nm and
560 nm from solutions where the NCS — :Ti(III) ratio ranged from 47 to 212,
gave log K 14 values of —1.67 and —1.85, and clax (550)=50.9 t 1.0
temperature 25 ° C).
Thus for the reaction
P4
Ti(H 2 0) 63+ + 4NCS Ti(NCS) 4 (H 2 0) — + 4H 2 0 —( 5 )
log (14 = log K l + log K 14 —(6)
i.e. log