Journey Planning Based on User
Needs
Abstract
In this paper we discuss potential developments to the design of pre-trip in-home journey planning services, to include support for additional user needs. These needs were identified through stakeholder interviews as contributing to actual decisions in route selection scenarios and include: safety, weather and even fitness. A journey planner was designed to allow users to articulate these constraints and a series of paper prototypes were evaluated through cognitive walkthroughs. An exploratory study compared three designs and provided rationale for the most effective interaction method, informing an implementation plan.
Keywords
Public transport, journey planner, exploratory study
ACM Classification Keywords
H.5.m. Information interfaces and presentation (e.g., HCI): Miscellaneous. H.5.2. User Interfaces: User-centered design.
Introduction
Transport is an essential part of our lives, providing access to goods, services, employment and social opportunities. Yet it is plagued with problems: congestion, noise and air pollution, under- or over-utilisation of public transport, and land loss to roads to name a few [9]. These issues can be partially solved or alleviated in two ways: (a) making the car a less Copyright is held by the author/owner(s).
CHI 2007, April 28 – May 3, 2007, San Jose, California, USA. ACM 978-1-59593-642-4/07/0004.
Paul André
University of Southampton School of Electronics and CS Southampton, SO17 1BJ, UK [email protected]
Max L. Wilson
University of Southampton School of Electronics and CS Southampton, SO17 1BJ, UK [email protected]
Alisdair Owens
University of Southampton School of Electronics and CS Southampton, SO17 1BJ, UK [email protected]
Daniel Alexander Smith
attractive way to travel [12], (b) making public transport a more attractive alternative.
In support of the latter goal, a report on the ROMANSE project, which provides real-time travel information, stated that the greatest potential impact on travel behaviour was the provision of “pre-trip in-home information” [7]. Beecroft and McDonald [1] predict a blurring of collective and private forms of travel, occurring in public transport becoming more focused on user needs, with this process supported by route planning. This bespoke approach is echoed by Hoogma
et al. [4], with the concept of “the inclusion of all means of transport into an individually tailored package deal in which users determine for every trip which transport modes or combinations of modes best suit their needs”.
To support in-home journey planning, we wanted to understand what needs or additional factors users would want to control. This research is directed at car users to convert their journeys to public transport, as well as supporting those who currently use public transport in our local area – nationwide implementation is discussed at the end of the paper. To identify these factors we undertook related research and interviews with end users and domain experts. Scenarios were developed to inform a series of prototypes that
extended the functionality of currently available journey planners. The prototypes were evaluated using
cognitive walkthroughs. Finally, three distinct
interaction metaphors were compared in an exploratory study to answer two research goals:
a) Whether providing control over user-identified needs encourages increased use of public transport.
b) What interaction method increases the effectiveness of such control.
The focus of this work is to encourage public transport use through addressing personal planning constraints, and we propose the investigation of algorithms and data sources in subsequent future work.
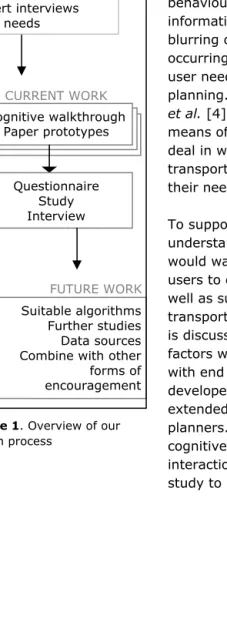
Design Process
Following the design process in Fig. 1, we began with a series of semi-structured interviews with domain experts including the Director of the Transport Research Group (TRG) at the University of
Southampton. This was supported by interviews with key academic and commercial partners of the nationwide sustainable transport research project: FUTURES. Interviews were also conducted with a marketing director for transport organisations and the head of transport for a local bus service. These interviews highlighted the need to extend current schedule and cost information with consumer concerns and contextual information to make public transport as seamless as car use, and increase comfort and
reassurance in changing travel patterns.
Related Work
The Verkehrsverbund system [8], which organises regional public transport in Germany, attributes its success to physical attributes: service expansion, better quality service, better marketing, and a uniform, integrated fare structure. A study on the doubling of patronage of public transport in Freiburg [3] found the main explanation for the increase was a low cost travel
BACKGROUND
CURRENT WORK
Cognitive walkthrough Paper prototypes
Questionnaire Study Interview
FUTURE WORK
Suitable algorithms Further studies Data sources Combine with other forms of encouragement Related work
[image:2.612.69.183.150.464.2]User interviews Expert interviews User needs
card valid across operators, and transferable between friends and family. While these papers have focused on service improvement, other research has looked at holistic travel experiences, such as case-based
personalized route planning [5], and route planning by geographical information systems and ‘isochrones’ [6]. Neither of these seem to have been used commercially. Existing journey planners (see theaa.com or
thetrainline.com) typically concentrate on one form of transport, providing information on mileage and directions, or number of stages and the time each will take. Transport Direct [11], a national journey planning service, extends this across routes combining all forms of transport including bus, train, air and car.
Scenario Analysis
Based on this initial research, we began an investigation into the factors involved in choosing routes and modes of transport. Semi-structured interviews were carried out with 20 potential transport users who varied in age, gender, education and existing use of public transport. In line with previous research into consumer frustrations and needs [2][10] some common issues were raised during discussion of a route-choosing scenario: reliability, lack of information before and during journeys, convenience, and comfort. Further discussion explored the factors that contributed to these issues. Participants identified a number of constraints that often prevented their use of public transport, for example, crowded environments and potentially dangerous areas. Some wished to avoid physical effort, while others sought routes for improving fitness. A full list of these constraints on journey planning were developed into a generic journey planning scenario and used to inform the prototype designs below. Although the constraints can be
generalised, some aspects (such as safety and lighting) were borne from the interviewee’s local knowledge and previous experience.
Prototyping
From our scenario analysis, we see that while existing journey planners provide schedule and duration information effectively, realistic transport decisions involve constraints such as weather conditions, safety, and fitness. To address this lack of constraint
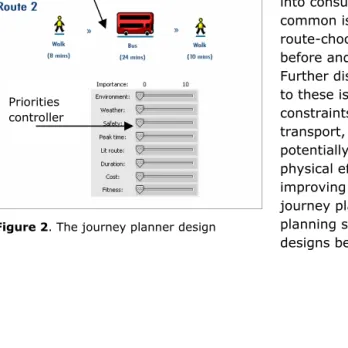
expression, our research extends the Transport Direct concept to allow users to choose between available routes based on the factors identified in interviews. We chose Transport Direct because it provides routes across multiple modes of transport. We then designed a paper prototype to simulate the route selection of a pre-defined journey. The general design is shown in Fig. 2. With the application of cognitive walkthroughs and group heuristic evaluations, a series of alternative designs for the priorities controller were suggested and developed through paper prototypes. Three distinct designs for this controller were chosen, which allows the priorities to be expressed under different
metaphors. In Fig. 3, the user can reorder the needs to provide a priority order (ranking). In Fig. 4, users can choose the importance for each factor as high, medium or low (Lo-Hi). Finally, Fig. 5 allows each factor to be ranked out of 10, providing finer-grained control ( 0-10). Sliders have been used effectively for the selection of music through personal preference constraints in the Glass Engine1, and have been utilised here to similarly express personal constraints. As an alternative
1 http://www.philipglass.com/html/pages/glass-engine.html
Four possible routes Recommended route
[image:3.612.13.187.299.518.2]Priorities controller
metaphor, prioritisation through ranking has been used in Fig. 3.
Study
Aims
This exploratory study was designed to investigate our two research goals: to see if providing control over user-identified needs would encourage increased use of public transport, and what method of control achieves this goal.
Design
The following user needs were identified through our interviews and related work:
Environment: Using a carbon footprint2. A user can express a wish for reducing environmental damage.
Weather: A user can express a wish to avoid bad weather.
Safety: A user can express a wish to avoid areas known as posing a risk of criminal activity.
Peak Travel: A user can express a wish to avoid busy public transport at peak times.
Lighting: A user can express a wish to avoid unlit areas, such as parks or roads without street-lighting.
Duration: A user can express a wish to be in travel for as little time as possible.
Cost: A user can express a wish to travel for as little money as possible. (Car costs based on average running costs3).
Fitness: A user can express a wish for exercise opportunities, such as walking.
2 http://www.carbonfootprint.com/calculator.html 3 http://news.bbc.co.uk/1/hi/uk/6068568.stm
Participants were given a generic scenario (based on a real route) so that prior knowledge was not a
confounding variable. The scenario provided
opportunity for each variable to be applied, covering for example: darkness, rain, unlit areas and peak travel.
Methodology
12 participants were chosen, varying in age, gender, education and existing use of public transport. A within subjects evaluation was performed over the three designs; the order of exposure was rotated. Each user was asked to read the scenario carefully and choose a route with each interface in the appropriate order. Timing and preference were measured. Users were asked to think aloud while choosing each route. Pre-study questionnaires and semi-structured follow-up interviews were carried out.
Results
The pre-study questionnaire showed that of the 12 participants (7 male, 5 female), 6 owned a car, and public transport usage ranged from daily to monthly or less. All participants expressed an interest in the concept and would like to investigate it further, and 50% of car users said that given this extra control over their journey, they would be tempted to switch some of their car journeys to public transport.
The second goal of the study was to look at the preferred method of expressing control. Results across the three interfaces were mixed. There was no
[image:4.612.77.168.126.223.2]significant trend towards a particular interface either by time or preference. Further investigation, through chi-squared analysis, revealed the following:
Figure 3. The control to rank the factors.
Figure 4. The control to rank each factor low, medium, or high.
y The average time spent on each interface varied between participants but not within participants.
y Men spent significantly more than 90 seconds choosing a route and women less
(X2(1, N=12)=6.12, p<=0.025).
y Women had a significant preference for the Lo-Hi interface (X2(4, N=12)=12, p<=0.025). Men, however, had a mixed view that tended toward ranking, or 0-10.
y Car owners preferred 0-10 (X2(4, N=12)=8.57, p<=0.1), and ranking was almost consistently rejected. For non car-owners, preference was mixed.
No correlations were discovered between regular and infrequent users of public transport. Similarly there was no correlation across age, education or experience with journey planning software.
Discussion
The results of the study and interviews were promising, with one participant stating “sometimes a site gives me routes, and I think, ‘that one’s not safe’, but I can’t tell the site that”, pleased that they were able to express control over such factors.
The results of the interface preference are hard to apply. While it appears men prefer ranking or 0-10, they statistically spent more time playing with all three versions. This indicates they tend to prefer tools that allow for investigation. However, while women statistically preferred Lo-Hi, 0-10 was a close second, with ranking near uniformly rejected – tending towards finer-grained control. The near significant preference of car-owners towards increased control over their
priorities provides an interesting insight for a suggested
design choice. Follow-up discussions indicate that route-planning outside of normal routine provides the occasion to prioritise travel needs. Car-owners would naturally use a car for such a journey. Those without access to a car have to plan a new route and prioritise their needs. As the preference of car-less participants was mixed and it was the preference of car owners to have more control, the 0-10 design may encourage car-owners to use public transport.
This analysis suggests that the 0-10 interface be implemented. While male and car-less participants do not have a clear preference, women tended towards finer-grained control. Also, car-owners who are less familiar with prioritizing their transport needs tended towards investigative control, which suggests that 0-10 may be the best design for encouraging the use of public transport. It may be worth noting that the majority of females prioritized safety and lit routes during the study, which indicates that such controls may encourage women to use public transport.
Users who did not prefer the 0-10 interface generally had one of two criticisms: either it was hard to assign a number to how important something was, or that there were too many options, and even leaving the sliders at 0 still felt overwhelming. By labelling the extremes “No Importance / Very Important”, and allowing users to select which sliders to use (perhaps greying-out the others), we hope to address these issues.
Implementation
with the Transport Research Group, to support the attributes for route selection. For example, local government bodies have records of every streetlamp, weather forecasts are available online, and the police have crime statistics. Additionally, strategies for helping users to contribute their feedback on route segments will support an evolving community environment. Previous experience with heterogeneous data linking, through the Advanced Knowledge Technologies research initiative4, indicates that these data integration issues are tractable.
Conclusions
From related research it is clear there is a call for public transport information based on user needs, and
through an iterative user-centred design process we have developed a journey planner allowing users to express control over a number of constraints identified through interviews. All study participants were
enthusiastic about the concept, and 50% of car users said that given this extra control over their journey, they would be tempted to switch some of their car journeys to public transport. Analysis of user
preference between designs indicated a preference for articulating constraints by assigning a 0-10 rating. Finally, we discuss methods for implementing this design towards making public transport a more accessible option.
Acknowledgements
We thank Mike McDonald, Mark Beecroft, Alec Gore and Ray Stenning for their expert insight, m.c. schraefel as our team mentor, and the participants in our studies.
4 http://www.aktors.org/akt/
References
[1] Beecroft, M., McDonald, M. Bespoke services for personal travel and goods movement. Engineering Sustainability, 158(2), (2005), 83-88.
[2] Edvardsson, B. Causes of customer dissatisfaction – studies of public transport by the critical-incident method, Managing Service Quality 8(3) (1998) 189-97. [3] Fitzroy, F., Smith, I. Public transport demand in Freiburg: why did patronage double in a decade?
Transport Policy, 5(3), (1998), 163-173.
[4] Hoogma, R., et al. Experimenting for sustainable transport. The approach of strategic niche
management. Spon Press, London, 2002.
[5] McGinty, L.,Smyth, B. Personalised Route Planning: A Case-Based Approach. EWCBR 2000, 431–442. [6] O’Sullivan, D., et al. Using desktop GIS for the investigation of accessibility by public transport: An isochrone approach, International Journal of
Geographical Information Science, 14, (2000) 85-104. [7] Powell, R. et al. "Real time passenger information system for the ROMANSE project," Public Transport Information and Management Systems, IEE Colloquium on, 9/1-9/4, 1993.
[8] Pucher, J., Kurth, S. Verkehrsverbund: the success of regional public transport in Germany, Austria and Switzerland, Transport Policy, 2(4), (1996) 279-291. [9] Rodrigue, J-P et al. The Geography of Transport Systems, Hofstra University, Dept. of Economics & Geography, (2006) http://people.hofstra.edu/geotrans.
[10] Stradling, S.G. Transport user needs and marketing
public transport. Municipal Engineer: Special Issue on Sustainable Transport Policy. 151, (2002), 23-28. [11] Transport Direct Information, see
http://www.transportdirect.gov.uk
[12] Wright, C. & Egan, J. De-marketing The Car.