i University of Southern Queensland
Faculty of Health, Engineering and Sciences
Energy Management & Automated Analytics
A dissertation submitted by
Matthew Santarossa
in fulfilment of the requirements of courses
ENG4111 and ENG4112 Research Project
for the degree of
ii
Disclaimer
University of Southern Queensland
Faculty of Health, ngineering and Sciences
ENG4111 / ENG4112 Research Project
Limitations of Use
The Council of the University of Southern Queensland, its Faculty of Health, Engineering & Sciences, and the staff of the University of Southern Queensland, do not accept any responsibility for the truth, accuracy or completeness of material contained within or associated with this dissertation.
Persons using all or any part of this material do so at their own risk, and not at the risk of the Council of the University of Southern Queensland, its Faculty of Health, Engineering & Sciences or the staff of the University of Southern Queensland.
This dissertation reports an educational exercise and has no purpose or validity beyond this exercise. The sole purpose of the course pair entitled “Research Project” is to contribute to the overall education within the student’s chosen degree program. This document, the associated
iii
Candidates Certification
University of Southern Queensland
Faculty of Health, Engineering and Sciences
ENG4111 / ENG4112 Research Project
Candidates of Certification
I certify that the ideas, designs and experimental work, results, analysis and conclusions set out in this dissertation are entirely my own effort, except where otherwise indicated and acknowledged.
I further certify that the work is original and has not been previously submitted for assessment in any other course or institution except where specifically stated.
Student Name: Matthew Luke Santarossa
iv
Abstract
Electricity bills are an inherent cost to any household or business. In recent years, the commodity as a whole has risen significantly in price placing greater demand on our society to reduce on energy costs.
The principle of energy management explores the energy behaviours of a given site or premises in order to create consumer awareness and alter their energy behaviours. By gathering and distributing more information regarding the consumption of a site or premises, consumers can
grasp a better understanding of their energy consumption and make justified decisions in order to reduce their energy consumption. This concept can deliver significant long-term results but can often be a time consuming and expensive process to implement.
v
Acknowledgements
I would like to extend my greatest thanks to Dr. Narottam Das who has been extremely supportive throughout the entirety of this research project. His genuine interest in my project has pushed me above and beyond my normal capabilities and it has helped me to realise my full potential on this project.
A big thank you must also go out the electricity consumers whom were nice enough to let me utilise their home and business to perform my research. Their time and efforts are greatly
appreciated.
vi
Table of Contents
Disclaimer ... ii
Candidates Certification... iii
Abstract ... iv
Acknowledgements ... v
Table of Contents ... vi
List of Figures ... x
List of Tables ... xi
List of Acronyms ... xii
Introduction ... 1
1.1 Project Background ... 1
1.2 Project Objectives ... 2
1.3 Project Implementation ... 3
1.4 Project Overview and Timeline... 3
1.5 Project Safety Considerations ... 3
1.6 Project Structure and Content ... 4
Background Information ... 5
2.1 Chapter Overview ... 5
2.2 Energy Management Definition ... 5
2.2.1 Planning ... 5
2.2.2 Monitoring ... 5
2.2.3 Data Analysis ... 6
2.2.4 Controlling ... 6
2.2.5 Review ... 7
2.3 Energy Management History ... 7
Literature Review... 10
3.1 Chapter Overview ... 10
vii
3.2.1 Residential Energy Management ... 10
3.2.2 Commercial Energy Management ... 11
3.2.3 Industrial Energy Management ... 12
3.3 Case Study 1: University of California - Santa Barbara (UCSB) ... 13
3.3.1 Case Study 1 Overview ... 13
3.3.2 Case Study 1 Incentive... 13
3.3.3 UCSB Monitoring System ... 14
3.3.4 UCSB Data Analysis Process ... 15
3.3.5 UCSB Control Measures... 16
3.3.6 Results from the UCSB EMS Project ... 17
3.4 Case Study 2: Sysco Corporation ... 17
3.4.1 Case Study 2 Overview ... 17
3.4.2 Case Study 2 Incentive... 18
3.4.3 Sysco Monitoring System ... 18
3.4.4 Sysco Analysis Process ... 19
3.4.5 Sysco Control Measures ... 19
3.4.6 Results from the Sysco EMS Project ... 20
3.5 Methodology Incentive ... 20
3.5.1 Financial Benefit ... 20
3.5.2 Process Implementation Comparison ... 21
3.5.3 Methodology and Case Study Similarities ... 22
Project Methodology ... 23
4.1 Chapter Overview ... 23
4.2 Planning ... 23
4.3 Consumer Motivation ... 23
4.3.1 Information Incentive... 24
4.3.2 Financial Incentive ... 24
4.3.3 Societies Benefits ... 24
viii
4.4.1 Electrical Component... 26
4.4.2 Communication System ... 27
4.4.3 Software Platform ... 28
4.4.4 Monitoring Equipment Installation ... 30
4.5 Data Analytics Process ... 30
4.6 Control Measures ... 31
4.7 Report System ... 32
4.7.1 Report Content ... 32
4.7.2 Generalised Trend Consumptions ... 34
4.7.3 Daily Consumption vs. Night Time Consumption ... 34
4.7.4 Base Load Calculation ... 34
4.7.5 Monthly Comparisons ... 35
4.7.6 Hourly Breakdown per Month ... 36
Results ... 37
5.1 Chapter Overview ... 37
5.2 Results Structure ... 37
5.3 Energy Consumption Results (Business) ... 37
5.3.1 Energy Monitoring Results (Business) ... 37
5.3.2 Energy Utilities Bill Results (Business) ... 41
5.4 Energy Consumption Results (Household) ... 43
5.4.1 Energy Monitoring Results (Household) ... 43
5.4.2 Energy Utilities Bill Results (Household) ... 46
Discussion ... 48
6.1 Chapter Overview ... 48
6.2 Consumer’s Initial Perspective... 48
6.3 Reduction Identification ... 49
6.3.1 Changes in Weather ... 49
6.3.2 Appliance Qualification and Quantification ... 50
6.3.3 Consumer Assistance ... 52
ix
6.5 The Consumer Learning Process ... 53
6.6 Consumer’s Final Perceptions ... 54
6.6.1 Time Frame Responsiveness... 54
6.6.2 Consumer Comparison... 55
6.6.3 Process Viability ... 55
Conclusion ... 57
7.1 Chapter Overview ... 57
7.2 Project Findings... 57
7.2.1 Consumer Energy Challenges ... 57
7.2.2 Energy Management Requirement ... 58
7.3 Recommendations ... 58
7.3.1 Monitoring Improvements ... 59
7.3.2 Data Analytics Process ... 60
7.3.3 Control Measures ... 61
7.3.4 Self Sufficiency Possibilities ... 61
7.4 Consumer Benefits ... 62
References ... 64
Project Specification ... 67
Project Timeline ... 68
Job Hazard Analysis ... 69
x
List of Figures
Figure 1.1: Electricity Consumption per Capita – Australia (Trade Economics, 2015) ... 2
Figure 1.2: Energy Management Process (Santarossa, 2015)... 3
Figure 3.1: EMS Diagram for UCSB Campus (Motegi, Piette, & Kinney, 2003) ... 14
Figure 4.1: Efergy Engage Hub Kit (Santarossa, 2015) ... 25
Figure 4.2: Engage Hub Kit Communication System (Efergy, 2015) ... 28
Figure 4.3: Efergy's Software Platform (Efergy, 2015) ... 29
Figure 4.4: Downloadable Report (Efergy, 2015) ... 29
Figure 4.5: Hierarchy of Controls (CDC, 2014) ... 30
Figure 4.6: Monthly Comparison Example (Santarossa, 2015) ... 36
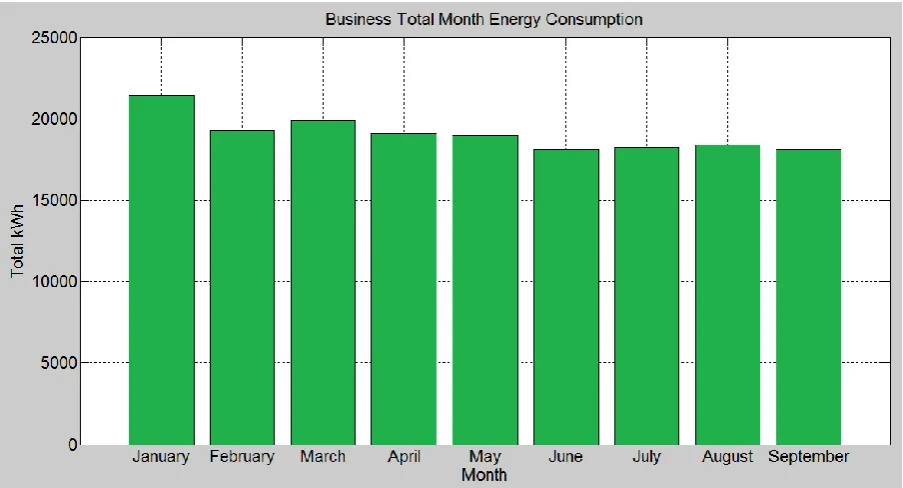
Figure 5.1: Business's Monthly Energy Consumption (Santarossa, 2015) ... 38
Figure 5.2: Business's Monthly Average Energy Consumption (Santarossa, 2015) ... 38
Figure 5.3: Businesses Load Profile Inefficient Vs. Efficient Month (Santarossa, 2015) ... 41
Figure 5.4: Business Utilities Measuring Consumption 2014 vs. 2015 (Santarossa, 2015) .... 41
Figure 5.5: Household's Monthly Energy Consumption (Santarossa, 2015) ... 43
Figure 5.6: Household’s Monthly Average Daily Energy Consumption (Santarossa, 2015) .. 44
Figure 5.7: Households Load Profile Inefficient Vs. Efficient Month (Santarossa, 2015) ... 45
xi
List of Tables
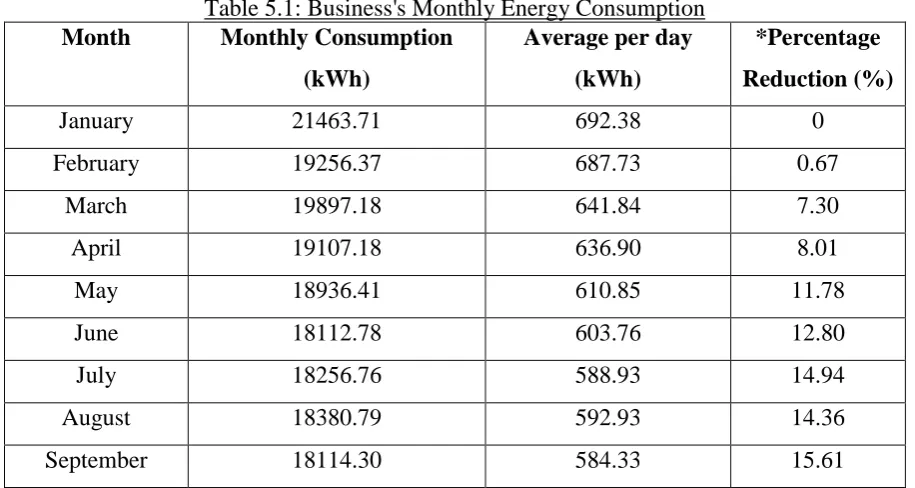
Table 5.1: Business's Monthly Energy Consumption ... 39
Table 5.2: Business’s Monthly Average Energy Consumption ... 42
Table 5.3: Household's Monthly Energy Consumption ... 44
Table 5.4: Business’s Monthly Average Energy Consumption ... 46
xii
List of Acronyms
CPR Cardiovascular Pulmonary Resuscitation EIS Energy Information Systems
EMCS Energy Management and Control System EMS Energy Management System
EEO Energy Efficiency Opportunities LAN Local Area Network
LVR Low Voltage Rescue
HVAC Heating, Ventilation and Air-Conditioning kWh Kilowatt Hour
NABERS National Australian Building Environment Rating System ROI Return on Investment
UK United Kingdom
UCSB University of California Santa Barbara UQ University of Queensland
1
Introduction
1.1 Project Background
One of the most common problems among energy consumers is that their electricity bills do not come equipped with sufficient information for a standard consumer to understand how
electricity is being consumed within their given premises. Electricity bills are a growing pain point amongst numerous electricity consumers within the domestic, commercial and industrial energy markets. In 2013, 24,000 homes in Queensland were disconnected from the network grid due to the fact that they could not meet the pressures of the rising electricity costs (Senior Australian, 2015). These rising costs have also placed significant financial stresses on businesses as well, with some small business owners moving their operations to their home because they cannot meet the cost demand of a second electricity bill.
The energy management concept aims to deliver more information regarding electricity consumption to assist consumers in reducing energy costs within their given premises. This project will explore energy management as a concept as well as deliver an innovative method of implementing the energy management process. It will explain the theoretical and technical aspects of energy management as well as deliver a practical assessment using standard electricity consumers.
Australia consumes approximately 10,719 kWh's per person per year (Trade Economics, 2015), which equates to an annual consumption of approximately 250 terawatt hours. A 5% saving across the country would provide enough energy to power 280,000 homes in Queensland for one year and would save the average consumer approximately $100 per year (Energy Made
2 Australia’s Energy Consumption per Capita Progression
Figure 1.1: Electricity Consumption per Capita – Australia (Trade Economics, 2015)
1.2 Project Objectives
There are two main objectives that this research project will aim to achieve. The first is to justify the viability of the energy management concept. Energy management, although not a simple process to implement, has been well known to provide great results toward energy reduction for electricity consumers (Energy Efficiency Exchange, 2013). Energy management is still a relatively new concept as far as the general electricity market is concerned however with electricity bills rising constantly and climate change becoming a constant growing worldwide issue, energy management is becoming more popular within our society as a means of an energy reduction strategy.
One of the great challenges of energy management is investing the right amount of funding for the optimal return on investment (ROI). Energy measuring technology can be expensive to install and the time spent in analysing data and implementing control measures can raise initial
3
1.3 Project Implementation
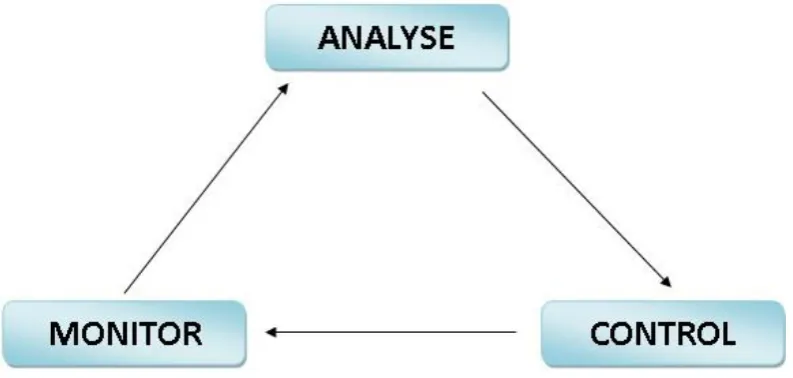
[image:15.595.101.498.161.350.2]The implementation of this project will be based around the three major steps of energy management. Figure 1.2 is a representation of the energy management process (Santarossa, 2015).
Figure 1.2: Energy Management Process (Santarossa, 2015)
The first step involves gathering a significant amount of data regarding the energy consumption of a given site or premises. This is achieved by installing energy measuring/monitoring devices,
acquiring previous electricity bills and establishing communication directly with the consumer. After sufficient data has been gathered, it is analysed to find where energy is being consumed in order to better understand the consumer’s energy behaviours. A plan is then devised to implement control measures in an effort to reduce the amount of energy consumed within the given site or premises. This process is then repeated and reviewed in order to gauge if the control measures put in place were successful as well as attempting to find more ways to increase the energy efficiency of the site or premises.
1.4 Project Overview and Timeline
This research project will run over the course of two semesters based on the University of Southern Queensland's semester timetable. The full project timeline is represented as a Gantt chart in Appendix B of this report.
1.5 Project Safety Considerations
4 still need to be taken into consideration throughout the course of the project. Risk and hazard assessments will be undertaken throughout the entirety of the project with any imminent safety concerns to be further assessed if the need arises. Part of this project will involve performing an installation around electrical equipment. This, along with all installations, will be performed by licenced and qualified personnel within the correct safety guidelines as required.
1.6 Project Structure and Content
The following is a list of the dissertation chapters as well as a brief explanation of the content
within each chapter:
Chapter 1 - Introduction: a brief overview of what the project entails as well as how it is going to be implemented.
Chapter 2 - Background Information: an in-depth explanation of energy management and an outline of the concepts behind energy management that make it a viable process.
Chapter 3 - Literature Review: explores how energy management has been utilised in a practical environment and how it has reduced energy consumption for given consumers. This chapter will be utilised as a base measure for comparison with the methodology.
Chapter 4 - Methodology: explains and delivers an innovative practical assessment of the energy management process tailored for the purposes of this research project.
Chapter 5 - Results: discusses the findings of the practical assessment. This will provide the required information to be able to discuss the successes and shortcomings of the project.
Chapter 6 - Discussion: evaluates the results and highlights the positives and negatives of how the project was implemented. The discussion will ultimately justify the viability of the
energy management process.
5
Background Information
2.1 Chapter Overview
This chapter will provide a detailed explanation of the theoretical background of the energy management concept and how it is implemented in a practical environment. It will also discuss
briefly some of the historical developments of energy management within our society.
2.2 Energy Management Definition
2.2.1 Planning
Every EMS begins with a plan. This assists in conceptualising the goals of what the consumer wishes to achieve regarding reductions of their own energy consumption and also allows a consumer to understand how the process is going to work. An EMS may contain, but is not limited to, the following criteria (Energy Efficiency Exchange, 2015):
1. A list of all parties involved in the process 2. A benchmark for savings
3. A budget and time frame 4. Monitoring technologies
5. Analysis strategies 6. Controlling strategies 7. Areas for savings 8. Predicted savings
The above criteria lay the platform for a quality EMS. It is highly important during the planning
phase to justify the feasibility of implementing an EMS as the budget must give an ROI over a defined time period. This will not become completely clear until the EMS implementation has begun but still needs to be accounted for nonetheless.
2.2.2 Monitoring
6 an insufficient amount of equipment installed, then inadequate data will be captured for the analysis phase of the process. However if the amount of equipment installed is overcompensated, it can become a costly assignment which may make the process less viable from a financial perspective.
More often than not, the best strategy is to not over-invest in monitoring equipment in the initial stages of the energy management process. Monitoring devices can be expensive to both purchase and install. Ultimately, the monitoring technology selection is limited to the EMS
budget, the amount of data required to be captured, the resources of the given premises and the desired outcomes of the site consumer.
2.2.3 Data Analysis
Of all the stages of the energy management process, analysing the data can often be the most challenging from an engineering perspective. It is during the data analysis phase that all of the data gathered from the monitoring system is to be correlated and presented into a format that a regular consumer can understand. However every consumer site, and as well as a consumers understanding of energy consumption, is different and this can make the data analysis process difficult to execute.
Once the monitoring equipment is installed, the site consumer is committed to investing both funding and time into the EMS. Unlike the fixed pricing of installing monitoring equipment, the analysis process can vary significantly in price. A fixed price for data analysis will often come in the form of a standard report and this may not be enough information as a one off transaction for a site consumer to utilise for controlling their energy consumption over a long-term period. This project will attempt to implement a more time and cost efficient method to deliver the analysis phase of the energy management process to ensure better results for the
end consumer.
2.2.4 Controlling
7
The reduction strategies must not compromise on the correct operation of the site or
premises.
Acquisition and installation of new equipment must be financially justified.
Reduction strategies requiring large capital must come with a calculated return
on investment time frame.
Producing a quality report during the data analysis phase will make the controlling phase simpler to implement. As well as having reduction strategies, the report should also have within it predicted outcomes for every strategy listed. Although this is mostly an estimate, it is a clear indication that there are areas for savings as well as quantifies what those savings could potentially be.
2.2.5 Review
Reviewing the energy management process after a given time period will provide a measure on whether the system was a success or if there were any short comings. It is then the responsibility of all parties involved to find out why the EMS implemented either succeeded or failed and how it can be better executed once the process is repeated.
Occasionally, consumers will only have sufficient funding to perform the energy management process once. However in order for an energy consumer to fully benefit from an energy management process, it is typically a long-term project. Regardless of the success or shortcomings of the process after the first review, a typical EMS will be an on-going process, aiming to find more ways to reduce both energy consumption whilst eliminating the potential for complacency. A standard consumer is most likely to be motivated to part-take in an energy management process when their electricity bill arrives. It is important for a consumer not to slip into a state of complacency toward their electricity bill once they have started the energy management process. Control measures can easily be forgotten due to simple complacency so it is critical to keep reviewing the energy management process to ensure energy costs are kept to a minimum.
2.3 Energy Management History
8 began creating an energy saving mentality during the oil crisis of 1973 (Fawkes, 2001). Lack of fuel meant that energy costs rose dramatically throughout the 1970’s and energy
management was looked upon by organisations and people alike throughout the country as a means of energy reduction. During this time the energy management concept was also adopted throughout other parts of the world, with the University of Michigan receiving funding from the Department of Education (DOE) to perform energy audits of their campus beginning in the late 1970’s (University of Michigan, 2013).
By the 1980’s, it was becoming more evident that societies electricity would inherently be
generated off non-renewable sources for a long time to come and this was having dramatic effects on the environment. Inflation and other costs associated with generating and distributing electricity continued to rise and with it came a greater demand of reducing energy consumption. During this time period, energy management started to become its own discipline throughout the UK, with the UK government assisting regional energy management organisations in distributing information regarding the need to reduce energy and how this could possibly be achieved (Fawkes, 2001).
Another great development throughout the 1980’s was the development of energy measuring
technologies that assisted in capturing energy data. This time period saw a dramatic rise in the personal computer industry and with it came an abundance of technological advancements that could be utilised within the energy management field. Monitoring and Targeting (M&T) systems were starting to be utilised throughout the UK. This meant they could begin to monitoring and control heating and cooling systems throughout large buildings, allowing for better energy information gathering possibilities. It also allowed for automated systems which reduced the requirement of human effort to decrease energy consumption (Fawkes, 2001). With this came the demand for more specialist personnel to run energy management projects and
organisations started to hire full-time Energy Managers/Engineers to meet this demand (University of Michigan, 2013). Over the years these technologies have continued to develop
and the market now offers a wide range of solutions in the energy management space, everything from self-implemented energy monitors to energy management companies who will establish their own EMS’s for third party consumers.
10
Literature Review
3.1 Chapter Overview
This section of the report will discuss pre-existing instances of energy management processes as well as how the concept is being both utilised and implemented within society. Climate
change and rising energy costs have increased the demand for energy management processes and it is utilised across the residential, commercial and industrial energy markets. This section of the report will discuss instances and occurrences of energy management across these markets, covering a broad spectrum of energy management in generalised terms.
This literature review will also discuss two real-world case studies of energy management at a greater depth. The case studies discussed will demonstrate how consumers implemented their own EMS's and will provide the outcomes of their given processes. Each case study had their own energy management challenges and hence had their own EMS implementation.
3.2 Energy Management Scope
Energy management is designed to protect the climate, conserve resources and save consumers on energy costs (Wikipedia, 2015). The global energy market is a six trillion dollar per year industry and the generation of electrical energy can have adverse effects on our environment (Commerce Gov, 2015). Demand to reduce energy consumption in this day and age is prevalent across all types of consumers be it residential, commercial or industrial and each type of consumer has their own energy management challenges.
3.2.1 Residential Energy Management
One of the greatest challenges of energy management within the residential market is that emotion is generally tied to a person’s behaviours. With household budgets growing tighter,
11 Within the marketplace, there is copious amounts of information available that gives a consumer better ideas on how to save on their energy costs. Research has proven that behavioural science can be utilised to assist in reducing energy consumption (Allcott, 2010). Opower is an industry leader in energy management having saved the average consumer within their customer base 2.5% on energy consumption (Wikipedia, 2015). This is achieved by analysing data from over 400 billion meter reads across 50 million energy consumers throughout the world (Opower, 2015).
Research lead Opower to prove that saving money, becoming energy conscious and reducing carbon emissions were not proven motivators in making people responsive to reducing their energy consumption. Instead, they began informing their customers of how their energy consumption compared to that of their neighbours, after which people began to respond to the energy management information that was delivered to them (Opower, 2015). It thus proves that human beings need to be nudged in the right direction rather than persuaded and that the right information holds the highest level of importance for motivating a consumer to take action toward reducing on their electricity bill (Allcott, 2010).
Opower’s research and their energy information system (EIS) is not the only proven approach
toward educating consumers about their energy consumption. The Queensland government utilised real time monitoring technologies to show residential consumer’s how their energy consumption changed as they turned particular appliances off and on in their household’s (Efergy, 2015). The Climate Smart Home Service scheme was a program that ran throughout the state of Queensland for four years and reduced 344,000 homes an average of $400 per household totalling to 3.173 GWh’s. Similar results were delivered in Sabadell Spain, with
in-home energy displays assisting in producing energy efficient behaviours and reducing the average consumer 14.3% in energy costs (Efergy, 2015). This program was delivered by
Sabadell City Council and helps to prove the theory that more information can assist in reducing a consumer’s energy consumption.
3.2.2 Commercial Energy Management
12 campus more energy efficient in 2010. This was heavily influenced by the Energy Efficiency Opportunities (EEO) program run by the Australian Government (Energy Efficiency Exchange, 2013). Through implementation of EMS’s, employing campus staff and thoroughly planned retrofits, UQ predicted campus-wide savings of 20% with a payback period of two years (Energy Efficiency Exchange, 2013).
Energy reduction policies can also assist in motivating commercial building owners and operators to acquire an EMS. The National Australian Building Environmental Rating System
(NABERS) accreditation sets a benchmark for the efficient operation of commercial buildings and also offers this type of consumer other possibilities of becoming more energy efficient (OEH, 2012). NABERS accreditation also encompasses the capabilities of acquiring an energy management/information system which assist’s in the continual implementation of the energy management process. There are numerous opportunities within a commercial building to reduce energy consumption especially within the monitoring and optimisation of heating, ventilation and air-conditioning (HVAC) systems (Berkeley Lab, 2015). The implementation of EMS’s are more financially viable in today’s energy market and must be considered when constructing or re-fitting any type of commercial building.
3.2.3 Industrial Energy Management
As electrical infrastructure demand increases for the operation of a particular plant, so too does the cost of running such a plant. The historical rise of electricity prices in the early 1990’s gave the industrial energy market within Australia a major incentive to start implementing energy management processes (The Warren Centre for Advanced Engineering, 2015). Development of automation technologies have proven vital in optimising the operation of industrial plants throughout the world. With the ever growing demand to reduce energy consumption, these same technologies can be utilised to better manage the energy consumption of a given industrial
plant (The Warren Centre for Advanced Engineering, 2015).
13 The industrial market has also utilised data analytics to manage energy consumption. Reducing energy consumption can be achieved through the energy management process by understanding how particular industries operate and where the potential for reductions can occur (Climate Works, 2013). The greatest inherent challenge with energy management in the industrial energy market is justifying reduction opportunities as most high energy consuming machinery is required for the correct operation of the plant. However industrial plants can operate within their correct means and still be energy efficient, as the potential for $1.2 billion
of energy savings could be realised throughout industrial plant operations within Australia alone (Climate Works, 2013).
3.3 Case Study 1: University of California - Santa Barbara (UCSB)
3.3.1 Case Study 1 Overview
The University of California, Santa Barbara (UCSB) met the right criteria as a particular site that could part-take in an energy management process. The university had already proven to be proactive in energy management processes that were undertaken across the campus. On top of already having a full-time energy manager who was highly motivated in reducing the campuses carbon impacts on the environment, it also had a pre-existing EIS that they utilised for gathering energy data. Being so motivated to reduce their energy consumption, UCSB raised a sum of capital to invest funding into the energy monitoring infrastructure to expand upon their pre-existing EMS (Motegi, Piette, & Kinney, 2003).
3.3.2 Case Study 1 Incentive
One of the great advantages UCSB had in their favour to implement an EMS was their pre-existing energy management control system/energy information system (EMCS/EIS). It provided the base technological infrastructure to implement an EMS and allowed the university
to capture a significant amount of data regarding the campuses energy consumption. This data would assist in providing vital information during the data analysis phase of the project. Be it
that UCSB is a large university campus, a significant amount of data was required to be captured in order to perform a thorough analysis.
14 responsibility to run the energy management project, analyse the incoming data with the assistance of other campus staff and implement control measures to reduce energy consumption. Energy management is still a developing concept and specialists in the area can prove difficult to employ. UCSB’s energy manager displayed enthusiastic behaviour toward energy management at the campus which is a great advantage to the university or any organisation undertaking any form of energy management project (Motegi, Piette, & Kinney, 2003).
3.3.3 UCSB Monitoring System
[image:26.595.81.518.348.563.2]UCSB had a great deal of pre-existing energy management infrastructure prior to developing their tailored EMS. Figure 3.1 (Motegi, Piette & Kinney, 2003) displays a diagram of the overall energy monitoring and controlling infrastructure at UCSB.
Figure 3.1: EMS Diagram for UCSB Campus (Motegi, Piette, & Kinney, 2003)
15 Along with the already existing technologies at the campus, the university added 30 electricity meters and 20 gas meters to the system in order to capture more data regarding their energy consumption. Also added onto the EMS were additional computer systems with monitoring software and licencing fees. Extending the EMS monitoring system cost UCSB approximately $341,000 in capital expenditure, $226,000 of which was provided by public funding (Motegi, Piette, & Kinney, 2003). The additional monitoring infrastructure captured more information on energy consumption within the UCSB campus which would become highly important during the data analysis phase of the process.
3.3.4 UCSB Data Analysis Process
UCSB had a full-time team of employees that were responsible for the energy management of the university campus. The staff consisted of, but were not limited to, the following personnel:
One energy manager
One facility manager
Several zone managers
The energy manager, along with the assistance of the facility manager, are responsible for running the energy management process at the UCSB campus. They utilised the EIS and EMCS on a regular basis to optimise the efficient running of the site campus. Once the energy data has been analysed, the energy manager can then delegate specific energy management responsibilities to the zone managers. The zone managers are responsible for system operations and troubleshooting of their buildings within their specific zones (Motegi, Piette, & Kinney, 2003).
Although there were numerous staff involved in the operations and maintenance of the campus, the energy manager was solely responsible for the data analysis portion of the energy management process. He would spend at least 30 minutes per day analysing energy data captured by the EMCS. This time would be extended when control measures were put into
place to find if they were reducing energy (Motegi, Piette, & Kinney, 2003).
16 data between buildings to clearly identify why some buildings were consuming more energy than others. The software also provided data on energy consumption on an hourly, daily, weekly and monthly basis, shorter time frames with which to test control measures against rather than waiting for the next electricity bill.
3.3.5 UCSB Control Measures
Control measures that were executed at UCSB included, but were not limited to:
1. Reduction of physical science building fan runtime 2. Reduction of chemistry building fume hood runtime
Reducing the fan runtime in the physical science building began soon after the EMS was implemented at the UCSB campus. The energy manager became pro-active in implementing control measures to reduce energy consumption. After analysing the data captured regarding the energy consumption in the physical science building, it was found that the exhaust fan system, totalling 262 kW, was running 24 hours a day at 100% load, even though the building was unoccupied at night.
Under normal circumstances, the runtime of the exhaust fan system would already be controlled by a setback system. However the setback system was disabled by building staff to ensure sufficient air quality throughout the building. This presented the energy manager with one of the significant challenges of energy management, which is to implement control measures that do not compromise on the correct operation of the building.
After consulting the building staff, the energy manager convinced the staff to run the fans at 50% between the hours of 12am to 7am. As a result, UCSB saved $92 per day in energy
consumption, all within a few short months of undertaking the energy management process. The air quality was still sufficient within the building so reducing the load to 50% was one
strategy that reduced energy consumption.
17 a control measure that requires on-going human effort and can be easily forgotten due to simple energy management complacency.
These two control measures that were applied at UCSB provide very important insight into the feasibility of energy management. With VSD and automation technologies, reducing the fan speed is a relatively simple control measure to execute. The facility manager just has to set the values into the system and energy is reduced with minimal on-going human effort required. However the fume hood is a different control measure, where every day, students are to remain
pro-active in closing the fume hoods in order to reduce energy. This can easily be forgotten due to simple complacency and is proof that not every control measure is going to be simple to execute or even prove successful in reducing consumption.
3.3.6 Results from the UCSB EMS Project
UCSB recorded electricity cost savings of $430,000 in general consumption and $160,000 in demand costs. From all of the data analysis performed at the UCSB campus, the energy manager was able to provide valuable insight that 50% of energy savings came from optimising the operation of electrical infrastructure within the building. This could be implemented due to the information provided by the EIS. The total savings that were attributable to the EIS within the first year was $295,000, which meant there was a payback period of 1.2 years (Motegi, Piette, & Kinney, 2003).
These savings were realised through control measure strategies such as those listed in section 3.3.5, thoroughly planned retrofits and installation of energy efficient lighting. From constant data analysis, the energy manager was able to focus on key areas where energy could be saved and as a result, it reduced energy consumption costs by 10.8% in 12 months. This is the typical result of a successful EMS and thus proves both the importance and viability of the monitoring,
analysis and controlling process.
3.4 Case Study 2: Sysco Corporation
3.4.1 Case Study 2 Overview
18 due to the fact they had people involved who were highly engaged with energy data and in energy management, they were aggressive toward energy reductions and high-efficiency performance and they were willing to participate in 3-4 hours of site visits (specific site would be chosen at the time) and interviews, opening the door to the thorough communication that an EMS requires when different parties are involved (Granderson, Piette, & Ghatikar, 2010).
3.4.2 Case Study 2 Incentive
Sysco set themselves a company-wide target of a 25% energy reduction across 143 of their
distribution sites. As well as making the business more profitable, the energy reduction strategies across all of the sites gave Sysco a positive company image with the general public. It was heavily assisted from a technical perspective by a third party engineering firm with whom they already had a services contract.
Site visits were conducted by the engineering firm with assistance from Sysco employees in the initial stages of the energy management project. The EIS was then tailored for the specific energy reduction targets that Sysco were trying to reach. All of this action was followed by constant on-going communication between Sysco management, the engineering firm’s engineers and the elected Sysco on-site energy champions. This re-iterates one of the most important aspects of energy management - that it is an on-going process with a high-level of commitment required by all parties involved in order to achieve positive results.
3.4.3 Sysco Monitoring System
Energy data from Sysco sites is captured via pulse outputs from electricity utility meters and is captured in a central database. The engineering firm has the ability to upload data to a server regarding Sysco’s energy consumption to keep track of whether or not the goals are being met. Sysco’s site EIS has reporting capabilities which also assist the Sysco employees during the
analysis phase of the energy management process. The Sysco monitoring system was simpler to implement and more affordable to acquire due to the fact they required less monitoring
19
3.4.4 Sysco Analysis Process
Data analysis for the Sysco sites is performed by a combination of both Sysco staff and the corporation’s third party engineering contracting firm. Each site has an energy champion who
is responsible for the energy consumption of that given Sysco outlet. This employee is able to acquire and analyse the data and then liaise with the engineering firm and Sysco management in order put forward the best plan to optimise energy efficiency throughout the Sysco site.
This differs from the analysis process implemented in case study one. The energy management
process that was undertaken at the University of California Santa Barbara campus had a much larger site with many more variables present. Analysing data across the Sysco sites was a shorter process, leading to the implementation of control measures in a shorter time frame. A second advantage Sysco Corporation had in their favour was that they had 143 distribution sites all holding similar electrical infrastructure. This meant that a control measure implemented at one site could be implemented across most sites, allowing for scalable reductions across the entire company.
3.4.5 Sysco Control Measures
When deciding on the best course of action to take to reduce energy consumption, Sysco focused heavily on their refrigeration units that held the stock that was sold to customers. Staff found that the stock was able to tolerate temperature changes within a specific range for a certain period of time. The company believed it viable for the energy champion to spend their mornings adjusting these temperature settings to reduce refrigeration costs. An important aspect to consider regarding this control measure was the extra overhead it could potentially place on the operation of the company. Although there was potential for reductions, this control measure required human effort which may take employees away from other operations within the business. However, be it that refrigeration was such a dramatic cost in electricity toward
the running of the business, they believed it viable to utilise company staff to implement such a control measure.
20 Sysco believed it to be viable to investigate such spikes in an attempt to find what electrical infrastructure was causing such a problem.
3.4.6 Results from the Sysco EMS Project
Adjusting the temperature of the refrigeration units assisted in reducing Sysco Corporations energy consumption. The effort the energy champion at each site went through to adjust the temperature settings was worth it as it reduced energy costs significantly throughout numerous Sysco sites. There was one time period where one particular energy champion was on holidays
and that specific site increased their energy consumption back to the point it was at before the refrigeration control measure was implemented. Accounting for the spikes also allowed for other energy reductions and increased site efficiency with Sysco seeing energy reductions of 35%.
Without taking the effort to implement an EMS, Sysco would have continued to waste electricity, placing larger costs on the running of their business. A company such as Sysco can take particular strategies utilised at one store and use those same strategies throughout other stores. This goes a long way in not only making the Sysco business more viable but also building a positive company image with the general public. Until such a day arrives that all energy can be run off renewable sources, utilising human effort to reduce energy consumption can go a long way in reducing societies energy demand.
3.5 Methodology Incentive
3.5.1 Financial Benefit
The case studies of UCSB and Sysco Corporation are large scale projects that require significant capital in order to be economically viable. Funding for this type of venture is justified as the amount of energy (and hence money) saved is scalable and makes the long-term
running of the sites and buildings more efficient. However on a smaller scale, it is difficult for a home or small business owner to justify investing funding into an EMS. The costs and time
21
3.5.2 Process Implementation Comparison
As this research project is a smaller scale energy management project, the way in which the process is implemented differs significantly from the UCSB and Sysco Corporation case studies. Although it still follows the standard monitor, analyse and control paradigm, the way in which the project was implemented varies significantly.
UCSB and Sysco invested significant funding into monitoring hardware to ensure there was a large amount of energy data captured. This funding came from third party investors as well as
income that was generated internally by the organisations themselves. Although they were investing funding back into an EMS, it was justified to make their organisations more energy efficient. A significant difference between the methodology and the above mentioned case studies was the amount of monitoring hardware that was acquired for the project. A major incentive for this research project was the overall aim of doing more with less and it begins with the acquisition of monitoring equipment.
A reduction in monitoring hardware meant that the data analysis phase had to be more robust and efficient. UCSB and Sysco had a full-time team of staff whom were fully or partially responsible for the energy analysis portion of the energy management process. This is less viable in a low-end cost consumer market. Small businesses and home owners do not have within their site or premises the same potential or scalability for savings that make it justifiable to hire an energy manager to spend time analysing their energy data. The energy manager at UCSB spent a great deal of time (at least a half an hour each day) analysing energy data which can easily increase the overheads of the business.
The analysis phase of the methodology will explore the information that consumers respond to that can be potentially compiled through an automated system utilising computer technology.
Once there is modularity to the information and it is beneficial to the consumer, it can be easily duplicated and distributed in an efficient manner with less time spent reading energy data. This
projects scalability is a smaller margin so it has to be performed more efficiently time-wise than a larger scale project such as the UCSB and Sysco Corporation’s energy management projects.
22 Every business or household run differently and different consumers utilise their electricity in different manners. The energy controlling strategies in the methodology are going to differ to that of a large corporation as how and when they consume their electricity is going to differ significantly. However the basic human behaviour principle still exists in that people can take better control of their energy consumption if they are equipped with the right information.
3.5.3 Methodology and Case Study Similarities
Although there are significant differences in the way the methodology and case studies are
implemented, there are also similarities between any large and small scale energy management processes. The major incentive for any energy management process is that be it a small or large building, from an end user perspective, electricity bills are still unequipped with vital information to help consumers understand where their energy is being consumed. The reason a site consumer invests time and funding into an EMS is that they are wanting to find out more information regarding their energy consumption so they can find ways to reduce energy over the long-term.
23
Project Methodology
4.1 Chapter Overview
This section will discuss the practical assessment that was undertaken throughout the research project. It will follow the standard monitor, analyse and control process of an EMS. The process
will be tailored to the needs and demands of the energy consumer’s premises’ where the EMS was implemented.
4.2 Planning
Two test sites were utilised to facilitate the EMS process for the methodology. Test site number one was a seven day a week business whose operating hours were from 7:00am to 5:00pm. The business has a cafe and also sells grocery items which make up the combination of their main line of business. Electricity is a significant overhead for the business with energy consumption being one of the biggest expenditures toward the running of the business only second to wages. An agreement was put in place with the site consumer to conduct research at the premises to allow for sufficient information gathering as required.
Test site number two was a standard three bedroom household owned and occupied by a family of four (two adults and two children). This site was chosen due to the fact that the home owner’s energy consumption was approximately three times more than that of the Queensland state average. Electricity is a large cost to the family of four and the consumers were highly motivated to investigate possible methods to reduce their energy consumption.
4.3 Consumer Motivation
24
4.3.1 Information Incentive
Without being equipped with the right information it is extremely difficult for a consumer to understand why their electricity is so high and how this consumption can be reduced upon. Ergon Energy, the electricity network provider for regional Queensland, do provide their consumers with energy reducing information to assist them in adopting energy efficient behaviours through television advertising, delivery of pamphlets in the mail and also on their company website. However whether this information is received and understood is questionable as both consumers who undertook this project EMS had at some stage in the past
taken it upon themselves to contact their provider to try and understand why their electricity bills were so high and how it could be reduced upon. The extra information the consumers were to receive from the process would be beneficial for making better informed and justified decisions toward their energy consumption.
4.3.2 Financial Incentive
The obvious reason any consumer would part-take in an energy management process would be for financial benefit. However this financial benefit cannot be reached without first understanding how energy is being consumed within a premises. Numerous small businesses and households alike in today’s world run on very tight budgets and for some people, even the
smallest of savings can go a long way in assisting consumers live better lives. It is this financial incentive that can help motivate a consumer to part-take in an energy management process and implement actionsin that will assist reducing their energy consumption. The other significant aspect of this energy management process is that there was the inherent opportunity to assist consumers in reducing on their energy costs without having to invest up-front capital costs by either purchasing new equipment or investing in alternate sources of energy such as solar power.
4.3.3 Societies Benefits
Although it is not the greatest motivator, one of the adverse effects of energy management is
25 can have in creating a more energy efficient society. By contributing toward reducing on their electricity bill, a citizen is also helping to reduce carbon impacts on the world.
4.4 Acquisition of Monitoring Equipment
Acquiring the correct monitoring equipment for this research project presented two major challenges. The equipment had to gather sufficient data in order to conduct a thorough analysis whilst ensuring the project would remain economically viable. In the early stages of the project, and being that this project was self-funded, time was dedicated to testing the monitoring
hardware to ensure it would perform to a specific standard for the purposes of this project.
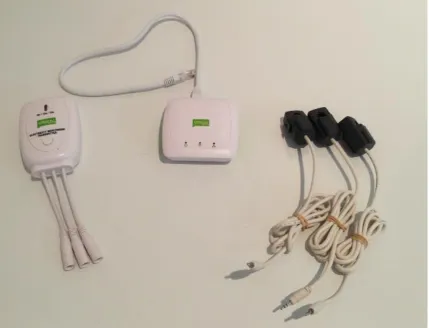
[image:37.595.84.514.411.739.2]After researching different types of energy monitoring technologies, the monitoring equipment chosen for this project was the Efergy Engage Hub Kit pictured in figure 4.1. The Engage Hub Kit was utilised across both test sites. At a retail cost of $199.95 including batteries, the Engage Hub Kit has no on-going maintenance costs or subscription fees, making it an affordable solution for the purposes of this research project.
26 As well as being a low cost solution for gathering energy data, the Efergy Engage Hub Kit was also chosen for the following criteria:
1. Real-time feedback capabilities
2. Energy data logging with a one minute resolution 3. Hourly, daily and monthly data logging
4. Data download capabilities for MATLAB integration 5. Simple installation with no interference of wiring required
There are three separate components of the Engage Hub Kit. These have been split into electrical, communication and software to further explain the operation of the product.
4.4.1 Electrical Component
Data captured by the Engage Hub Kit is displayed numerically in units of either power, energy or cost. This data is captured by utilising the following mathematical equations:
Energy (kWh) = Power * Time__________________________________(1) Power (kW) = Voltage * Current________________________________(2)
The time is constantly monitored by a computer system and is multiplied to the power input from the kit in order to calculate the value for energy. Equation (2) is calculated from a constant value and a variable value. Current varies between consumer sites and is measured from the current transformers (CT's) pictured on the right-hand side of figure 4.1.
The CT's are clamped around the mains cable (where the mains are 25mm² or less in cross-sectional area size) with the tails plugged into a transmitter pictured on the left-hand side of
figure 4.1. Installation of the engage hub kit will be explained further in section 4.4.4.
27 captured by the Engage Hub Kit can also be calibrated during the analysis phase by comparing its data to the data captured by the electricity provider.
4.4.2 Communication System
Similar to any EMS, the Engage Hub Kit has its own communication system that binds all of the hardware together to ensure the data reaches the end user in an efficient manner. As well as supplying products that have data logging capabilities, Efergy also manufacture products with real-time feedback where the data is transmitted directly to an in-home energy display
monitor. However the benefits of historical allow for better information correlation as well as graphical analysis and comparison. There is much more versatility in gathering historical data but in order to do so, a robust and efficient system must be implemented in order to ensure that quality data is being gathered.
The tail end of the communication system is in the mains switchboard of the site or premises being monitored. A battery powered transmitter is located in this switchboard and gathers the current consumption data measured from the CT’s. Sometimes this componentry can be placed
in a sub-distribution board if the mains switchboard is physically too far from the premises being monitored. Obstacles and distance can be another issue that may need accounting for as the transmitter must communicate to another Engage Hub Kit component known as the hub.
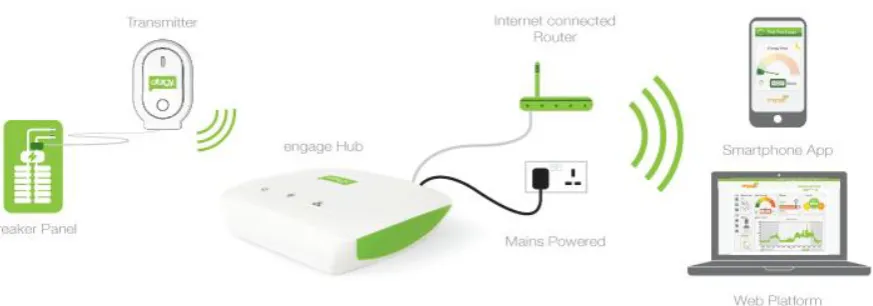
The hub, which is pictured in the centre of figure 4.1, is the central component of the EMS. All of data gathered by the transmitter is transmitted to the hub at 433MHz in either 6, 12 or 18 second intervals. This wireless transmission is what can cause communication problems. Ideally the hub and the transmitter should be no more than 50 metres apart from each other with minimal obstacles for clear transmission. Low quality batteries in the transmitter can also cause communication problems so these are all important considerations when performing
installation of the Engage Hub Kit. If a quality installation is not performed, parts of data can be missed and this can be critical from a data analysis perspective. Fortunately for this research
project, both test sites did not have any major distance or obstacle issues which made for quality data transmission between the transmitter and the hub.
28 a monitored site usually comes in the form of a standard internet router and is the gateway for the hub to transmit its data to a central database. Each individual hub stores its data into the database where it can either be downloaded by individual users or utilised by software developers to create platforms to neatly display the data. Although there are added complexities in transmitting data in such a manner rather than just offering real-time feedback through a display monitor, all of this historical data can offer much more versatility in the types of data that can be delivered to a consumer. A visual representation of the overall communication system can be found below in figure 4.2 of this report.
Figure 4.2: Engage Hub Kit Communication System (Efergy, 2015)
4.4.3 Software Platform
29 Figure 4.3: Efergy's Software Platform (Efergy, 2015)
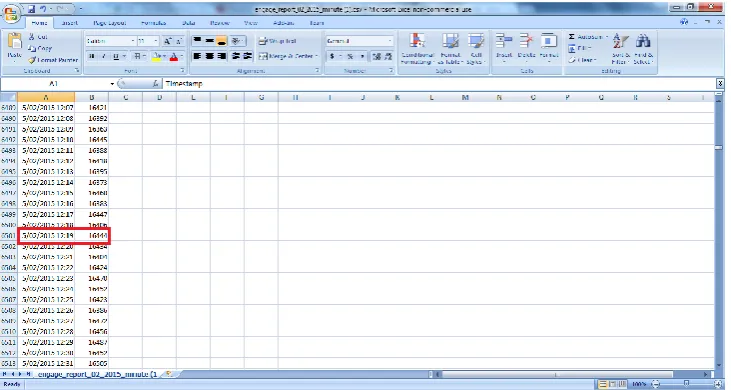
The software platform provides limited information for the consumer and was not the main focus for the data analysis phase of the energy management process. The important feature of the engage platform was the reporting tool. This allowed .csv files to be downloaded which could be then copied into an excel spreadsheet for further analysis. Figure 4.4 displays an example of the downloadable .csv file with an average kW value for a one minute period and a corresponding timestamp.
[image:41.595.116.482.543.738.2]30
4.4.4 Monitoring Equipment Installation
The monitoring equipment acquired for this project was required to be installed onto both test sites. Part of the installation process required working around live electrical conductors. For this reason the installation was performed by a licenced and qualified electrical tradesperson with the assistance of a safety observer and the correct personal protective equipment (PPE). The following is a list of the qualifications required in order to perform the installation.
Certificate III in Electrotechnology (QLD Electrical Licence, Tradesperson only)
[image:42.595.164.427.317.489.2] CPR/LVR Training
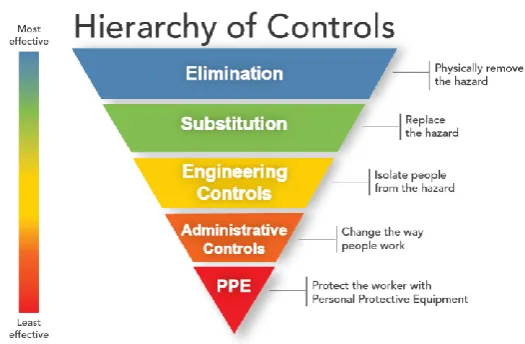
Figure 4.5 displays the hierarchy of controls when undertaking a risk assessment regarding a given job or task.
Figure 4.5: Hierarchy of Controls (CDC, 2014)
Installation had to be performed during business operational hours and as a result, isolation of electrical equipment was not feasible for the given procedure. However with the correct safety pre-cautions in place and after a thorough assessment of all potential risks and hazards associated with performing such tasks, it was deemed safe to perform the installation as long as all safety measures were accounted for. A full copy of the job hazard analysis (JHA) can be found in Appendix C of this report.
4.5 Data Analytics Process
31 built code via a software program in order to compile and correlate the energy data into a tailored format for a regular energy consumer to be able to understand. The program chosen to analyse the data was MATLAB, a high level technical computing language which is utilised mainly by university students throughout the world for engineering coursework. It has a high level of functionality however it was mainly chosen for its ability to read data from an excel spreadsheet and output data in a neat and efficient manner.
The main goal of the data analysis process is to present the data in such a manner that it is
easily understood by a regular energy consumer. A full-time energy manager will be able to understand different levels of energy information compared to that of a standard consumer. This is why the data analysis phase for this project has such a high level of importance placed upon it. The data needs to be presented back to the end client in a user friendly manner so they can make the best possible decisions in reducing their energy costs.
The data that is logged in the downloadable .csv file, such as that displayed in figure 4.3, is the average power consumption of the given site or premises over a one minute interval for every minute of a given month. For a standard 30 day month, there are 43200 data points to consider for analysis, 44640 for a 31 day month and 40320 for the month of February. It is the ability to re-structure this data by utilising the MATLAB software platform that allows information to be compiled into such a format that is beneficial for a standard electricity consumer to evidently show areas where electricity is being consumed, how they can save money or if the consumer’s behavioural changes are having a positive effect. The type of data displayed to the consumer as well as how this data is beneficial to a consumer will be explained further in section 4.7 of this report.
4.6 Control Measures
The report delivered to the consumer had within it further information on energy consumption which opened discussion for potential control measures and areas for savings. Referring back
32 cooked within it. Another example is turning the air conditioners down or even off which may compromise on the comfort of the customer experience and could potentially turn away more business.
All potential control measures discussed with the business and home owners were only general recommendations based on the information presented. The site consumers were ultimately responsible for implementing the controls measures recommended from the reporting portion of the process. This may differ from other EMS’s where a third party consultant may be
responsible for both analysing data and implementing control measures.
4.7 Report System
4.7.1 Report Content
Daily operations within a small business differ from that of a standard household. The type of data a household consumer may find beneficial can differ significantly from the information required by a small business owner. The difficulty in the reporting section of the energy management process is ensuring the data is transparent so that a regular consumer can understand it. In order to be able to implement justified control measures, the consumer must be able to firstly understand areas where they can potentially save themselves energy without compensating on the standard operations of the business or household. The purpose of the report is to make these potential areas evident and teach the consumer more about their energy consumption than what they already know.
Another consideration that must be taken into account during the reporting phase is the time frame that the report is to be delivered back to the consumer. For the purposes of this research project, information regarding the energy consumption had to be presented in a short enough time frame so that the consumer could remain pro-active toward their energy management
process and find out whether or not the control measures implemented were viable whilst not becoming too great a distraction from other important aspects of their business or general
33 The iterations of the report also meant that the original content that was delivered to the consumer differed significantly to the content that is required in an on-going report. There were two major causes for the continual change in content within the report. Reason number one involved the amount of time that a standard electricity consumer has to consider learning more about their electricity bill. Day-to-day operations make it difficult for a home or business owner to spend time researching how they can potentially reduce the cost of their electricity.
This idealism also holds true within a household, with many general consumers leading very
busy lifestyles with work, household chores and leisure on the weekends that allowing time to spare learning more about their electricity consumption is often scarce. For this reason, the content delivered had to resonate with the consumer with very little explanation to ensure the time invested in learning more about their electricity bill was justified.
Reason number two for the iteration of the content came from the on-going learning process involving both the consumer and the content provider. As time went on throughout the research project, both the site consumer and content provider learnt more about the sites’ energy consumption. This meant that new ideas arose as to how to gather and deliver more information. It also meant that the content became more of a comparative tool, with the site consumer being able to see whether or not improvements were made. Comparative information allows a consumer to ultimately see whether or not their efforts are rewarded by evidently displaying the results from the control measures implemented.
The report content included a combination of the following criteria for both the small business and the household:
1. Generalised trend consumptions
2. Daily consumption vs. night-time consumption 3. Base load consumption
4. Monthly comparison
5. Hourly breakdown per month
34
4.7.2 Generalised Trend Consumptions
In the beginning of the energy management project, the data delivered to the consumer was more generalised than comparative. Displaying general data trends to an end consumer allowed them to conceptualise how particular appliances were contributing toward their electricity bill. In order for a consumer to understand how to save money on an electricity bill, they must first familiarise themselves with how they are currently consuming their electricity. The kilowatt-hour (kWh) is the amount of power consumed over a one kilowatt-hour time period. If a consumer is able to familiarise themselves with this concept, they can better focus their time and energy in
particular areas to save energy.
For example, a kettle is a high powered appliance that if boiled twice a day consumes approximately 12kWh’s over the course of one billing period (Santarossa, 2015). This equates
to a cost of approximately $4 (based on Queensland electricity prices) and is the equivalent of running one standard three blade ceiling fan for approximately 200 hours. Explaining how energy is consumed by utilising visual aids is designed to change the thinking of the consumer and to eliminate any assumptions or pre-conceived notions they have regarding their energy consumption. It gives a consumer knowledge they may not have otherwise possessed, all of which is required to assist them in reducing energy consumption.
4.7.3 Daily Consumption vs. Night Time Consumption
Comparing daily and night time energy consumption was one of the first pieces of information within the energy data report. Sampled data was taken from the hours of 6:00am-6:00pm for daily consumption and 6:00pm-6:00am for night time consumption. This information allows a consumer to better understand where their electricity is being utilised. From a household perspective, especially when there is both school and work to attend to, it allows the consumer to quantify the amount of energy utilised during the day when the house is unoccupied versus
the amount of energy utilised during the evening upon the arrival home of all occupants. This information is also strongly beneficial to a small business owner as well. A small business
owner is able to quantify the amount of energy it takes to run the business even when the doors are not open compared to the time when the business is fully operational.
4.7.4 Base Load Calculation