In The Mood: Online Mood Profiling, Mood Response Clusters, and Mood-Performance Relationships in High-Risk Vocations
Renée L. Parsons-Smith BSc Hons (Psych)
Being a report of an investigation submitted as a full requirement for the award of Doctor of Philosophy, at the
University of Southern Queensland
Abstract
The relationship between mood and performance has long attracted the attention of researchers. Typically, research on the mood construct has had a strong focus on psychometric tests that assess transient emotions (e.g., Profile of Mood States [POMS]; McNair, Lorr, & Dropplemann, 1971, 1992; Terry, Lane, Lane, & Keohane, 1999). Commonly referred to as mood profiling, many inventories have originated using limited normative data (Terry et al., 1999), and cannot be
generalised beyond the original population of interest. With brevity being an important factor when assessing mood, Terry et al. (1999) developed a 24-item version of the POMS, now known as the Brunel Mood Scale (BRUMS). Including six subscales (i.e., tension, depression, anger, vigour, fatigue, and confusion), the BRUMS has undergone rigorous validity testing (Terry, Lane, & Fogarty, 2003) making it an appropriate measure in several performance environments. Mood profiling is used extensively for diverse purposes around the world, although Internet-delivered interventions have only recently been made available, being in conjunction with the proliferation of the World Wide Web. Developed by Lim and Terry in 2011, the In The Mood website (http://www.moodprofiling.com) is a web-based mood profiling measure web-based on the BRUMS and guided by the mood-performance conceptual framework of Lane and Terry (2000). The focus of the website is to facilitate a prompt calculation and interpretation of individual responses to a brief mood scale, and link idiosyncratic feeling states to specific mood
Certification of Dissertation
This report contains no material offered for the award of any other degree or
diploma, or material previously published, except where due reference is made in the text. This report is presented in American Psychological Association (APA) 6th Edition formatting.
_______________________ October 21, 2015
Signature of Candidate Date ENDORSEMENT
_______________________ October 21, 2015
Acknowledgements
My sincere gratitude goes to my primary supervisor Professor Peter Terry, who has been a steadfast presence throughout my learning journey. Thank you for providing the knowledge to scaffold independence; the encouragement to maintain confidence; and the optimism to achieve success.
Thank you to my secondary supervisor Professor Tony Machin, who has been both dependable and professionally supportive during my candidature.
My deepest heartfelt thanks go to my “best friend”—Clint Smith, who has supported the pursuit of my academic dreams with strength and love. To my beloved daughters Rhiannon and Imogen, I hope that I have been the role model that each of you deserves, and that one day you too will share my passion for learning.
A special mention goes to Tanya Machin for traversing the doctoral terrain with me. You have been a precious source of social support... Additional special mentions go to Jan Davies, Terri Bates, Sonya Errington, Sonya Digby, Trish Evers, Tracy McLean, Tanja Hirvonen, Liz Blight, Kassandra Kanagaratnam, and Bronwyn Lester for each being treasured friends. One last special mention goes to Dr Mark Perissinotto, who is considered a cherished friend by every member of our family...
Further, I would like to acknowledge the unending love and encouragement from my parents Darryl Parsons and Robyne Page-Faull, and my sister Tahnee Parsons.
Table of Contents
Abstract ... ii
Certification of Dissertation ... iv
Acknowledgements ... v
List of Figures ... xi
List of Tables ... xvi
List of Appendices ... xxi
CHAPTER 1: Introduction ... 1
CHAPTER 2: Literature Review ... 7
2.1 Historical Overview of Emotion ... 7
2.2 The Nature of Mood ... 18
2.3 Theoretical Distinctions between Mood and Emotion ... 27
2.4 The Effects of Mood on Performance ... 31
2.5 Mood Regulation Strategies ... 40
2.5.1 The effects of physical activity on mood ... 48
2.5.2 The effects of music on mood ... 53
2.5.3 The effects of food consumption on mood ... 61
2.6 Mood Assessment Issues ... 66
2.6.1 Construct validity in psychology ... 66
2.6.2 Self-report measures and mood ... 67
2.6.3 Mood measurement and response timeframes ... 69
2.7 Mood Assessment Measures ... 72
2.7.1 The Positive and Negative Affect Schedule (PANAS) .... 72
2.7.2 The Profile of Mood States (POMS) ... 75
2.8 Internet-Delivered Interventions (e-Interventions) ... 79
2.8.1 Internet-delivered mental health services ... 81
2.8.2 Advantages and risks of Internet-delivered interventions. 83 2.8.3 Efficacy of Internet-delivered interventions ... 86
2.8.4 Internet-delivered Interventions and the future ... 87
2.9 Structure and Overview of the In The Mood Website ... 89
2.9.1 Screenshots of website pages from In The Mood ... 91
2.9.2 Verbatim profile summary reports from In The Mood ... 101
2.9.2.1 Everest profile ... 101
2.9.2.2 Iceberg profile ... 101
2.9.2.3 Inverse iceberg profile ... 101
2.9.2.4 ‘Other’ profile ... 102
2.9.3 Verbatim profile summary reports according to mood dimension ... 102
2.9.3.1 Tension dimension of mood ... 102
2.9.3.2 Depression dimension of mood ... 104
2.9.3.3 Anger dimension of mood ... 106
2.9.3.4 Vigour dimension of mood ... 107
2.9.3.5 Fatigue dimension of mood ... 109
2.9.3.6 Confusion dimension of mood ... 110
2.9.4 Verbatim profile summary reports for the moderating effects of depression on tension and anger ... 111
2.9.4.1 Tension dimension of mood ... 111
2.9.4.2 Anger dimension of mood ... 113
CHAPTER 3: Mood Profiles Investigation: Sample A ... 116
3.1 Introduction to Cluster Analysis ... 118
3.2 Method ... 121
3.2.1 Participants ... 121
3.2.2 Measures ... 122
3.2.3 Procedure ... 123
3.3 Results ... 123
3.3.1 Hierarchical and k-means cluster analysis ... 127
3.3.2 Independence of clusters C1a to C6a ... 133
3.3.3 Characteristics of clusters C1a to C6a ... 141
3.3.4 Demographics of clusters C1a to C6a ... 148
3.4 Summary ... 162
CHAPTER 4: Replication of Mood Profiles: Sample B ... 166
4.1 Method ... 166
4.1.1 Participants ... 166
4.1.2 Measures ... 166
4.1.3 Procedure ... 167
4.2 Results ... 167
4.2.1 Parametric data screening ... 171
4.2.2 K-means cluster analysis ... 172
4.2.3 Independence of clusters C1b to C6b ... 173
4.2.4 Characteristics of clusters C1b to C6b ... 180
4.2.5 Demographics of clusters C1b to C6b ... 187
4.3 Summary ... 200
5.1 Overview of the Lim (2011) Findings ... 203
5.2 Website Colour ... 207
5.3 Website Content ... 213
5.3.1 Demographic information ... 213
5.3.2 Mood-performance relationship ... 214
5.3.3 Results page ... 215
5.4 Additional Website Changes ... 217
5.4.1 Revisions for Study 3 ... 217
5.4.2 Expansion of mood regulation strategies ... 221
CHAPTER 6: Replication of Mood Profiles: Sample C ... 229
6.1 Method ... 229
6.1.1 Participants ... 229
6.1.2 Measures ... 229
6.1.3 Procedure ... 230
6.2 Results ... 230
6.2.1 Parametric data screening ... 233
6.2.2 K-means cluster analysis ... 234
6.2.3 Independence of clusters C1c to C6c ... 235
6.2.4 Characteristics of clusters C1c to C6c ... 242
6.2.5 Demographics of clusters C1c to C6c ... 249
6.3 Summary ... 264
CHAPTER 7: Mood and Performance in High-Risk Vocations ... 267
7.1 Introduction ... 267
7.2 Method ... 273
7.2.2 Measures ... 274
7.2.3 Procedure ... 276
7.3 Results ... 276
7.3.1 Mood and performance analyses ... 281
7.3.2 Moderating demographic variables analyses (BRUMS). 285 7.3.3 Moderating demographic variables analyses (WHSS) .. 298
7.4 Summary ... 308
CHAPTER 8: Recapitulations ... 311
8.1 Overview of Results ... 311
8.2 Discussion of Main Findings ... 314
8.2.1 Mood-performance relationships ... 314
8.2.2 Mood profiles and gender differences ... 320
8.2.3 Mood-performance relationships in high-risk vocations. 323 8.3 Strengths and Limitations ... 326
8.4 Implications and Future Directions ... 327
List of Figures
Figure 2.1. Darwin’s (1872/1965) cross-species similarities in anger/aggression ... 8
Figure 2.2. First illustration of the brain by Lange (1885/1912) ... 11
Figure 2.3. The processes underlying the James-Lange theory ... 12
Figure 2.4. An example of the Cannon-Bard theory ... 13
Figure 2.5. Schematic illustrations of two circumplex models of emotion ... 15
Figure 2.6. Activation maps consistently associated with five basic emotions ... 17
Figure 2.7. Model highlighting two basic biopsychological dimensions of mood .. 22
Figure 2.8. A cross-section of the human brain highlighting arousal ... 25
Figure 2.9. The limbic system of the human brain ... 26
Figure 2.10. A diagram illustrating the zone of optimal performance. ... 32
Figure 2.11a. The process of emotion and learning for future behaviour ... 33
Figure 2.11b. How past emotion influences subsequent behaviour ... 33
Figure 2.11c. Anticipated emotional outcomes guide subsequent behaviour ... 34
Figure 2.12. Morgan’s (1980, 1985) mental health model ... 35
Figure 2.13. A conceptual model to predict performance ... 37
Figure 2.14. Areas activated during emotional regulation of negative emotions .... 45
Figure 2.15a. A consensual process model of emotion ... 47
Figure 2.15b. Family of antecedent-focused regulation strategies ... 47
Figure 2.16. Taxonomy for enhancing the psychological benefits of exercise ... 51
Figure 2.17. Framework for the prediction of responses to motivational music in sport and exercise ... 57
Figure 2.18. Four-factor model on the potential benefits of music in sport and exercise contexts ... 58
Figure 2.20. Homepage of the Black Dog Institute ... 88
Figure 2.21. The In The Mood homepage . ... 91
Figure 2.22. The In The Mood ‘About this website’ page ... 92
Figure 2.23. The In The Mood ‘About the measure’ page ... 92
Figure 2.24. The In The Mood ‘About the authors’ page ... 93
Figure 2.25. The In The Mood ‘Further reading’ page ... 93
Figure 2.26. The In The Mood ‘Take the test’ page ... 94
Figure 2.27. The BRUMS questionnaire ... 95
Figure 2.28. An example of the iceberg profile ‘Results’ page ... 96
Figure 2.29. An example of the inverse iceberg profile ‘Results’ page ... 97
Figure 2.30. The In The Mood ‘Leave feedback’ page ... 98
Figure 2.31. Page acknowledging receipt of user feedback ... 99
Figure 2.32. The In The Mood ‘Tell-a-Friend’ feature ... 99
Figure 2.33. Sample e-mail invitation ... 100
Figure 2.34. Successful submission of the ‘Tell-a-Friend’ form ... 100
Figure 3.1. Website map outlining the structure of In The Mood ... 116
Figure 3.2. General output process of the online BRUMS assessment ... 117
Figure 3.3. Decision-making processes involved with cluster analysis ... 119
Figure 3.4. Scree plot diagram of the hierarchical cluster solutions (N = 2,364). .. 127
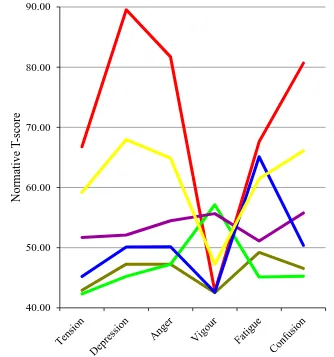
Figure 3.5. Graphical representation of the six-cluster solution (N = 2,364) ... 133
Figure 3.6. Graphical representation of C1a (n = 244) ... 142
Figure 3.7. Graphical representation of C2a (n = 64) ... 143
Figure 3.8. Graphical representation of C3a (n = 349) ... 144
Figure 3.9. Graphical representation of C4a (n = 695) ... 145
Figure 3.11. Graphical representation of C6a (n = 603) ... 147
Figure 3.12. Distribution of gender across clusters (N = 2,364) ... 149
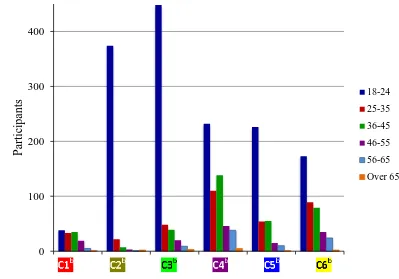
Figure 3.13. Distribution of age across clusters (N = 2,364) ... 153
Figure 3.14. Distribution of education across clusters (N = 2,364) ... 158
Figure 4.1. Graphical representation of the six-cluster solution (N = 2,303) ... 173
Figure 4.2. Graphical representation of C1b (n = 83) ... 181
Figure 4.3. Graphical representation of C2b (n = 586) ... 182
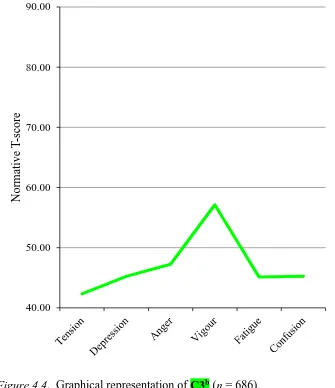
Figure 4.4. Graphical representation of C3b (n = 686) ... 183
Figure 4.5. Graphical representation of C4b (n = 346) ... 184
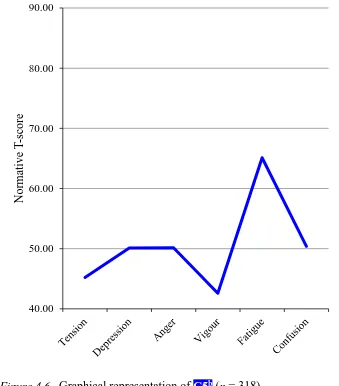
Figure 4.6. Graphical representation of C5b (n = 318) ... 185
Figure 4.7. Graphical representation of C6b (n = 284) ... 186
Figure 4.8. Distribution of gender across clusters (N = 2,303) ... 187
Figure 4.9. Distribution of age across clusters (N = 2,303) ... 191
Figure 4.10. Distribution of education across clusters (N = 2,303) ... 196
Figure 5.1. Leximancer concept map (n = 123) ... 205
Figure 5.2. Electromagnetic spectrum and visible light ... 208
Figure 5.3. Diagram of visual pathways ... 209
Figure 5.4. The original version of the In The Mood homepage ... 212
Figure 5.5. The re-developed version of the In The Mood homepage ... 212
Figure 5.6. The re-developed version of the In The Mood ‘Further reading’ page. 215 Figure 5.7. Example of three icons embedded within the ‘Results’ page ... 216
Figure 5.8. The re-developed version of ‘Take the test’ page ... 217
Figure 5.9. The re-developed version of the ‘About the authors’ page ... 218
Figure 5.10. The WHSS on the the re-developed version of In The Mood ... 219
Figure 6.2. Graphical representation of C1c (n = 541) ... 243
Figure 6.3. Graphical representation of C2c (n = 307) ... 244
Figure 6.4. Graphical representation of C3c (n = 44) ... 245
Figure 6.5. Graphical representation of C4c (n = 276) ... 246
Figure 6.6. Graphical representation of C5c (n = 174) ... 247
Figure 6.7. Graphical representation of C6c (n = 523) ... 248
Figure 6.8. Distribution of gender across clusters (N = 1,865) ... 249
Figure 6.9. Distribution of age across clusters (N = 1,865) ... 253
Figure 6.10. Distribution of education across clusters (N = 1,865) ... 258
Figure 7.1. Workplace fatalities per 100,000 Australian employees ... 268
Figure 7.2. Comparison of Australia’s work-related injury fatality rate ... 269
Figure 7.3. Antecedents, determinants, and components of safety performance ... 270
Figure 7.4. Structural Equation Model (SEM) of links between occupational stressors, safety behaviours, and occupational injuries ... 271
Figure 7.5. Construction injury rates in the United Kingdom since 1999/2000 .... 272
Figure 7.6. Coal mining non-fatal lost-time injuries 1988–2007 ... 272
Figure 7.7. Factor loadings of the WHSS ... 275
Figure D.1. The revised In The Mood homepage ... 422
Figure D.2. The revised In The Mood ‘About this website’ page ... 422
Figure D.3. The revised In The Mood ‘About the measure’ page ... 423
Figure D.4. The revised In The Mood ‘About the authors’ page ... 424
Figure D.5. The revised In The Mood ‘Further reading’ page ... 425
Figure D.6. The revised In The Mood ‘Take the test’ page ... 426
Figure D.7. The BRUMS questionnaire ... 427
Figure D.9. An example the ‘Everest profile’ results page ... 429
Figure D.10. An example of an ‘Other profile’ results page ... 431
Figure D.11. The revised In The Mood ‘Leave feedback’ page ... 432
Figure D.12. Page acknowledging receipt of user feedback ... 433
Figure D.13. The revised In The Mood ‘Tell-a-Friend’ feature ... 433
Figure D.14. Sample e-mail invitation ... 434
List of Tables
Table 2.1 Basic Emotions According to Four Theoretical Models ... 9
Table 2.2 States and Traits Associated with Different PA and NA Profiles ... 20
Table 2.3 An Overview of Categories of Mood/Emotion Measures ... 21
Table 2.4 Selected Distinctions Between Mood and Emotion ... 29
Table 2.5 List of Most Popular and Effective Strategies Used to Regulate Mood .. 42
Table 2.6 Classification for Affect Regulation Strategies ... 44
Table 3.1 Demographic Characteristics of the BRUMS Respondents (N = 2,364) ... 124
Table 3.2 Descriptive Statistics of the BRUMS Sub-scales (N = 2,364) ...126
Table 3.3 Final 25 Cluster Allocation Cases of Agglomeration Schedule (N = 2,364) ... 128
Table 3.4 Fate of Members to Determine Number of Clusters (N = 2,364) ...129
Table 3.5 Inter-correlation Matrix of the Hierarchical Clusters (N = 2,364) ...130
Table 3.6 Inter-correlation Matrix of Hierarchical and K-means Clusters (N = 2,364) ...131
Table 3.7 Inter-correlation Matrix of the K-means Clusters (N = 2,364) ...132
Table 3.8 Cluster Centroids of the Six-cluster Solution (N = 2,364) ...132
Table 3.9 Descriptive Statistics of the Six-cluster Solution (N = 2,364) ...135
Table 3.10 Eigenvalues for the Discriminant Function (N = 2,364) ...137
Table 3.11 Functions at Group Centroids (N = 2,364) ...138
Table 3.12 Structure Matrix (N = 2,364) ...139
Table 3.13 Unstandardised Canonical Coefficients (N = 2,364) ... 139
Table 3.14 Classification Function Coefficients (N = 2,364) ... 140
Table 3.16 Crosstabulations of Clusters C1a to C6a by Gender (N = 2,364) ... 149
Table 3.17 Cluster Membership According to Within Gender Percentage (N = 2,364) ... 151
Table 3.18 Standardised and Adjusted Residuals for Gender (N = 2,364) ... 152
Table 3.19 Crosstabulations of Clusters C1a to C6a by Age Grouping (N = 2,364) ... 154
Table 3.20 Cluster Membership According to Within Age Group Percentage (N = 2,364) ... 156
Table 3.21 Standardised and Adjusted Residuals for Age Grouping (N = 2,364) ... 157
Table 3.22 Crosstabulations of Clusters C1a to C6a by Level of Education (N = 2,364) ... ... 159
Table 3.23 Cluster Membership According to Within Education Group Percentage (N = 2,364) ... 161
Table 3.24 Standardised and Adjusted Residuals for Level of Education (N = 2,364) ... 162
Table 4.1 Demographic Characteristics of the BRUMS Respondents (N = 2,303) 169 Table 4.2 Descriptive Statistics of the BRUMS Sub-scales (N = 2,303) ... 172
Table 4.3 Cluster Centroids of the Six-cluster Solution (N = 2,303) ... 172
Table 4.4 Descriptive Statistics of the Six-cluster Solution (N = 2,303) ... 175
Table 4.5 Eigenvalues for the Discriminant Function (N = 2,303) ... 177
Table 4.6 Functions at Group Centroids (N = 2,303) ... 177
Table 4.7 Structure Matrix (N = 2,303) ... 178
Table 4.8 Unstandardised Canonical Coefficients (N = 2,303) ... 178
Table 4.10 Classification of Results (N = 2,303) ... 180 Table 4.11 Crosstabulations of Clusters C1b to C6b by Gender (N = 2,303) ... 188 Table 4.12 Cluster Membership According to Within Gender Percentage (N = 2,303) ... 189 Table 4.13 Standardised and Adjusted Residuals for Gender (N = 2,303) ... 190 Table 4.14 Crosstabulations of Clusters C1b to C6b by Age Grouping (N = 2,303)192 Table 4.15 Cluster Membership According to Within Age Group Percentage (N = 2,303) ... 194 Table 4.16 Standardised and Adjusted Residuals for Age Grouping (N = 2,303) . 195 Table 4.17 Crosstabulations of Clusters C1b to C6b by Level of Education (N = 2,303) ... 197 Table 4.18 Cluster Membership According to Within Education Group Percentage (N = 2,303) ... 199 Table 4.19 Standardised and Adjusted Residuals for Level of Education (N = 2,303) ... 200 Table 5.1 User Ratings of the In The Mood Website (N = 175) ... 204 Table 5.2 Comparison of Role Groupings for Mining Demographic Data ... 220 Table 5.3 Comparison of Role Groupings for Mining and Construction
Table 6.5 Eigenvalues for the Discriminant Function (N = 1,865) ... 239
Table 6.6 Functions at Group Centroids (N = 1,865) ... 239
Table 6.7 Structure Matrix (N = 1,865) ... 240
Table 6.8 Unstandardised Canonical Coefficients (N = 1,865) ... 240
Table 6.9 Classification Function Coefficients (N = 1,865) ... 241
Table 6.10 Classification of Results (N = 1,865) ... 242
Table 6.11 Crosstabulations of Clusters C1c to C6c by Gender (N = 1,865) ... 250
Table 6.12 Cluster Membership According to Within Gender Percentage (N = 1,865) ... 251
Table 6.13 Standardised and Adjusted Residuals for Gender (N = 1,865) ... 252
Table 6.14 Crosstabulations of Clusters C1c to C6c by Age Grouping (N = 1,865) ... 254
Table 6.15 Cluster Membership According to Within Age Group Percentage (N = 1,865) ... 256
Table 6.16 Standardised and Adjusted Residuals for Age Grouping (N = 1,865) .. 257
Table 6.17 Crosstabulations of Clusters C1c to C6c by Level of Education (N = 1,865) ... 259
Table 6.18 Cluster Membership According to Within Education Group Percentage (N = 1,865) ... 261
Table 6.19 Standardised and Adjusted Residuals for Level of Education (N = 1,865) ... 263
Table 7.1 Demographic Characteristics of the BRUMS and WHSS Respondents (N = 568) ... 277
List of Appendices
Appendix A: Human Ethics Approval ... 419
Appendix B: 2010 BRUMS Normative Data (N = 3,912) ... 420
Appendix C: Hierarchical Cluster Solutions (N = 2,364) ... 421
Appendix D: Overview of the Re-Developed In The Mood Website ... 422
Appendix E: Visual Summary of the Six-Cluster Solution Across Samples ... 452
“I have seen the sea when it is stormy and wild;
when it is quiet and serene; when it is dark and moody;
and in all its moods, I see myself...”
CHAPTER 1:
Introduction
Despite more than 120 years of research, science has so far failed to clearly delineate the ethereal concept known as emotion (Ketai, 1975; Reisenzein, 2007). Although there is general agreement on the existence of transcultural rudimentary emotions, as well as complex higher-level feeling states (Oatley & Johnson-Laird, 1987; Plutchik, 1980), theorists disagree over the imperative features necessary for systematic classification (Ekman, 1994; Lazarus, 1984; Levenson, 2011).
Meliorating this issue now appears to be a categorical imperative, a sentiment seemingly shared by Scherer (2005); “without consensual conceptualisation... of exactly what phenomenon is to be studied, progress in theory and research is difficult to achieve and fruitless debates are likely to proliferate” (p. 695).
In a similar vein, there remains no commonly accepted, nor applied, defining criteria for the mood construct (Terry & Lane, 2011), as evidenced by Lazarus’ (1984) assertion that “moods usually refer to sustained general states, such as sadness and contentment that may or may not be considered emotions depending on theoretical and definitional conventions” (p. 125). To complicate matters further, mood and emotion share an interrelated framework (Lane & Terry, 2000; Reed, 2005). Additionally, some researchers suggest that the affect construct is
inextricably linked to both mood and emotion. In all but abandoning single-system and dichotomous models, a cadre of theorists continue to work towards conceptual clarity for the multidimensional sensations of mood and emotion (see Batson, Shaw, Oleson, & Clark, 1992; Ketai, 1975).
environmental demands (Morris, 1992). Mood encompasses both essential and fundamental cognitive architectures (Sizer, 2000) which influence a range of cognitive processes. For example, creative thinking (see Baas, De Dreu, & Nijstad, 2008; Greene & Noice, 1988), problem solving (Nadler, Rabi, & Minda, 2010), motivation (George & Brief, 1996), decision-making (Herr, Page, Pfeiffer, & Davis, 2012), and evaluation processes may all be biased by transient feelings (Yuen & Lee, 2003).
Interestingly, numerous synergistic and interrelated systems underlie mood (Newman, Perkins, & Wheeler, 1930; Schachter & Singer, 1962; Thayer, 1989, 2001). Psychoneuro-immunological literature is replete with evidence highlighting the integral role of feelings in optimal health and psychological well-being. Indeed, mood has the capacity to influence the endocrine system (Houser, 2004; Nelson, 2005; Suchy, 2011; Wieck, 1996) as well as the autonomic and central nervous systems (i.e., levels of arousal; Dalgleish, 2004; LeDoux, 1992, Thayer, 2001). More specifically, psychosocial mediated immune variations have also been identified (see Maier, Watkins, & Fleshner, 1994; Valdimarsdottir & Bovbjerg, 1997). Findings such as these are perhaps not surprising, given the
well-characterised transactional and homeostatic nature of many biological relationships (see Gold, MacLeod, Deary, & Frier, 1995).
psychological states (Terry, Karageorghis, Saha, & D’ Auria, 2012; Terry et al., 1999). Indisputably, there exists a myriad of cognitive-behavioural mood-regulation strategies (see Fordyce, 1977, 1983; Lane, Davis, & Devonport, 2011; Parkinson & Totterdell, 1999; Solanki & Lane, 2010; Terry & Lane, 2011). Within the realm of sport and exercise, athletes have been shown to engage in multiple strategies to regulate differential mood dimensions (Terry, Dinsdale, Karageorghis, & Lane, 2006). However, mood regulation in this context usually aims to improve performance, rather than increase positive affect per se.
The fundamental role of mood in predicting performance has attracted great attention within the domain of sport, which has subsequently transpired into a considerable body of knowledge (Beedie, Terry, & Lane, 2000; Lane, Thelwell, & Devonport, 2009). A multitude of interactional mood-performance relationships have been proposed (Lane & Terry, 2000) between and within emotional
dimensions, as well as across numerous contexts. Given this, it seems commonsensical to quantify and examine potential associations using mood dimensions (i.e., tension, depression, anger, vigour, fatigue, and confusion) as opposed to overarching categorisations (i.e., positive and negative affect).
Seemingly substantiating this claim, mood-performance scientists suggest that high vigour often evokes greater effort towards performance goals, while confusion, depression, and fatigue have been consistently associated with performance
decrements (Lane & Terry, 2000). Findings related to the mood dimensions of anger and tension suggest that each can either debilitate or facilitate performance,
depending on the co-existence or absence of depressed mood (Lane & Terry, 2000). Much of the aforementioned research has had a strong focus on
Terry et al., 1999). Nevertheless, many of these self-report inventories have not been supported by an expansive range of normative data. Breaking this trend, the
BRUMS is one of the few variations of the POMS that has been validated via multi-sample confirmatory factor analysis for each subscale (i.e., anger, confusion,
depression, fatigue, tension, and vigour), using four different samples. Additionally, the BRUMS has demonstrated high internal consistency, as well as appropriate test-retest reliability coefficients for a measure of temporary emotional states (Terry et al., 1999). Concurrent validity of the measure has also been supported, in that all correlations were in line with theoretical predictions (Terry, Lane et al., 2003). Conceivably, the psychometric robustness of the BRUMS makes it a particularly appropriate measure in several performance environments and its brevity readily lends itself to web-based mood profiling.
Recently developed, web-based mood profiling is currently used throughout the world for diverse purposes. Indeed, the In The Mood website (see
http://www.moodprofiling.com; Lim & Terry, 2011) is but one exemplar. The newly constructed website was guided by the theoretical framework of Lane and Terry’s (2000) conceptual model of performance, and designed according to a user-centred approach. The focus of In The Mood is to facilitate a prompt calculation and interpretation of individual responses to an online version of the BRUMS, and link specific mood profiles with evidence-based mood regulation strategies corresponding with each mood dimension (Lim & Terry, 2011). Raw and standard scores, as well as a graphical representation of the mood profile are also presented.
profiles (Terry, 1995); each distinctive combination of the six mood dimensions appear to have a well-enunciated positive or negative impact on performance (see Terry & Lane, 2011). Although individual dispositions and mood fluctuations exist (Cowdry, Gardner, O’Leary, Leibenluft, & Rubinnow, 1991; Penner, Shiffman, Paty, & Fritzsche, 1994), it remains unknown if relatively consistent mood patterning can be found within the general population. It is for this reason that the primary aim of the present research was to investigate whether distinct clusters of mood responses can be identified within the general population.
Due to burgeoning interest, the Internet now plays a pivotal role in delivering mental health interventions and resources (Fotheringham, Owies, Leslie, & Owen, 2000; Griffiths, Lindenmeyer, Powell, Lowe, & Thorogood, 2006). With an ability to transcend multiple barriers, the In The Mood website has utility for mood profiling in performance environments not previously considered. Unfortunately, the potential for injury and mortality are significantly greater in some workplace environments, making crucial the identification of factors that influence accidents (Abbe, Harvey, Ikuma, & Aghazadeh, 2011) and mediate occupational stressors (Lingard, Cooke, & Blismas, 2010). Given this, and with an aim to further generalise the scale, the current study will also investigate mood responses of individuals employed in high-risk vocations.
More specifically, the present research includes cluster analysis of three independent datasets collected via the In The Mood website. Additionally, the In The Mood website will be revised and improved according to Lim’s (2011)
in the context of safety will also be investigated. To further generalise the scale, population-specific normative data for each of the two populations of interest will be developed where necessary.
The thesis is divided into eight chapters. Chapter 2 begins with an historical overview of emotion. An introduction on the nature of mood follows, and
CHAPTER 2:
Literature Review
2.1 Historical Overview of Emotion
Emotions are manifest expressions of underlying affective states. The study of emotion is a popular field of research, involving core theoretical debates that cross sub-disciplines (Levenson, 2011; Panksepp & Watt, 2011; Salas, Radovic, &
Turnbull, 2011). However, various terms to conceptualise mood, sentiments,
emotions, and emotional reactions have typically been used interchangeably. From a theoretical perspective, these practices have created concern among the scientific community (see Ketai, 1975, Lazarus, 1984; Ortony & Clore, 1981; Terry & Lane, 2011), highlighting a need for differentiating criteria (Beedie, Terry, & Lane, 2005).
Emotions are subjective conscious experiences, with some aspects considered universal, while others vary according to culture and gender (Westen, Burton, & Kowalski, 2006). According to Lazarus, Kanner, and Folkman (1980), emotions are complex organised psychophysiological reactions (i.e., cognitive appraisals, action impulses, and patterned somatic reactions) operating collectively in response to stimuli. Over the past 30 years, scientists have attempted to identify a finite list of pancultural basic emotions using facial recognition, standardised measures, induction procedures, and data analytic techniques (Coan & Allen, 2007; Ekman, 1992; Salas et al., 2011). Otherwise known as fundamental or primary emotions, discrete emotion theorists posit that basic emotions are a subset of innate affective states associated with survival-critical functions, which evolved from an ancestral past (Darwin, 1872/1965; Ekman, 1972, 1994; Levenson, 2011).
across species/time/place (Ekman, 1994; Levenson, 2011). Additionally, basic emotions display distinct physiological and neural profiles (Vytal & Hamann, 2010). However, theorists often disagree on a list of hallmark features, which are necessary requisites for developing a taxonomy (Ekman, 1994; Lazarus, 1984; Levenson, 2011). For example, Ekman (1994) outlined eight defining characteristics including a universal signal, automatic appraisal, commonalities in antecedent events, presence in other primates (refer to Figure 2.1 for an illustration), quick onset, brief duration, unbidden occurrence, and distinctive physiology (with tripartite groupings of distinctness, continuity, and structure/function). Conversely, Levenson (2011) proposed three criteria involving distinctness, hard-wiredness, and functionality.
Figure 2.1. Illustrations and a photograph used by Darwin (1872/1965) to demonstrate cross-species similarities in anger/aggression (taken from Dalgleish, 2004).
Paradoxically, which criteria are used ultimately affects which emotions are labelled basic emotions (see Ekman & Cordaro, 2011; Izard, 2011; Levenson, 2011; Panksepp & Watt, 2011). This is evident in that some theorists propose as few as two basic emotions (Mowrer, 1960), while others have identified as many as 18 (Frijda, 1986; Ortony & Turner, 1990). Alternatively, complex emotions are
2000) remains vague and undifferentiated (Lane & Terry, 2000). Perplexingly, Cacioppo and Berntson (2007) suggest affect may be “simply a form of cognition” (p. 1,348).
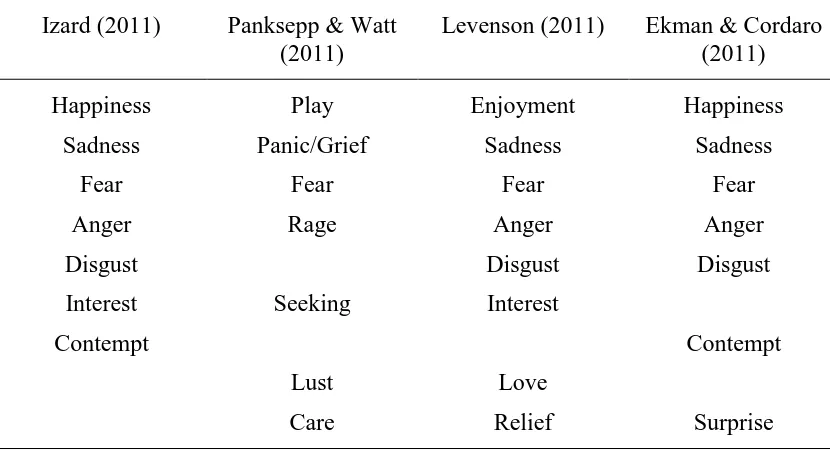
Following a review of the fields most prominent researchers (i.e., Ekman & Cordaro, 2011; Izard, 2011; Levenson, 2011; Panksepp & Watt, 2011), four central tenets were identified across four empirically tested theoretical models (Tracy & Randles, 2011). According to Tracy and Randles (2011), the scientists demonstrated considerable agreement on a defining criteria (i.e., discreteness, fixedness of neural and bodily expressed components, and fixedness of feeling/motivational
[image:31.595.110.525.541.767.2]components), as well as conformity that basic emotions are “primitive” in nature (p. 398). Additionally, there was consensus that cross-species generalisation (Ekman, 1994), and distinct neurobiology (Vytal & Hamann, 2010), were both verification of a basic emotion (Tracy & Randles, 2011). Table 2.1 lists the currently known basic emotions according to the four-abovementioned frameworks.
Table 2.1
Basic Emotions According to Four Theoretical Models (taken from Tracy & Randles, 2011)
Izard (2011) Panksepp & Watt (2011)
Since the late 1800’s, there have been numerous conceptualisations of emotion proposed. Such premises range from phylogenetic theories bound by limited physiological and neuroscientific knowledge (see Bard, 1929; Cannon, 1927, 1931; Newman et al., 1930), to more recent investigations involving detailed
neuroanatomic and neurophysiologic hypotheses (see Hallaq, 1969; Northoff, 2012; Stephens, Christie, & Friedman, 2010). It has been over a century since the
introduction of the James-Lange theory, which subsequently guided generations of research (Lang, 1994). Developed independently by both William James in 1884 and Carl Lange in 1885 (Newman et al., 1930), this influential model fixated on physical experience (Westen et al., 2006). For example, the hypothesis proposed that emotions are the subjective consequences of peripheral nervous system responses following interpretation by the central nervous system, a concept otherwise known as the body loop (Damasio, 1994; Westen et al., 2006). According to this
person-environment relationship, emotions are the experiential component of physiological changes (i.e., visceral reactions and voluntary behaviours) in response to external stimuli (Newman et al., 1930).
Whereas James (1884) described various somatic and autonomic responses, Lange (1885/1912) observed a relationship between feeling states and the
generation of affective states (MacLean, 1949, 1952). Lange was likely the first affective scientist to use an illustration of the brain to explicate emotion (see Figure 2.2; Wassman, 2010).
Figure 2.2. The first illustration of the brain by Lange (1885/1912). Lange
(1885/1912) proposed that pathways for visual and gustatory impressions involved sensory information from the eye (Ø) that travel through the optical nerve (N.O.) to the central organ of seeing (C. Oʹ), where it became a sensation. A nervous fibre tract from C. Oʹ to the vasomotor centre (C.V.) would transfer the visual information to the C.V. and trigger vasoconstriction/vasodilatation of blood vessels and other emotion-related changes. Visual information would be transferred at the same time from C. Oʹ to the cortical centre of vision (C Oʺ), where the image came into
conscious awareness. Similarly, gustatory information would be transferred from the tongue (T) via the gustatory nerve (N.G.) to the central organ of taste (C G.ʹ) and a nervous fibre tract to the C.V. would trigger an emotional reaction (taken from Wassman, 2010).
specific emotions) preceded the conscious emotional experience (refer to Figure 2.3; Lang, 1994). Unfortunately, the James-Lange theory was met with reservation from colleagues, and James’ famous declaration that “we feel sorry because we cry, angry because we strike, and afraid because we tremble” (as cited in Palencik, 2007, p. 770) drew immediate criticism.
Figure 2.3. A flowchart highlighting the process underlying the James-Lange theory (taken from Almoite & Norasakkunkit, 2012).
Walter Cannon and Philip Bard were two of the many researchers (see Dana, 1921; Irons, 1894; Worcester, 1893; Wundt, 1891) who challenged the plausibility of the James-Lange theory (Palencik, 2007). Cannon (1927, 1931) argued that delays in visceral changes could not account for the immediacy of feelings, and artificially produced visceral changes did not induce emotion (Fehr & Stern, 1970). Further, according to Cannon and Bard (1929) the viscera were “insensitive structures” (as cited in Fehr & Stern, 1970, p. 411), and any changes were described as having a universal impact (Friedman, 2009). Moreover, Cannon asserted that emotional behaviour was not influenced by interruptions of the body loop (via afferent feedback from the peripheral nervous system; Fehr & Stern, 1970).
Furthermore, feelings often preceded autonomic reactions and behaviours (Westen et al., 2006), as well as shared highly similar visceral responses (Friedman, 2009). Therefore, the Cannon-Bard theory (otherwise known as the emergency theory) maintains that external stimuli elicit both conscious emotional experience and physical responses independently and simultaneously (Friedman, 2009; Westen et al., 2006). According to this view, emotion originates in the thalamus (Cannon, 1931) which relays relevant information bilaterally to the central and peripheral nervous systems, thereby initiating physiological arousal and motor movement (e.g., a fight or flight response; Westen et al., 2006). Additionally, activation of the cerebral cortex stimulates a cognitive interpretation of the situation (Ledoux, 1992). Refer to Figure 2.4 for an example of the Cannon-Bard theory.
Figure 2.4. An example of the Cannon-Bard theory highlighting cognitive appraisal, in terms of the concurrence of conscious affective experience and physiological responses (taken from the CliffsNotes website, nd).
2009). However, these findings failed to identify distinct autonomic patterns, which was consistent with Cannon’s (1927, 1931) view. Indeed, the same physiological arousal patterns could be labelled “joy or fury or jealously, or any of a great diversity of emotional labels...” (Schachter & Singer, 1962, p. 398). Given this, Schachter and Singer proposed that individuals rely on environmental cues to determine subjective states in the absence of obvious causes. In such cases, a label is assigned to the emotion upon a cognitive appraisal of the environment. Additionally, by
manipulating cognitions, the subjective experience could subsequently be altered. This position is otherwise known as Schachter-Singer’s two-factor theory of emotion.
Figure 2.5. Schematic illustrations of two circumplex models of emotion. The left panel shows a diagram of two-dimensional affective (valence x arousal) space: the circumplex model. Example emotions are noted in each quadrant. The right panel shows a model of mixed valence. Pure positive and negative responses lie along the axes in white. Darker shades of grey represent greater mixed feelings, which have shared positive and negative activation to varying degrees (taken from Hunter & Schellenberg, 2010).
Such taxonomies were developed via the study of similarities and differences in visual facial stimuli and word recognition (Barrett & Russell, 1998; Larsen, Kasimatis, & Frey, 1992; Russell, 1980; Watson et al., 1999). Visual stimuli designed to represent and evoke emotions (e.g., International Affective Picture System, Self-Assessment Manikin, and Semantic Differential Scale; Bradley & Lang, 1994; Mehrabian & Russell, 1974) have also provided support for
two-dimensional models (Hunter & Schellenberg, 2010). Emotional dimensions can also be identified through factor analysis and/or unidimensional scaling, whereby
According to data on orthogonal emotions, pleasant-unpleasant (i.e., valence) was identified as the most important dimension in numerous studies, followed by level of arousal (Osgood, Suci, & Tannenbaum, 1957; Russell & Mehrabian, 1977; Titchner, 1910; Wundt, 1902). More recently, however, there have been a number of alternative models of emotion devised (see Gross & Muñoz, 1995; Gross &
Thompson, 2007; Levenson, 1994). Some examples include the general model of emotion (Gross & Muñoz, 1995), cognitive-motivational-relational theory of emotion (Lazarus, 1991), fuzzy logic adaptive model (FLAME; El-Nasr, Yen, & Ioerger, 2000), and the facial feedback hypothesis (Buck, 1980). Additionally, peripheral physiological emotion specificity concepts have also been proposed (Heller, 1993; Stemmler, 1992).
Figure 2.6. Activation maps consistently associated with five basic emotions (taken from Vytal & Hamann, 2010).
From an epistemological perspective, the plethora of research on emotion has generated innumerable theoretical debates, as well as subjected the construct to increasingly powerful critiques (see Darwin, 1872/1965; Ekman, 1972; Salas et al., 2011; Scarantino & Griffiths, 2011; Vytal & Hamann, 2010; Zajonc, 1984).
2.2 The Nature of Mood
In what may be considered an enigmatic affect barometer, mood can assimilate and communicate the emotional equilibrium. According to Lane and Terry (2000), mood can be described as “a set of feelings, ephemeral in nature, varying in intensity and duration, and usually involving more than one emotion” (p. 17). Additionally, mood may be considered ubiquitous, although the strength and extent of conscious feelings often vary. It is important to note that key to this definition, mood and emotion each play a contributing role to the experiential sensation (Lane & Terry, 2000; Suchy, 2011).
Historically, the mood construct has lacked a clear conceptualisation, and despite the vast amount of literature, researchers have so far failed to agree on a definition (Augustine & Hemenover, 2009; Batson et al., 1992; Lane & Terry, 2000). For example, Frijda (1986) asserted that mood “can be described as experiences of situational meaning structure with the characteristic of globality: Everything seems open and attainable, or nothing is attractive, or nearly everything is irritating” (p. 252). Alternatively, Griffiths (1989, 1997) suggested that mood involves higher order functional states, comprising of lower order functional states. This pre-scientific and hierarchically structured conception of the mind comprised both a psychological and physiological component. A similar physiological view was proposed by Sizer (2000) in that moods were characterised as “biases in operations at the level of our functional architecture” (p. 759). The theory of mood as a global mental state, as opposed to an evaluative or cognitive state, has received at least some agreement between theorists (de Sousa, 1987; DeLancey, 2006; Griffiths, 1989, 1997; Tye, 1995).
2006), a few supplementary theories have been proposed. For example, mood-emotion identity theory, activation theory, and Lormand’s (1985) M-state theory. In applying mood-emotion identity theory, DeLancey (2006) instantiated that some basic moods are in fact low intensity basic emotions (i.e., bad moods are anger, good moods are joy, etc.) which prime higher intensity emotions. Alternatively, according to activation theory as interpreted by Lindsley (1951) and Woodworth and
Schlosberg (1958); feeling states lie on one end of a continuum of activation that is defined according to degree of autonomic arousal. Conversely, Lormand’s M-state theory suggests that moods are cognition-assessing variations, with the functional component of the mind (i.e., M) affecting a range of cognitive states (DeLancey,
2006). According to this theory, particular states of M correlate with specific moods. Given the paradigmatic differences underlying each theory, it becomes
intuitively obvious that the mood construct still requires adequate delineation. The value of an agreed upon definition was plainly outlined by Lane and Terry (2000) in that a consensus among researchers is necessary to minimise inconsistent
conclusions due to inconsistent conceptualisations. Lane and Terry posited that mood entails two components: evaluation and arousal. The arousal component refers to the degree of activity physiologically experienced (discussed in further detail later), while the evaluative component involves judgement of feelings on a pleasant-unpleasant continuum. While arousal and pleasantness-pleasant-unpleasantness are each considered unrotated dimensions of mood, two varimax-rotated factors have been investigated more extensively (Watson, Clark, & Tellegen, 1988).
ranging from enthusiasm, alertness, joy, and determination at the upper end; to lethargy at the lower end (Murray, Allen, & Trinder, 2002; Suchy, 2011). Similarly, negative affect (NA) reflects negative feeling states such as anger, fear, sadness, and guilt; to calm and relaxation (refer to Table 2.2 for associated PA and NA states and traits; Murray et al., 2002; Suchy, 2011). Considered mutually orthogonal (Steer, Clark, Kumar, & Beck, 2008; Tellegen et al., 1999; Watson, 1988a), these two dissimilar dimensions subsuming polar opposites have been validated across a variety of methods and populations.
Table 2.2
States and Traits Associated with PA and NA Profiles (taken from Suchy, 2011)
Positive Affect
Negative Affect High Low
High High engagement
High arousal Astonishment Pleasantness Happiness Contentment
Unpleasantness Sadness
Distress
Disengagement Sluggishness Anhedonia Low
nonchalance. The development of the popular POMS (discussed in Section 2.7.2; McNair et al., 1971, 1992)—whereby individuals rate their current mood according to descriptive terms—was built from this foundation (Thayer, 2001). However, alternative indirect and objective measurements are also often utilised (i.e.,
physiological measures, brain activity measures, and behavioural measures; Jacobs, Fehres, & Campbell, 2012; refer to Table 2.3 for an overview of measures). Table 2.3
An Overview of Mood/Emotion Measures (taken from Jacobs et al., 2012)
Category What is measured? What can be inferred? Time dimension Physiological measures Autonomic nervous system, e.g., heart rate
skin conductivity
valance arousal
current emotional states
emotional dispositions Brain activity
measures
Brain activity, e.g., electromagnetic
field
oxygen in blood
approach and avoidance tendencies
current emotional states
emotional dispositions Behavioural
measures
Behaviours, e.g., facial
expressions vocal features whole body
postures
valance arousal
current emotional states
emotional dispositions Self-report
measures
Experiences
valance arousal specific
discrete emotions
current emotional states
remembered emotional states anticipated
emotional states emotional
Although Thayer (2001) took into account the checklist approach to grouping incorporeal feelings, the anatomical foundation underpinning mood dominated his theory development. More specifically, factor analytic techniques were used with a focus on physiological variables such as biological rhythms (relating to alertness and tiredness) and the effects of exercise, food, and stress. Two biopsychological
dimensions of mood were identified: energetic arousal and tense arousal (i.e., energy and tension, respectively). According to Thayer, good moods comprise of a high level of energy and a low level of tension (i.e., calm energy), while bad moods tend towards a low level of energy combined with a high level of tension (i.e., tense tiredness). Further, calm energy is associated with pleasure and happiness, while tense tiredness is associated with despair (refer to Figure 2.7 for a biopsychological model of mood).
Figure 2.7. A model highlighting two basic biopsychological dimensions of mood (i.e., tension and energy; taken from Thayer, 2001).
in blood sugar levels) may potentially influence changes in another (i.e., the phenomenological sensation of mood; Thayer, 1989, 2001). This relationship was reproduced by Gold et al. (1995) while investigating the effects of biological changes on mood states. When an acute hypoglycaemic state was induced in nondiabetic patients (a placebo control study was also implemented), participants experienced a significant increase in feelings of tense arousal and a decrease in hedonic tone, a mood state otherwise referred to as tense tired by Thayer (2001). While some studies have failed to detect hedonic changes corresponding with blood-glucose fluctuations (see Weinger, Jacobson, Draelos, Finkelstein, & Simonson, 1995), numerous studies have replicated many behaviour-endocrine relationships (see Gonder-Frederick, Cox, Bobbitt, & Pennebaker, 1989; Sommerfield, Deary, & Frier, 2004; Strachan, Deary, Ewing, & Frier, 2000). Mood mediated immune alterations affecting physiological responses to pathogens and antigens have also been identified (i.e., changes in B and T lymphocytes, macrophages, leukocytes, and antibodies; Maier et al., 1994).
While the nervous system has the power to link “mind and body” (Hobson, 1999, p. 184), the two divisions of the autonomic nervous system have been described as the “key to energy, mood, and health” (Hobson, 1999, p. 184). For instance, where the sympathetic sub-system requires energy expenditure (i.e., ergotropic) the parasympathetic branch is concerned with energy conservation (i.e., trophotropic; Kandel, Schwartz, & Jessell, 1995, Thayer, 2001). Neurotransmitters such as norepinephrine and acetylcholine each affect the autonomic nervous system creating either an ergotropic (i.e., energy-generating) or trophotropic (i.e., calming) effect (Kandel et al., 1995; Thayer, 2001). This physiological interaction clearly articulates a connection between arousal and mood.
Figure 2.8. A cross-section of the human brain highlighting areas associated with arousal (taken from the Healthy Sleep website, 2007).
While Thayer (2001) recognised arousal as a key concept underlying mood, the limbic cortices have also been pinpointed as contributing mechanisms. This system of interconnected structures—the hypothalamus, hippocampus, and amygdala—influence the cerebral cortex, as well as many vital physiological functions (e.g., the autonomic and somatic areas; LeDoux, 1996; Popper, Eccles, John, & Carew, 1977; Thayer, 2001). The limbic system, sometimes referred to as the emotional brain (Izard, 1984), regulates motivated behaviour described as fleeing, feeding, fighting, and reproductive behaviour (Isaacson, 1974; McEllistrem, 2004). Although fear and anxiety are both mediated by the prefrontal cortex
Figure 2.9. The limbic system of the human brain (taken from Gamon & Bragdon, 2003).
Overall however, daily emotions generally require higher-level and more elaborate processing (Suchy, 2011). For example, cognitive appraisal (in the
prefrontal cortex) of visceral signals from the limbic cortices (Davidson, 2002; Farb, Anderson, & Segal, 2012; Scherer, Schorr, & Johnstone, 2001; Vytal & Hamann, 2010). Happiness, joy, interest, and anger demonstrate left frontal cortical activation while sadness shows reduced left lateralised patterning (Baas et al., 2008; Depue & Iacono, 1989; Murphy et al., 2003). In contrast, fear and disgust have been found to activate right frontal cortical areas (Schmidt & Trainor, 2001). However, alternative theories of lateralisation have also been proposed (see Buck, 1999; Gainotti,
Caltagirone, & Zoccolotti, 1993; Silberman & Weingartner, 1986).
psychological) operating synergistically underlie what is experienced as mood (Panksepp & Watt, 2011; Suchy, 2011; Thayer, 1989, 2001; Valdimarsdottir & Bovbjerg, 1997).
2.3 Theoretical Distinctions between Mood and Emotion
The distinction between mood and emotion has been the subject of
considerable discussion between affective scientists, and as Beedie, Lane, and Terry (2005) highlight, “the terms emotions and mood represent a conundrum for
psychologists” (p. 847). It is important to emphasise the complexity of the mood-emotion distinction, as well as acknowledge that affective terms have traditionally been used interchangeably (Lane et al., 2009; Terry & Lane, 2011). Although a variety of distinctions have been theorised, conceptualisations and categorisations have typically been constructed within domains of preferred interest areas (Beedie, Terry et al., 2005), rather than approached from a generalisable perspective.
For example, as highlighted by Beedie, Terry et al. (2005), a
psychophysiologist may differentiate mood from emotion by comparing neural or somatic processes. Alternatively, a psycholinguist might promote semantic differences in languages (Beedie, Terry et al., 2005), even though Ekman (1994) asserted that language does not always correspond with psychological reality. Criteria constructed from physiological, neurological, behavioural, and social standpoints have each been proposed (see Ekman, 1994; Ketai, 1975; Vallerand & Blanchard, 2000; Watson & Clark, 1997). Certainly, Beedie, Terry et al. suggest that the two concepts likely warrant separation according to more than one criterion (e.g., antecedents, duration, object-relatedness, and consequences).
even predicated equivocal findings (Beedie, Terry et al., 2005). To further
complicate already convoluted theoretical matters, the mood and emotion concepts share a number of similarities. For example, each are experienced as valanced subjective feeling states (i.e., negative or positive); each operate as a function of competing priorities (e.g., those involving the person/environment; Beedie, 2005); and each demonstrate a recursive nature. Additionally, many feeling states can be experienced as either mood and/or emotion, such as anxiety and anger (Beedie, 2005).
Notwithstanding these obvious challenges, many theorists believe that mood and emotion can—and should—be distinguished (Beedie, 2005). In the search for conceptual clarity Beedie, Terry et al. (2005) conducted a comprehensive assessment of mood-emotion distinctions via content analysis. Sixty-five published studies were examined with an aim to contribute to the development of a clear scientific
distinction. From the definitions of mood and emotion provided by academics from multiple fields (i.e., sport and exercise psychology, general psychology, psychiatry, and philosophy), a number of differentiating themes emerged, such as duration (62%), intentionality (41%), cause (31%), consequences (31%) and function (18%). Additionally, physiology and awareness of cause were also mentioned.
Further to this, Beedie, Terry et al. (2005) also explored perceived differences between the mood and emotion constructs among a sample of 106 non-academic participants. In this case, inductive content analysis identified a total of 16 themes, with cause (65%), duration (40%), control (25%), experience (15%), and
of mood-emotion distinctions). Interestingly, affect was not mentioned by any participant, which according to Beedie, Terry et al. supports the notion that the term is used almost exclusively by psychologists.
Table 2.4
Selected Distinctions Between Mood and Emotion (taken from Beedie, Terry et al., 2005)
Criterion Emotion Mood
Awareness of cause Individual is aware of cause Individual may be unaware of cause
Cause Caused by a specific event or
object
Cause is less well defined Consequences Largely behavioural and
expressive
Largely cognitive
Control Not controllable More controllable
Display Displayed Less visible
Duration Brief Enduring
Intensity Intense Diffuse
Intentionality About something Not about anything in particular
Stability Fleeting and volatile More stable
Timing Rises and dissipates quickly Rises and dissipates slowly
Parkinson, Totterdell, Briner, and Reynolds (1996) stated that “emotions are caused by specific events localised in time, whereas moods build up as a
Isen, 1982; Frijda, 1986; Larsen, 2000; Gross & Thompson, 2007; Parkinson et al., 1996). As proposed by one participant “emotions come and go far quicker than moods. My emotions are quick flashes of light; they are feelings generated from experiences and events. Moods are far more prolonged ... a mood could last all day or longer” (Beedie, Terry et al., 2005, p. 864). This comment clearly highlights the duration distinction between the two experiential entities.
Although there is general agreement that the underlying phenomena are fundamentally dissimilar (albeit closely related; Lane et al., 2009; Beedie, Terry et al., 2005), some argue that mood and emotion interact and potentially overlap (Lang, 1979; Reed, 2005). A number of dynamic relationships have been hypothesised. For example, Ekman (1994) suggested that mood interacts with emotion, thereby altering the emotion threshold (i.e., the point at which an emotion is experienced).
Alternatively, Stevens (2007) argued that mood influences emotional reactions in contextual situations, with consequential feeling states then contributing to mood. Similarly, Parkinson et al. (1996) posited that emotions contribute to more enduring moods, and are cognitively interpreted depending on the mood state. Indeed, DeLancey (2006) stated that certain moods are emotions, in that “some moods are the continual or frequent presence of an emotion” (p. 527).
mood disorders, etc.; Augustine & Hemenover, 2009). In the words of Beedie, Terry et al. (2005), “emotion and mood may be different words for the same construct or different words for different constructs” (p. 848).
2.4 The Effects of Mood on Performance
The role of mood in predicting performance has been well documented, with the effects typically investigated within the context of sport (Beedie et al., 2000; Hanin, 1997; Terry, Janover, & Diment, 2004). While some studies have identified a measurable relationship (Hoffman, Bar-Eli, & Tenenbaum, 1999; Newby &
Simpson, 1994; Terry & Slade, 1995), previous research suggests that mood-performance relationships appear to vary (Lane & Chappell, 2001; Craighead,
Privette, Vallianos, & Byrkit, 1986; Terry et al., 2004). Within- and between-subject analyses indicate that idiomatic performance appears highly dependent on mood for some individuals, but remains considerably independent for others (Hanin, 1997; Lane & Chappell, 2001; Terry et al., 2004; Totterdell, 1999).
In a combination design study by Lane and Chappell (2001), idiographic and cross-sectional data were investigated with a specific goal to compare
mood-performance relationships. The POMS-A (Terry et al., 1999) and the Performance Satisfaction Questionnaire were used to quantify mood and performance
(respectively) in a sample of 10 basketball players. The results indicated that mood was significantly related to performance for the within-subject analyses (n = 5), with 40% of the variance accounted for. However, an association was unable to be
personality factors (Larsen, 2000; Shockley et al., 2012) and previous experience (Lane & Chappell, 2001).
Assuming there is large inter-individual variability, the individual zone of optimal functioning (IZOF) model suggests that emotional experiences are differentially related to successful and poor performances (refer to Figure 2.10; Jokela & Hanin, 1999). This framework contends that enhanced performance is contingent upon experiencing idiosyncratic zones of high, moderate, and low levels of arousal. Arousal levels experienced outside of any specific IZOF zone predict deterioration in performance (Russell & Cox, 2000). This framework originally focused on optimal levels of precompetition anxiety in elite sportspersons using the Stait Trait Anxiety Inventory (STAXI; discussed later) and intra- and inter-individual retrospective analyses (Hanin, 1993; Jokela & Hanin, 1999). However, a
multidimensional approach has since been taken, thereby extending the model to include positive and negative affective experiences (Hanin & Syrjä, 1995a, 1995b) as well as mood states (Prapavessis & Grove, 1991).
Alternatively, Baumeister, Vohs, DeWall, and Zhang (2007) posit that individuals develop beliefs about emotions from a combination of previous feeling states and experiences, consequently learning which states are ideal for performance. According to this theory, previous emotional reactions and learned meta-emotional beliefs influence how discrete emotions are regulated, being in accordance with anticipated feelings/corresponding outcomes (refer to Figure 2.11a and 2.11b; Baumeister et al., 2007; Lane et al., 2011). For example, activities such as running enable an athlete to experience the same repetitive physical action repeatedly (Lane et al., 2011), which allows learned associations relating to optimal or dysfunctional performances to be reinforced (refer to Figure 2.11c; Baumeister et al., 2007).
Figure 2.11a. A diagram of the process of emotion and learning for future behaviour (taken from Baumeister et al., 2007).
Figure 2.11c. A diagram of how anticipated emotional outcomes guide subsequent behaviour. Again, solid lined arrows indicate causal relationships in that the process creates the actual effect, while dash lined arrows indicate associative relationships whereby the process activates a set of associations (taken from Baumeister et al., 2007).
Figure 2.12. Morgan’s (1980, 1985) mental health model. The iceberg profile
consists of low scores on the negative mood dimensions, together with a high score on the positive mood dimension vigour (Rowley et al., 1995).
Attracting the attention of researchers, the iceberg profile has received strong support (e.g., Beedie et al., 2000; Gill, 1986; Rowley et al., 1995; Terry & Lane, 2000; Terry & Hall, 1996). Further, two additional profiles have been found. In line with Mogan’s hypothesis that “successful athletes possess more of an iceberg profile than less successful athletes” (Rowley et al., 1995, p. 186), an Everest profile has been identified (Terry, 1995). Characterised by significantly high levels of vigour (i.e., > 60%) and low levels of tension, depression, anger, fatigue, and confusion (i.e., < 40%) this profile has been found to facilitate performance and is further associated with high levels of achievement. Conversely, the inverse iceberg profile (i.e., below average vigour, and above average tension, depression, anger, fatigue, and confusion; Terry, 2005) typically debilitates performance efforts.
health model, a percentage not significantly different from that which would be expected by chance. However, the methodology of the study meant the magnitude of the effect was unable to be determined. Further, in the meta-analysis by Rowley et al. (1995), the iceberg profile accounted for less than 1% of the variance in
performance outcome, suggesting that the “utility of the POMS in predicting athletic success is questionable” (p. 185).
Further, in a meta-analytic study by Beedie et al. (2000), relationships between mood and athletic achievement (n = 13) and between mood and
performance outcome (n = 16) were investigated. Results showed that effect sizes for level of achievement were minimal, consistent with previous findings by Rowley et al. (1995). However, larger effects were identified for level of performance. The effects for vigour, confusion, and depression; for anger and tension; and for fatigue were moderate, small, and very small, respectively. Given that all results were in line with Morgan’s (1985) mental health model, it was concluded that the POMS had utility in the prediction of performance outcome, but not in the prediction of level of achievement.
Reviews by Renger (1993) and Terry (1995) suggest that such associations are likely to be subtle and complex. Further, a transactional relationship could be present (Stevens, Lane, & Terry, 2006). This notion is not surprising, given that happiness has been identified as independent of other positive mood states, with differential effects on performance (Lane & Terry, 2000). Indeed, happiness has been found to negatively impact performance through superficial cognitive
thereby facilitating improved performance. Additionally, negative mood states such as tension, depression, anger, fatigue, and confusion have also been found to
differentially influence performance (Lane & Terry, 1998, 2000).
In an attempt to provide a conceptual basis for the mood-performance relationship, Lane and Terry (2000) developed a framework using the BRUMS (discussed in Section 2.7.3) involving six dimensions of mood; namely tension, depression, anger, vigour, fatigue, and confusion. Although high vigour often evokes greater effort expenditure, confusion, depression, and fatigue have been consistently associated with debilitated performance. Findings on the dimensions of anger and tension suggest that they can either debilitate or facilitate performance, depending on the co-existence or absence of depressed mood (refer to Figure 2.13).
Figure 2.13. A conceptual model to predict performance from pre-performance mood (taken from Lane & Terry, 2000).
Depressed Mood
Increased Anger
Increased Fatigue
Reduced Vigour Increased Tension
Increased Confusion
Debilitative Effects
Reduced Facilitative Effects
No Depression
Vigour
Anger
Tension Fatigue
Confusion Debilitative Effects