The major and trace element chemistry of fish and lake water within
major South African catchments
LJ Jordaan
1,4*, V Wepener
2and JM Huizenga
2,3 1Council for Geoscience, Private Bag X112, Pretoria, 0001, South Africa2Unit for Environmental Sciences and Management, North West University, Private Bag X6001, Potchefstroom, 2520, South Africa 3School of Earth and Environmental Sciences, James Cook University, Townsville, Queensland, 4811, Australia
4Department of Zoology, University of Johannesburg, P.O. Box 524, Auckland Park, 2006, South Africa
ABSTRACT
Chemical elements in lake water are incorporated into fish tissues through bioconcentration and biomagnification. Lake water and fish tissue samples from 23 lakes, located within 4 major South African catchments, were analysed to investigate the link between element concentrations in lake water and otolith, fin spine, muscle, liver and gill tissues. The comparison is complicated by the seasonal variation in water chemistry as well as the large natural variation between individual fish within a lake. Comparisons between fish from different lakes can also only be done within the same species, which may not occur within all the lakes within the project area. This may be further complicated by erratic anthropogenic contamination. It is therefore more successful to use inter-element ratios for comparison than absolute element concentrations. Using the Sr/Ca elemental ratio, a species-specific correlation was identified between lake water, otolith, fin spine and gill tissue samples. The best discrimination between fish species was achieved using a Na/Ca versus Mg/Ca elemental ratio diagram of gill tissues. The best discrimination between fish from different lakes was achieved using a Ba/Mg versus Sr/Mg elemental ratio diagram for fin spine tissue.
Keywords: trace elements, water chemistry, fish tissue, elemental ratios, lake water, bioaccumulation
INTRODUCTION
According to Gibbs (1970), atmospheric precipitation, rock dominance and an evaporation-crystallization process are the three major mechanisms controlling surface water chemistry. The waters of rock-dominated systems are in partial equilib-rium with the materials in their catchments and their position within this group is dependent on the relief, chemical composi-tion and climate of the catchment. Gorham (1961) stated that Ca, Mg, Na and K account for most of the ionic composition of the world’s freshwater systems. Freshwater bodies should there-fore have characteristic chemistries related to the underlying geology. Fish living in these water bodies should thus also have characteristic chemistries related to these water bodies.
Dallas and Day (2004) define bioaccumulation as the ability of an organism to accumulate and concentrate sub-stances directly from the surrounding water (bioconcentra-tion) or indirectly via the food chain (biomagnifica(bioconcentra-tion). Bioaccumulation of metals by fish is influenced by a number of factors. The physico-chemical water quality conditions, e.g. pH, influence bioaccumulation indirectly by changing the solubility of metal compounds, or directly by damage to epithelia, mak-ing them more permeable. Hardness and salinity also reduce metal uptake through competition for binding sites (Jezierska and Witeska, 2006). The hydrological period is known to influence metal bioaccumulation mostly due to a concentra-tion of salts in the water during the dry season. Robinson and Avenant-Oldewage (1997) noted significant differences in metal content of fish tissues between wet and dry seasons. Kotze et al. (1999) noted significant differences in metal content of tissues
during different surveys at Lake Loskop and Mamba Weir in the Olifants River.
Coetzee et al. (2002) reported that Zn, Pb, Cr and Ni showed significant positive correlations with fish size. Nussey et al. (2000) found that the smaller the fish the higher the bodyload of metals due to various bioaccumulation processes. Coetzee et al. (2002) found few significant differences in the metal content of fish tissues between males and females. Different species may accumulate different amounts of met-als due to different living and feeding habits (Jezierska and Witeska, 2006). Kotze et al. (1999) noted species differences in metal content of tissues from fish in the Olifants River. Robinson and Avenant-Oldewage (1997), Kotze et al. (1999) and Coetzee et al. (2002) noted significant differences in metal content of fish tissue samples from distinct localities in the Olifants River.
Traditionally, bioaccumulation monitoring is used as an indicator of pollutant exposure by comparing the concentra-tions of toxicologically important metals (e.g. Cd, Pb) in an indicator species and tissue type between sites or surveys (Wepener et al., 2011). However, for the purposes of this paper, the relationship between the ratios of selected metals in fish tissue types and the water, rather than individual metal con-centrations, were used to determine if the fish tissue reflected the major geological features of the catchment. Seasonal varia-tions in the metal concentravaria-tions of lake water due to dilution by relatively clean rainwater are largely negated by the use of elemental ratios rather than absolute concentrations. Different fish tissues incorporate and retain chemical elements from the environment for varying time periods. Spine tissue bioaccumu-lates metals from the environment over a longer period than blood and muscle tissue. The seasonal variation in water chem-istry is therefore more likely to be represented in the blood and muscle tissue than in the spine tissue. A multi-year sampling campaign may therefore produce better correlation than a single sampling exercise.
* To whom all correspondence should be addressed. e-mail: wikusj@geoscience.org.za
Otoliths are acellular and metabolically inert structures that permanently retain any chemical elements that are accreted onto their growing surfaces (Campana, 1999). Secor et al. (1995) and Bath et al. (2000) noted that some otolith element ratios (Sr/Ca and Ba/Ca) are proportional to their ratios in the surrounding water. Whitledge (2008) could distinguish fish from 4 American rivers based on their otolith Sr/Ca and Ba/Ca ratios. Wells et al. (2003) investigated westslope cutthroat trout (Oncorhyncus clarki lewisi) from the Coeur d’Alene River in Idaho and found that otolith and scale chemistries were linearly related to the Sr/Ca and Ba/Ca ratios in the water. Walther and Thorrold (2006) calculated that water contributed 83% of Sr and 98% of Ba in otoliths formed in spiked seawater, implying that the chemical signatures recorded in otoliths of marine fishes should reflect the ambient water composition of these elements at the time of deposition.
Otoliths are made of calcium carbonate. Sr2+, Ba2+ and Mg2+
have very similar ionic radii to Ca2+ and can thus substitute
for Ca2+. In addition, elements like Sr, Ba, Mn, Fe, Pb, Li, Mg,
Cu and Ni are metabolically inert and are not resorbed from otoliths (Sako et al., 2005). Limburg (1995) noted that the use of Sr/Ca ratios in freshwater systems is limited relative to seawater systems, due to lower element concentrations (up to 10 times). Recent studies by Krause and Secor (2004) have however indi-cated that the range of Sr in freshwater systems may approach that of seawater. Campana (1999) observed that the concentra-tions of the most common elements (Ca, Na, K, Mg and Cl)
differ substantially between fresh and salt water, yet do not appear to be reflected in the otoliths. Trace elements like Sr, Zn, Pb, Mn, Ba and Fe in fresh and seawater are however consistent with an environmental effect.
Gillanders (2005) indicated that it is plausible that the effect of ambient Sr outweighs that of salinity. Secor et al. (1995) and Kawakami et al. (1998) positively linked the Sr/Ca ratio in sagittal otoliths to salinity. Martin et al. (2004) found signifi-cantly elevated Sr/Ca ratios in otoliths of marine larval spot (Leiostomus xanthurus) at a salinity of 25‰ vs. 15‰.
Campana (1999) noted that existing literature does not support an overall relationship between otolith Sr/Ca ratio and temperature for either fresh or seawater fish. Townsend et al. (1992) suggested that temperature-dependent Sr/Ca fractiona-tion only happens at low water temperatures (< 10°C). Martin et al. (2004) found a significant linear relationship between temperature and Sr/Ca ratios in otoliths of marine larval spot (Leiostomus xanthurus). Elsdon and Gillanders (2002, 2004)
investigated juvenile black bream (Acanthopagrus butcheri)
and found that water temperature significantly influenced the Sr/Ca and Ba/Ca ratios in otoliths while salinity alone did not influence these ratios. Bath et al. (2000) found that temperature significantly influenced Sr incorporation but not Ba incorpora-tion into otoliths of marine fish.
[image:2.595.69.541.358.709.2]The primary aim of this paper is therefore to investigate whether a simplified analytical technique will be able to relate fish tissue chemistry to water chemistry as well as to
Figure 1
Quality assurance
To evaluate the water method, liquid samples from the SABS Water-Check (group 1) inter-laboratory proficiency test (South African Bureau of Standards, 2010a, 2010b, 2010c) were regu-larly analysed. Elements analysed included Al, Ba, Be, B, Cd, Cr, Co, Cu, Fe, Pb, Mn, Hg, Mo, Ni, Si, Sr, V, Zn, As and Se.
Average Z-scores obtained were as follows: April 2010, 0.73;
June 2010, 0.73 and October 2010, 0.69. All Z-scores between −2 and 2 are considered satisfactory.
The certified reference materials DOLT-4 (Dogfish Liver) and DORM-3 (Fish Protein) (National Research Council Canada, 2007, 2008) were analysed in quadruplet to evaluate the perfor-mance of the analytical method compared to analyses by Aygun and Abanoz (2011), De La Calle et al. (2012) and Sannac et al. (2012) of the same reference material. Dilution factors were cho-sen to include both major and trace elements in the same analy-ses, which implies that the method was not sensitive enough to analyse some elements at ultra-trace levels. Only those elements that were mostly above the detection limit (more than 93% of analyses in total dataset) were considered for scientific interpre-tation (Appendix 1: Table A1). The Rb concentration in otolith samples and Ba and U in gill samples were also included even though between 10 and 20% of the data were below the detec-tion limit. The Merck VI certified calibradetec-tion standard, with the addition of certified Merck single element standards, was used to calibrate both water and fish analysis methods.
Statistical analysis
Summary statistics (mean, standard deviation) of metal con-centrations were determined using Microsoft Excel. Scatter plots of elemental ratios were manually developed to visually establish the best parameters to maximize separation of dis-similarity and minimize the separation of dis-similarity.
RESULTS AND DISCUSSION
Sample identification
In Table 1 the number of species sampled and tissues col-lected from each lake are represented. The codes provided for the different lakes and fish species are used in the figures and tables throughout the paper. The Olifants River catchment was sampled during both the wet and dry season while most of the lakes in the other catchments were sampled during only one of the seasons for water analyses. For the purpose of this project August–November is considered the dry season and December–July is considered the wet season.
Otolith tissue
From the literature it is evident that no single model has been presented that generally explains the link between metal concentrations in otoliths and water chemistry for all species across the freshwater and marine salinity and temperature range. This is however possible for specific examples. The dis-solved metal concentrations in water samples and the concen-trations of metals in the otolith tissue of carp from the project area are presented in Table 2. Discrimination between lakes is only possible if there are measurable differences in water chem-istry between these lakes, usually as a result of different catch-ment geology of anthropogenic input. Figure 2 is a diagram of distinguish between fish from different lakes. The secondary
aim is to determine whether any deviation from the expected fish tissue chemistry could be linked to either pollution events or the sampling of fish introduced from another catchment. The study was undertaken to develop a scientific method to mini-mize illegal entries at major South African freshwater fishing tournaments (Jordaan, 2015).
MATERIALS AND METHODS
Description of the project area
The project area consisted of selected lakes within the Vaal, Mgeni, Crocodile (West) and Olifants River catchments (Fig. 1). The catchments were selected due to different sizes, differ-ent sources of pollution and differdiffer-ent underlying geological composition.
Collection and preparation of samples
Samples included: water taken from the surface of lakes, and fish samples taken mainly by bank and boat angling as well as gill netting (Table 1). Water samples were collected in 2 ℓ high-density polyethylene (HDPE) containers, not acidified, cooled and sent to the laboratory for analyses within 24 h.
Four major species of fish were targeted, i.e.,
com-mon carp (Cyprinus carpio), sharptooth catfish, (Clarias
gariepinus), largemouth bass, (Micropterus salmoides), and
Mozambique tilapia (Oreochromis mossambicus). Some minor
species were also included in the analysis. Fish samples were collected in plastic containers, packed in ice and brought to the laboratory, where they were frozen to −5°C. Fish muscle samples were removed from the fillets of each fish. Fish spine samples were collected from the dorsal, ventral or pectoral fins of each fish. Otoliths and gills were extracted by dissect-ing the fish skulls from the ventral side. Liver samples were collected by ventral dissection. Samples were oven-dried at approx. 80°C for 14 days. All soft tissues were removed from spine samples, whereafter they were pulverized in a swing mill. Gill filaments were manually removed from dried gill samples before crushing.
Chemical analyses
Trace element concentration analyses of water samples con-sisted of first filtering samples through 0.45 µm cellulose nitrate filters. Water samples were then diluted 5 times to add the internal standards (In and Ir) and to reduce total dissolved
solids. The samples were made up in 2 mℓ/100 mℓ HNO3 to
keep analyte elements in solution. Analytical grade HNO3 and
ultra-pure water were used in all preparations. Samples were analysed on a Perkin Elmer SCIEX ELAN DRCII ICP-MS with AS 93 plus auto-sampler (Jordaan and Maritz, 2010).
Trace element concentration analyses of fish samples consisted of crushing the dried material with an agate mortar and pestle, or a swing mill for spine samples. Preparation of tissue samples for analyses followed a simplified version of the method described by Wepener and Vermeulen (2005). A 0.3 g
portion of sample was digested in HNO3 andHClO4 for 2 h at
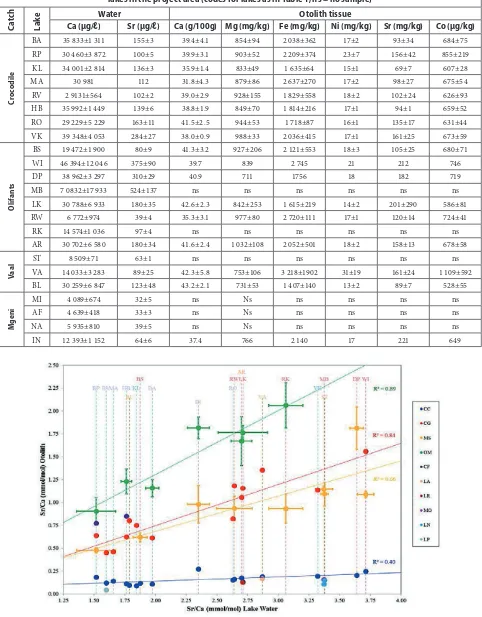
the Sr/Ca elemental ratio of lake water and fish otoliths from the project area, as used by Elsdon and Gillanders (2003) and Bath et al. (2000). There are large variations in Sr/Ca ratios of the lake water (all freshwater lakes) and overlaps between lakes from the four catchments. When considering the Olifants River catchment, the Highveld lakes have lower Sr/Ca ratios that combine to form an average for Lake Loskop. Downstream the Olifants River mixes with water from the Elands River with a much higher Sr/Ca ratio to produce an intermediate ratio at Lake Arabie. The Vaal River catchment shows an increase in Sr/Ca ratio along the length of the project area. In the Crocodile River catchment trends are opposite for the Lake Rietvlei and Lake Roodeplaat systems.
The largest variation in Sr/Ca ratios of the otoliths is related to the specific fish species, as indicated by the linear regressions of the data from the project area (Fig. 2). Even though data were collected over several years during both the
[image:4.595.69.543.116.542.2]wet and dry seasons, which implies that there may be signifi-cant variation in the data from a single lake, the data are still relatively constant and separated mainly according to species. According to the literature, water (i.e. environmental expo-sure) has the major influence on otolith chemistry and food the least (Walther and Thorrold, 2006). Fish behaviour may thus not play a significant role in otolith chemistry. Salinity should not play a major role in this study since all lakes are freshwater lakes even though some are moderately polluted. A clear trend from lakes in colder areas to lakes in warmer areas was also not observed. The major extrinsic contributing factor thus appears to be the chemistry of the lake water while an intrinsic factor may be due to physiological mechanisms of otolith formation that possibly differs between fish species (Campana, 1999). Fish must however be in equilibrium with lake water and must not be able to migrate between different lakes or catchments.
TABLE 1
Codes for the different lakes and fish species are indicated. Numbers in matrix indicate the number of target species analysed per lake and tissue type. ‘No sample’ is indicated by ns. Otolith tissue is indicated by o. Spine tissue is indicated
by s. Muscle tissue is indicated by m. Liver tissue is indicated by l. Gill tissue is indicated by g. The sum of otolith, spine, muscle, liver and gill tissue samples is indicated by o, s, m, l, g combined. Lake water samples were mainly collected between
2007 and 2009. Fish samples were mainly collected between 2007 and 2011. Both sexes were collected during wet and dry seasons.
Ca
tc
hm
en
t
La
ke
Co
de
Target species Minor species
Cyprinus carpio (CC-common carp) Clarias gariepinus (CG-sharptooth catfish) Micropterus salmoides (MS-largemouth bass) Oreochromis mossambicus (OM-Mozambique tilapia) Chetia flaviventris (CF-canary kurper) Labeo capensis ( LA-Orange River mudfish) Labeo cylindricus (LC - redeye mudfish) Labeo ruddi (LU-silver mudfish) Labeo rosae (LR-rednose mudfish) Labeo umbratus (MO-moggel) Labeobarbus aeneus (LN-smallmouth yellowfish) Labeobarbus polylepis (LP-smallscale yellowfish)
Tissue o s m l g s o, s, m, l, g combined
Cro
co
di
le
(W
es
t)
Bon Accord BA 4 4 4 3 4 3 3 4 ns ns ns ns ns ns ns ns
Roodeplaat RP 3 3 3 3 3 5 3 5 4 ns ns ns ns ns ns ns
Klipvoor KL 5 5 5 5 4 ns ns ns ns ns ns ns ns ns ns
Marais MA 6 6 5 6 6 6 ns ns ns ns ns ns ns ns ns ns
Rietvlei RV 3 3 3 3 3 5 ns ns 8 ns ns ns ns ns ns 18
Hartbeespoort HB 2 3 3 3 3 4 ns 5 11 ns ns ns ns ns ns ns
Roodekopjes RO 5 6 5 5 5 4 ns ns ns ns ns ns ns ns ns ns
Vaalkop VK 5 5 5 5 5 5 ns ns ns ns ns ns ns ns ns ns
O
lif
ant
s
Bronkhorstspruit BS 3 3 4 4 5 ns 4 ns ns ns ns ns ns ns ns ns
Witbank WI ns 1 1 1 5 1 ns ns ns ns ns ns ns ns ns ns
Doornpoort DP 1 1 1 1 5 1 1 ns ns ns ns ns ns ns ns ns
Middelburg MB 1 ns ns ns ns ns 2 ns ns ns ns ns ns 12 10 ns
Loskop LK 14 48 16 16 16 4 ns 15 ns ns ns ns 16 ns ns ns
Rust de Winter RW 2 4 4 4 4 2 4 5 ns ns ns ns ns ns ns ns
Rhenosterkop RK ns ns ns ns ns ns 5 5 ns ns 6 9 ns 1 ns ns
Arabie AR 2 2 3 2 3 1 ns 6 ns ns ns ns ns ns ns ns
V
aal
Sterkfontein ST ns ns ns ns ns ns 5 ns ns ns ns ns ns ns 15 ns
Vaal VA 15 28 16 15 17 12 ns ns ns 28 ns ns ns ns ns ns
Bloemhof BL 9 31 22 22 22 8 ns ns ns ns ns ns ns ns ns ns
M
ge
ni
Midmar MI ns ns ns ns ns ns ns ns ns ns ns ns ns ns ns ns
Albert Falls AF ns ns ns ns ns ns ns ns ns ns ns ns ns ns ns ns
Nagle NA ns ns ns ns ns ns ns ns ns ns ns ns ns ns ns ns
TABLE 2
Average (± standard deviation) lake water chemistry and average metal content of carp otolith tissue from the different lakes in the project area (codes for lakes as in Table 1; ns = no sample)
Ca
tc
h
La
ke Water Otolith tissue
Ca (µg/ℓ) Sr (µg/ℓ) Ca (g/100g) Mg (mg/kg) Fe (mg/kg) Ni (mg/kg) Sr (mg/kg) Co (µg/kg)
Cro
co
di
le
BA 35 833±1 311 155±3 39.4±4.1 854±94 2 038±362 17±2 93±34 684±75
RP 30 460±3 872 100±5 39.9±3.1 903±52 2 209±374 23±7 156±42 855±219
KL 34 001±2 814 136±3 35.9±1.4 833±49 1 635±64 15±1 69±7 607±28
MA 30 981 112 31.8±4.3 879±86 2 637±270 17±2 98±27 675±54
RV 2 9131±564 102±2 39.0±2.9 928±155 1 829±558 18±2 102±24 626±93
HB 35 992±1 449 139±6 38.8±1.9 849±70 1 814±216 17±1 94±1 659±52
RO 29 229±5 229 163±11 41.5±2.5 944±53 1 718±87 16±1 135±17 631±44
VK 39 348±4 053 284±27 38.0±0.9 988±33 2 036±415 17±1 161±25 673±59
O
lif
ant
s
BS 19 472±1 900 80±9 41.3±3.2 927±206 2 121±553 18±3 105±25 680±71
WI 46 394±12 046 375±90 39.7 839 2 745 21 212 746
DP 38 962±3 297 310±29 40.9 711 1756 18 182 719
MB 7 0832±17 933 524±137 ns ns ns ns ns ns
LK 30 788±6 933 180±35 42.6±2.3 842±253 1 615±219 14±2 201±290 586±81
RW 6 772±974 39±4 35.3±3.1 977±80 2 720±111 17±1 120±14 724±41
RK 14 574±1 036 97±4 ns ns ns ns ns ns
AR 30 702±6 580 180±34 41.6±2.4 1 032±108 2 052±501 18±2 158±13 678±58
V
aal
ST 8 509±71 63±1 ns ns ns ns ns ns
VA 14 033±3 283 89±25 42.3±5.8 753±106 3 218±1902 31±19 161±24 1 109±592
BL 30 259±6 847 123±48 43.2±2.1 731±53 1 407±140 13±2 89±7 528±55
M
ge
ni
MI 4 089±674 32±5 ns Ns ns ns ns ns
AF 4 639±418 33±3 ns Ns ns ns ns ns
NA 5 935±810 39±5 ns Ns ns ns ns ns
IN 12 393±1 152 64±6 37.4 766 2 140 17 221 649
Figure 2
Comparison between average Sr/Ca (mmol/mol) elemental ratio of fish otoliths and lake water from the project area (codes for lakes and fish species as in Table 1). The error bars indicate one standard deviation below and above average. Only standard deviations for OM and MS are indicated as it shows
[image:5.595.51.535.85.709.2]Together with the modified alkali-lime index [Na2O+K2O–CaO] and the aluminium saturation index [Al/(Ca–1.67P+Na+K)], the Fe/Mg ratio is often used as a means of rock classification in igneous geology (Frost et al., 2001). This primary variation in the Fe/Mg ratio may induce variation in weathered/transported materials and the water that contributes to these processes. Lake sediments and the otoliths of fish within these lakes may thus show variation in their Fe/Mg ratio, in part due to the chemistry and weathering processes in the upper catchment. Figure 3 is a diagram of Fe versus Mg of fish otoliths from the project area normalized to Ca, used as a discrimination diagram. Solid symbols indicate carp otoliths and are divided according to the lakes from where they were collected. Open symbols indicate the rest of the otoliths and are only divided according to species. The Mg/Ca parameter distinguishes between 3 groups of species (carp; labeo; tilapia, bass and catfish). The Fe/Ca parameter distinguishes mostly between dif-ferent lakes even though much overlap exists. A similar distinc-tion between lakes is seen in all species investigated. Fe and Mg are thus not incorporated into otoliths in exactly the same manner for all species while the chemistry of the environment is roughly reflected. A clear distinction can also not be made between otoliths from different catchments.
Cobalt and Ni can sometimes be used as indicators of genetic processes (Herd et al., 2009) and ore-forming processes (Bralia et al., 1979) in geology. According to the Goldschmidt classification (Battey, 1981) both Co and Ni are siderophile elements and are thus normalized to Fe. Figure 4 represents the Co/Fe elemental ratio versus the Ni/Fe elemental ratio of fish otoliths from the project area. A positive correlation is observed between these two components. The diagram does not dis-tinguish between different fish species. Only carp (large solid symbols), bass, tilapia and catfish otoliths are indicated on the diagram, but all samples obtained from the project area follow the same trend. Distinction between otoliths from different
lakes can broadly be made although large overlaps do occur. Co and Ni are thus incorporated into otoliths in a fashion indicat-ing environmental chemistry rather than differences between species.
The bass populations from Lake Middelburg and Lake Witbank contain one individual each that has extremely elevated Ni/Fe otolith ratios (Fig. 4). These lakes are directly downstream from a severely polluted coal-mining area. The area also contains coal-fired power stations and steel mills uti-lizing iron ore from the Bushveld Igneous Complex, providing an ample Ni source.
Plotting the different elements detected in the fish otoliths from the project area in a similar fashion as in Figs 3 and 4 allow distinction between 2 groups of elements: Sr, Ba, Na, K, P and Mg, which best distinguish between different fish spe-cies and to a lesser degree between different lakes, and Fe, Co, Ni, Mn, Ga, V and Ca which only broadly distinguish between lakes. It was not possible to use La, Pr and Sm to distinguish between lakes.
Spine tissue
Biomineralization of otoliths, discussed above, differs from ver-tebrate bone in that otolith epithelium is not in direct contact with the region of calcification (Campana, 1999). However, in
an experiment where juvenile snapper (Pagrus auratus) were
exposed to water with elevated Sr concentrations (10 x ambi-ent) for 5 days it was shown by Pollard et al. (1999) that Sr is absorbed from the water and deposited in the dorsal spines where it was persistent for at least 36 days and showed no sign of decay during the experiment.
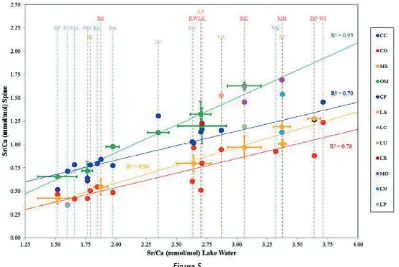
[image:6.595.104.505.441.709.2]The concentrations of metals in the spine tissue of the four target fish species from the different lakes are presented in Table 3. Using a plot of the Sr/Ca elemental ratio of lake water versus fish otoliths, as used by Bath et al. (2000) and Elsdon and
Figure 3
Gillanders (2003) for plotting spine samples from the project area, provides similar results as obtained for otoliths (Fig. 5). The regression of the carp spine data however exhibits a steeper slope while the data spread is greater. Carp spine sam-ples from Lake Inanda, Lake Vaalkop and Lake Roodeplaat
Figure 4
[image:7.595.105.504.435.702.2]Co/Fe (mmol/mol) elemental ratio versus Ni/Fe (mmol/mol) elemental ratio of carp, bass and catfish otoliths from the project area (codes for lakes and fish species as in Table 1).
Figure 5
Comparison between average Sr/Ca (mmol/mol) elemental ratio of fish spine and lake water from the project area (codes for lakes and fish species as in Table 1). The error bars indicate one standard deviation below and above average. Only standard deviations for OM and MS are indicated as it shows
TABLE 3
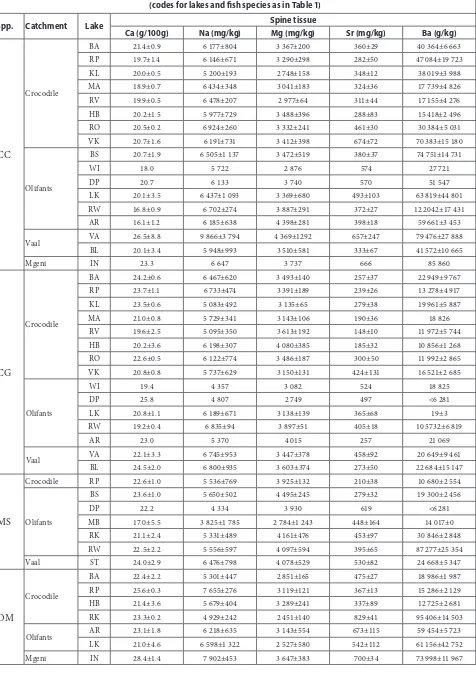
Average (± standard deviation) metal content of carp, catfish, bass and tilapia spine tissue from project area lakes (codes for lakes and fish species as in Table 1)
Spp. Catchment Lake Spine tissue
Ca (g/100g) Na (mg/kg) Mg (mg/kg) Sr (mg/kg) Ba (g/kg)
CC
Crocodile
BA 21.4±0.9 6 177±804 3 367±200 360±29 40 364±6 663
RP 19.7±1.4 6 146±671 3 290±298 282±50 47 084±19 723
KL 20.0±0.5 5 200±193 2 748±158 348±12 38 019±3 988
MA 18.9±0.7 6 434±348 3 041±183 324±36 17 739±4 826
RV 19.9±0.5 6 478±207 2 977±64 311±44 17 155±4 276
HB 20.2±1.5 5 977±729 3 488±396 288±83 15 418±2 496
RO 20.5±0.2 6 924±260 3 332±241 461±30 30 384±5 031
VK 20.7±1.6 6 191±731 3 412±398 674±72 70 383±15 180
Olifants
BS 20.7±1.9 6 505±1 137 3 472±519 380±37 74 751±14 731
WI 18.0 5 722 2 876 574 27 721
DP 20.7 6 133 3 740 570 51 547
LK 20.1±3.5 6 437±1 093 3 369±680 493±103 63 819±44 801
RW 16.8±0.9 6 702±274 3 887±291 372±27 12 2042±17 431
AR 16.1±1.2 6 185±638 4 398±281 398±18 59 661±3 453
Vaal VA 26.5±8.8 9 866±3 794 4 369±1292 657±247 79 476±27 888
BL 20.1±3.4 5 948±993 3 510±581 333±67 41 572±10 665
Mgeni IN 23.3 6 647 3 737 666 85 860
CG
Crocodile
BA 24.2±0.6 6 467±620 3 493±140 257±37 22 949±9 767
RP 23.7±1.1 6 733±474 3 391±189 239±26 13 278±4 917
KL 23.5±0.6 5 083±492 3 135±65 279±38 19 961±5 887
MA 21.0±0.8 5 729±341 3 143±106 190±36 18 826
RV 19.6±2.5 5 095±350 3 613±192 148±10 11 972±5 744
HB 20.2±3.6 6 198±307 4 080±385 185±32 10 856±1 268
RO 22.6±0.5 6 122±774 3 486±187 300±50 11 992±2 865
VK 20.8±0.8 5 737±629 3 150±131 424±131 16 521±2 685
Olifants
WI 19.4 4 357 3 082 524 18 825
DP 25.8 4 807 2 749 497 <6 281
LK 20.8±1.1 6 189±671 3 138±139 365±68 19±3
RW 19.2±0.4 6 835±94 3 897±51 405±18 10 5732±6 819
AR 23.0 5 370 4 015 257 21 069
Vaal VA 22.1±3.3 6 745±953 3 447±378 458±92 20 649±9 461
BL 24.5±2.0 6 800±935 3 603±374 273±50 22 684±15 147
MS
Crocodile RP 22.6±1.0 5 536±769 3 925±132 210±38 10 680±2 554
Olifants
BS 23.6±1.0 5 650±502 4 495±245 279±32 19 300±2 456
DP 22.2 4 334 3 930 619 <6 281
MB 17.0±5.5 3 825±1 785 2 784±1 243 448±164 14 017±0
RK 21.1±2.4 5 331±489 4 161±476 453±97 30 846±2 848
RW 22.5±2.2 5 556±597 4 097±594 395±65 87 277±25 354
Vaal ST 24.0±2.9 6 476±798 4 078±529 530±82 24 668±5 347
OM
Crocodile
BA 22.4±2.2 5 301±447 2 851±165 475±27 18 986±1 987
RP 25.6±0.3 7 655±276 3 119±121 367±13 15 286±2 129
HB 21.4±3.6 5 679±404 3 289±241 337±89 12 725±2 681
RK 23.3±0.2 4 929±242 2 451±140 829±41 95 406±14 503
Olifants AR 23.1±1.8 6 218±635 3 143±554 673±115 59 454±5 723
LK 21.0±4.6 6 598±1 322 2 527±580 542±112 61 156±42 752
Using Fe as a discriminator between spine samples from the project area, as was done for the otolith samples (Fig. 3), did not produce the expected results. A diagram of Na versus Mg normalized to Ca did however distinguish better between fish species as well as individual lakes (Fig. 6).
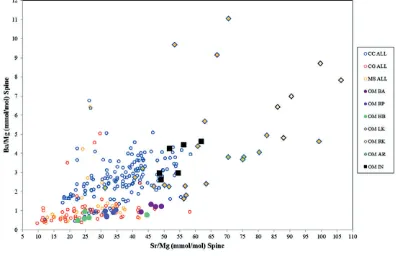
Following the identification of elements from otoliths that are more suitable to discriminating between species (Sr, Ba, Na, K, P and Mg), a diagram of Ba versus Sr normalized to Mg pro-duced some separation between fish spine samples from different
[image:9.595.103.498.157.414.2]lakes and to a lesser extent from different species (Fig. 7). Barium versus Sr normalized to Ca gives similar results, but with less separation of the tilapia spine samples. Figures 8, 9 and 10 show catfish, bass and tilapia spine samples, respectively, plotted per lake for comparison with Fig. 7 where carp samples are plot-ted per lake. In all three species the samples from a specific lake cluster together and are separated from samples from other lakes, indicating that the Ba/Mg versus Sr/Mg plot can successfully distinguish between fish from different lakes for at least 4 species.
Figure 6
Na/Ca (mmol/mol) elemental ratio versus Mg/Ca (mmol/mol) elemental ratio of fish spine tissue from the project area (codes for lakes and fish species as in Table 1).
Figure 7
[image:9.595.100.498.452.712.2]Muscle tissue
[image:10.595.114.509.47.316.2]Metal concentrations in the muscle tissue of carp from the different lakes are presented in Table 4. Rb is the only ele-ment that shows some differentiation between fish mus-cle from the different lakes. When plotted against P and
Figure 8
Ba/Mg (mmol/mol) elemental ratio versus Sr/Mg (mmol/mol) elemental ratio of fish spine tissue from the project area. Individual catfish samples are indicated by solid symbols (codes for lakes and fish species as in Table 1).
Figure 9
Ba/Mg (mmol/mol) elemental ratio versus Sr/Mg (mmol/mol) elemental ratio of fish spine tissue from the project area. Individual bass samples indicated by solid symbols (codes for lakes and fish species as in Table 1).
[image:10.595.110.509.361.626.2]Liver tissue
[image:11.595.94.490.52.311.2]Liver tissue contained higher concentrations of trace ele-ments than other tissues, which made additional comparison of samples at trace element level possible. The concentrations of metals in the liver tissue of carp from the different lakes are presented in Table 5. Major elements did not distinguish between different species or between liver samples from
Figure 10
[image:11.595.96.499.355.628.2]Ba/Mg (mmol/mol) elemental ratio versus Sr/Mg (mmol/mol) elemental ratio of fish spine tissue from the project area. Individual tilapia samples indicated by solid symbols (codes for lakes and fish species as in Table 1).
Figure 11
Rb/Mg (mmol/mol) elemental ratio versus P/Mg (mmol/mol) elemental ratio of fish muscle from the project area (codes for lakes and fish species as in Table 1).
TABLE 4
Average (± standard deviation) metal content of carp muscle tissue from the different lakes in the project area
(codes for lakes as in Table 1; ns = no sample)
Catch. Lake
Muscle tissue Mg
(g/kg) (mg/kg)P (mg/kg)Rb
Crocodile
BA 1 169±149 8 629±1 034 8±2
RP 1 033±234 10 357±1 137 12±3
KL 773±28 7 465±796 9±1
MA 989±123 10 575±705 15±1
RV 965±215 9 170±1 584 12±2
HB 1 106±342 9 438±2 393 12±4
RO 787±117 7 142±1 299 7±1
KL 1 415±136 10 751±1 388 9±2
Olifants
BS 793±369 8 862±2 668 8±4
WI 1239 10 655 12
DP 797 nd 7
LK 1 013±183 8 973±928 10±2
RW 945±92 9 339±2 061 14±3
AR 1 143±86 9 240±506 11±2
Vaal VA 1 015±274 8 804±1 027 5±3
BL 965±147 7 991±823 5±2
Mgeni IN 1 315 9 252 12
TABLE 5
Average (± standard deviation) metal content of carp liver tissue from the different lakes in the project area
(codes for lakes as in Table 1; ns = no sample)
Catch. Lake
Liver tissue Zn
(mg/kg) (μg/kg)Rb (μg/kg)Mo (μg/kg)Co
Crocodile
BA 2 008±967 3 940±924 1 638±199 387±71
RP 691±356 6 722±896 715±430 112±69
MA 805±326 7 247±896 1 759±942 348±199
RV 904±136 6 345±865 1 741±525 365±84
HB 880±345 8 093±2311 822±505 224±70
RO 612±221 4 817±898 683±200 584±538
VK 1 175±404 4 439±1 386 1 302±363 560±227
Olifants
BS 1 539±1401 4 969±1 555 459±147 226±202
WI 3 077 5 294 418 450
DP 755 4 940 489 224
LK 587±299 6 448±3 200 944±352 422±259 RW 225±90 8 751±3 544 1 216±212 234±67
AR 522±56 6 925±538 753±164 226±105
Vaal VA 885±418 3 449±2 194 1 037±451 632±368
BL 710±448 3 408±1 221 765±309 399±216
Mgeni IN 1 152 4 020 552 691
Figure 12
Co/Mo (mol/mol) elemental ratio versus Zn/Rb (mol/mol) elemental ratio of fish liver from the project area (codes for lakes and fish species as in Table 1).
catchment 3 groups can be identified: (i) Lake Rust de Winter, (ii) Lake Witbank and (iii) Lakes Bronkhorstspruit, Loskop and Arabie. If a connection between water quality and fish tissue elemental concentrations is assumed than the separation may be explained as Lake Rust de Winter is in the Elands River, a
Roodeplaat the division is based on different tributaries within the catchment. A clear distinction is not found for the two lakes in the Vaal River catchment. If the liver is considered a tran-sient location of elements (higher throughput rate) then it may capture shorter-term chemical variations in the environment better than bone or muscle tissue.
Gill tissue
Gill metal loadings have good potential for correlation with metals dissolved in lake waters as gills are in direct contact with the lake water. This is also the basic assumption behind the biotic ligand model used to predict toxicity due to dissolved metals (Niogi and Wood, 2004). The concentrations of met-als in the gills of carp from the different lakes are presented in Table 6. Using a plot of the Sr/Ca elemental ratio of lake water versus fish otoliths as used by Bath et al. (2000) and Elsdon and Gillanders (2003) for plotting gill samples from the project area, again exhibits similar results to otoliths (Fig. 13). A clear correlation is observed between lake water and fish gills with good separation between the different species. Labeos corre-spond with either carp or tilapia while bass and catfish greatly overlap.
[image:13.595.58.534.427.740.2]Figure 14 represents the Mg/Ca elemental ratios versus the Na/Ca elemental ratios of fish gill samples from the project area. It completely separates carp, bass, tilapia and catfish, as well as most of the labeo species. Both ratios span a much wider range than for the spine samples (Fig. 6) and thus produce a better separation between species. Within species the Mg/Ca and Na/Ca ratios can however not separate between samples from individual lakes.
TABLE 6
Average (± standard deviation) metal content of carp liver tissue from the different lakes in the project area (codes for lakes as in Table 1; ns = no sample)
Catch. Lake
Gill tissue Ca
(g/100g) (mg/kg)Na (mg/kg)Mg (μg/kg)Sr (μg/kg)Ni (μg/kg)Co
Crocodile
BA 9.7±1.1 4 653±777 7 405±607 309±38 3654±507 698±459
RP 8.0±1.0 4 646±559 5 745±1 306 238±85 4 258±846 265±43
KL 7.9±1.4 1 840±173 5 817±801 304±50 3 846±820 403±92
MA 8.4±1.0 3 842±568 6 432±963 303±26 7 933±3 582 589±269
RV 10.2±0.8 5 240±1 924 7 741±1 453 310±34 3 508±473 601±143
HB 9.1±1.2 5 267±1 811 6 746±1 141 304±48 3 586±283 303±74
RO 8.0±0.7 3 611±393 5 877±414 338±23 2 073±172 616±379
VK 9.3±1.4 4 049±740 7 330±850 587±97 3 340±855 697±229
Olifants
BS 7.4±4.0 3 770±1 554 6 176±3 017 257±156 3 927±515 552±341
WI 8.7 4 645 7 365 636 3 118 741
DP 11.2 5 077 8 490 612 5 758 515
LK 9.0±2.7 5 536±1 590 6 910±1 698 424±118 3 872±1 965 1 043±749
RW 7.1±0.7 4 407±481 5 815±677 358±66 4 535±647 469±166
AR 8.6±1.5 3 970±504 6 136±1 420 389±83 3 522±1 040 435±179
Vaal VA 10.0±1.8 6 826±2 873 7 879±1 445 458±84 7 529±5 015 1 111±404
BL 8.8±1.0 4 422±1 217 6 975±743 291±55 8 609±19 223 1 122±799
Mgeni IN 8.3 4 480 5 166 368 3 423 476
Figure 15 is a diagram of the Co/Ni elemental ratio versus the Sr/Ca elemental ratio of fish gill samples from the pro-ject area. In this case a clear separation is observed between different species as well as between fish from specific lakes as demonstrated by the carp samples. The Co/Ni ratio is the main factor separating the bass, tilapia and catfish samples while the Sr/Ca ratio is the prominent ratio in defining the carp as a group as well as separating carp samples from indi-vidual lakes. This diagram produces the best discrimination between Lakes Vaal and Lake Bloemhof. Distinction between carp samples from the Olifants River catchment is not clear while carp samples from the Crocodile River catchment show much less overlap.
CONCLUSIONS
When comparing lake water chemistry to fish tissue chemistry there are several important factors to consider. Firstly there must be a measurable difference in water chemistry between the different lakes within the project area, which is predomi-nantly controlled by the underlying geology and the anthro-pogenic activity within the catchment. Secondly the fish must be in equilibrium with the lake water and must not be able to migrate between different lakes or catchments.
Figure 13
Comparison between average Sr/Ca (mmol/mol) elemental ratio of fish gills and lake water from the project area (codes for lakes and fish species as in Table 1). The error bars indicate one standard deviation below and above average. Only standard deviations for OM and MS are indicated as it shows
[image:14.595.112.523.422.707.2]the typical ranges for all the data. Solid lines indicate linear regression lines of the average ratios of the target species per lake.
Figure 14
diagrams in discriminating between fish species and lakes is given in Table 7. Using other elemental ratios was less success-ful, mainly due to the low abundance of these elements in lake water.
Considering only fish tissue samples, the best separation between species was achieved using a Na/Ca versus Mg/Ca elemental ratio diagram for gill tissue, followed by a Co/Mo versus Zn/Rb elemental ratio diagram for liver tissue. The best discrimination between fish from different lakes was achieved using a using a Ba/Mg versus Sr/Mg elemental ratio diagram for spine tissue from carp, catfish, bass and tilapia.
ACKNOWLEDGEMENTS
The authors would like to acknowledge Bella Honeybourne, the organizing committee of the ‘Three Species Bonanza’, EcoCare Trust, Waterlab and the various nature conservation organiza-tions for their support during fieldwork as well as the Council for Geoscience and the University of Johannesburg for financial and technical support.
REFERENCES
AYGUN SF and ABANOZ FG (2011) Determination of heavy metal in anchovy (Engraulis encrasicolus L. 1758) and whiting (Merlangius merlangus euxinus Nordman, 1840) fish in the middle Black Sea.
Kafkas Univ. Vet. Fak. Derg 17 (Suppl A) S145–152.
BATH GE, THORROLD, SR, JONES CM, CAMPANA SE, MCLAREN JW and LAM WH (2000) Strontium and barium uptake in aragonite otoliths of marine fish. Geochim. Cosmochim. Acta. 64
1705–1714.
BATTEY MH (1981) Mineralogy for Students (2nd edn). Longman,
London and New York. 355 pp.
BRALIA A, SABATINI G and TROYA F (1979) A revaluation of the Co/Ni ratio in pyrite as geochemical tool in ore genesis. Miner.
[image:15.595.101.502.50.319.2]Deposita 14 (3) 353–374. http://dx.doi.org/10.1007/BF00206365
Figure 15
[image:15.595.298.533.370.649.2]Diagram of the Sr/Ca (mmol/mol) elemental ratio versus Co/Ni (mmol/mol) elemental ratio of gills from the project area (codes for lakes and fish species as in Table 1)
TABLE 7
Summary of effectiveness of elemental ratio diagrams for discriminating between species and lakes (codes for lakes and fish species as in Table 1).
1 = Effective, 2 = Partial, 3 = Ineffective
Ratios Tissue Species Lakes Comment Figure Sr/Ca
vs. Sr/Ca Otolith, water 1 2 2
Fe/Ca
vs. Mg/Ca Otolith, water 3 3 3
Co/Fe
vs. Ni/Fe Otolith 3 2 4
Sr/Ca
vs. Sr/Ca Spine, water 2 2 5
Na/Ca
vs. Mg/Ca Spine 2 2 6
Ba/Mg
vs. Sr/Mg CG, MS, OM)Spine (CC, 2 1 Best for lakes 7, 8, 9,10 Rb/Mg
vs. P/Mg Muscle 2 2 11
Co/Mo
vs. Zn/Rb Liver 1 2 Best for species 12
Sr/Ca
vs. Sr/Ca Gill, water 2 2 13
Na/Ca
vs. Mg/Ca Gill 1 3 Best for species 14
Sr/Ca
vs. Co/Ni Gill 1 2 15
CAMPANA SE (1999) Chemistry and composition of fish otoliths: Pathways, mechanisms and applications. Mar. Ecol. Prog. Ser. 188
236–297. http://dx.doi.org/10.3354/meps188263
COETZEE L, DU PREEZ HH and VAN VUREN JHJ (2002) Metal concentrations in Clarias gariepinus and Labeo umbratus from the Olifants and Klein Olifants River, Mpumalanga, South Africa: Zinc, copper, manganese, lead, chromium, nickel, aluminium and iron.
DALLAS HF and DAY JA (2004) The effect of water quality variables on aquatic ecosystems: A review. WRC Report No. TT 224/04. Water Research Commission, Pretoria. 222 pp.
DE LA CALLE I, COSTAS M, CABALEIRO N, LAVILLA I and BENDICHO C (2012) Use of high-intensity sonication for pre-treatment of biological tissues prior to multi-elemental analysis by total reflection X-ray fluorescence spectrometry. Spectrochim. Acta
Part B 67 43–49. http://dx.doi.org/10.1016/j.sab.2011.12.007
ELSDON TS and GILLANDERS BM (2002) Interactive effects of temperature and salinity on otolith chemistry: challenges for deter-mining environmental histories of fish. Can. J. Fish. Aquat. Sci. 59
1796–1808. http://dx.doi.org/10.1139/f02-154
ELSDON TS and GILLANDERS BM (2003) Relationship between water and otoliths elemental concentrations in juvenile black bream
Acanthopagrus butcheri. Mar. Ecol. Prog. Ser. 260 263–272. http://
dx.doi.org/10.3354/meps260263
ELSDON TS and GILLANDERS BM (2004) Fish otolith chemistry influenced by exposure to multiple environmental variables. J.
Exp. Mar. Biol. Ecol. 313 269–284. http://dx.doi.org/10.1016/j.
jembe.2004.08.010
FROST BR, BARNES CG, COLLINS WJ, ARCULUS RJ, ELLIS DJ and FROST CD (2001) A geochemical classification for granitic rocks. J. Petrol. 42 (11) 2033–2048. http://dx.doi.org/10.1093/ petrology/42.11.2033
GIBBS RJ (1970) Mechanisms controlling world water chem-istry. Science 170 1088–1090. http://dx.doi.org/10.1126/ science.170.3962.1088
GILLANDERS BM (2005) Otolith chemistry to determine move-ments of diadromous and freshwater fish. Aquat. Living Resour. 18
291–300. http://dx.doi.org/10.1051/alr:2005033
GORHAM E (1961) Factors influencing supply of major ions to inland waters, with special reference to the atmos-phere. Geol. Soc. Am. Bull. 72 795–840. http://dx.doi. org/10.1130/0016-7606(1961)72[795:FISOMI]2.0.CO;2
HERD CDK, DWARZSKI RE and SHEARER C (2009) The behaviour of Co and Ni in olivine in planetary basalts: An experimental investigation. Am. Mineral. 94 244–255. http://dx.doi.org/10.2138/ am.2009.2768
JEZIERSKA B and WITESKA M (2006) The metal uptake and accu-mulation in fish living in polluted waters. In: Twardowska I, Allen HE, Hagblom MM and Stefaniak S (eds) Soil and Water Pollution Monitoring, Protection and Remediation. Springer, Krakow, Poland. 107–114. http://dx.doi.org/10.1007/978-1-4020-4728-2_6
JORDAAN LJ (2015) Determining the role of catchment geochemistry on the chemistry of water, sediment and fish from impoundments within selected large catchments in South Africa. PhD thesis, Department of Zoology, University of Johannesburg. URL: http:// hdl.handle.net/10210/13873. 281 pp.
JORDAAN LJ and MARITZ H (2010) Analytical methods 2009. Council for Geoscience analytical Chemistry Laboratory. Confidential report 2010-0088. Council for Geoscience, Pretoria, South Africa. KAWAKAMI Y, MOCHIOKA N, MORISHITA K, TAJIMA T,
NAKAGAWA H, TOH H and NAKAZONO A (1998) Factors influencing otolith strontium/calcium ratios in Anguilla japonica elvers. Environ. Biol. Fishes 52 (1–3) 299–303. http://dx.doi. org/10.1023/A:1007415420540
KOTZE P, DU PREEZ HH and VAN VUREN JHJ (1999)
Bioaccumulation of copper and zinc in Oreochromis mossambicus and Clarias gariepinus, from the Olifants River, Mpumalanga, South Africa. Water SA 25 (1) 99–110.
KRAUSE RT and SECOR DH (2004) Incorporation of strontium into otoliths of an estuarine fish. J. Exp. Mar. Biol. Ecol. 302 85–106. http://dx.doi.org/10.1016/j.jembe.2003.10.004
LIMBURG KE (1995) Otolith strontium trace environmental history of subyearling American shad Aloas sapidissima. Mar. Ecol. Prog. Ser.
119 25–35. http://dx.doi.org/10.3354/meps119025
MARTIN GB, THORROLD SR and JONES CM (2004) Temperature and salinity effects on strontium incorporation in otoliths of larval spot (Leiostomus xanthurus). Can. J. Fish. Aquat. Sci. 61 34–42. http://dx.doi.org/10.1139/f03-143
NATIONAL RESEARCH COUNCIL CANADA (2007) DORM-3 Fish protein certified reference material for trace metals. Institute for National Measurement Standards, National Research Council, Canada. 4 pp.
NATIONAL RESEARCH COUNCIL CANADA (2008) DOLT-4. Dogfish liver certified reference material for trace metals. Institute for National Measurement Standards, National Research Council, Canada. 4 pp.
NIOGI S and WOOD CM (2004) Biotic ligand model, a flexible tool for developing site-specific water quality guidelines for metals.
Envron. Sci. Technol. 38 (23) 6177–6192. http://dx.doi.org/10.1021/
es0496524
NUSSEY G, VAN VUREN JHJ and DU PREEZ HH (2000)
Bioaccumulation of chromium, manganese, nickel and lead in the tissues of the moggel, Labeo umbratus (Cyprinidae), from Witbank Dam, Mpumalanga. Water SA 26 (2) 269–284.
POLLARD MJ, KINGSFORD MJ and BATTAGLENE SC (1999) Chemical marking of juvenile snapper, Pagrus auratus (Paridae), by incorporation of strontium into dorsal spines. Fish. Bull. 97(1) 118–131.
ROBINSON J and AVENANT-OLDEWAGE A (1997) Chromium, copper, iron and manganese bioaccumulation in some organs and tissues of Oreochromis mossambicus from the lower Olifants River, inside the Kruger National Park. Water SA 23 (4) 387–403. SAKO A, O’REILLY CM, HANNIGAN R, BICKFORD N and
JOHNSON RL (2005) Variations in otolith elemental compositions of two clupeid species, Stolothrissa tanganicae and Limnothrissa
miodon in Lake Tanganyika. Geochem. Explor. Environ. Anal. 5
91–97. http://dx.doi.org/10.1144/1467-7873/03-039
SANNAC S, LENER JP and DARROUZER J (2012) Enhancing the productivity of food sample analysis with the Agilent 7700x ICP-MS. Application note, Food testing. Agilent Technologies Inc. Paris, France.
SECOR DH, HENDERSON-ARZAPALO A and PICCOLI PM (1995) Can otolith microchemistry chart patterns of migration and habitat utilization in anadromous fishes? J. Exp. Mar. Biol. Ecol. 195 15–33. http://dx.doi.org/10.1016/0022-0981(95)00054-U
SOUTH AFRICAN BUREAU OF STANDARDS (2010a) SABS Water-Check Group 1, April 2010, Final Report. SABS, Pretoria. 14 pp. SOUTH AFRICAN BUREAU OF STANDARDS (2010b) SABS
Water-Check Group 1, June 2010, Final Report. SABS, Pretoria. 14 pp. SOUTH AFRICAN BUREAU OF STANDARDS (2010c) SABS
Water-Check Group 1, October 2010, Final Report. SABS, Pretoria. 14 pp. TOWNSEND DW, RADTKE RL, CORWIN S and LIBBY DA (1992)
Strontium:calcium ratios in juvenile Atlantic herring Clupea haren-gus otoliths as a function of water temperature. J. Exp. Mar. Biol.
Ecol. 160 131–140. http://dx.doi.org/10.1016/0022-0981(92)90115-Q
WALTHER BD and THORROLD SR (2006) Water not food, contrib-utes the majority of strontium and barium deposited in the otoliths of marine fish. Mar. Ecol. Prog. Ser. 311 125–130. http://dx.doi. org/10.3354/meps311125
WELLS BK, RIEMAN BE, CLAYTON JL, HORAN DL and JONES CM (2003) Relationships between water, otolith, and scale chem-istries of Westslope cutthroat trout from the Coeur d’Alene River, Idaho: The potential application of hard-part chemistry to describe movements in freshwater. Tran. Am. Fish. Soc. 132 409–424. http:// dx.doi.org/10.1577/1548-8659(2003)132<0409:rbwoas>2.0.co;2 WEPENER V and VERMEULEN LA (2005) A note on the
concen-trations and bioavailability of selected metals in sediments of Richards Bay Harbour, South Africa. Water SA 34 (4) 589–595. WEPENER V, VAN DYK C, BERVOETS L, O’BRIEN G, COVACI A
and CLOETE Y (2011) An assessment of the influence of multiple stressors on the Vaal River, South Africa. Phys. Chem. Earth 36
(14–15) 949–962. http://dx.doi.org/10.1016/j.pce.2011.07.075 WHITLEDGE G (2008) Assessment of otolith chemistry as an
TABLE A1
Certified reference material compared to metal concentrations obtained during analysis. Concentrations in µg/kg dry tissue mass. Data not available indicated by na.
Ele
me
nt
DOLT-4 DORM-3
Ce
rt
ifi
ed
A
na
ly
se
d
D
e L
a C
al
le e
t a
l. (
20
12
)
Ce
rt
ifi
ed
A
na
ly
se
d
D
e L
a C
al
le e
t a
l. (
20
12
)
A
yg
un a
nd A
ba
no
z
(2
011
)
Sa
nn
ac e
t a
l. (
20
12
)
Ba na 301 na na 3 788 na na na
Ca 680 000 664 040 516 000 na 2 318 522 1 909 000 na na
Co 250 246 na na 267 na na na
Fe 1 833 000 1 705 838 1 908 000 347 000 326 196 351 000 338 700 368 000
Mg 1 500 000 1 405 539 na na 983 594 na na na
Mo 1 000 991 na na 258 na na na
Na 6 800 000 6 975 287 na na 15 069 208 na na na
Ni 970 312 na 1 280 1 317 na na 1 420
P na 11 249 293 11 126 000 na 7 899 404 5 716 000 na na
Rb na 3 204 na na 5 940 na na na
Sr 5 500 5 116 na na 8 275 na na na
Zn 116 000 123 015 125 000 51 300 52 390 53 700 50 100 47 500