Control of HIV-1 Pathogenesis in Viremic Nonprogressors Is
Independent of Gag-Specific Cytotoxic T Lymphocyte
Responses
Maria Salgado,aAlbert Garcia-Minambres,aJudith Dalmau,aEsther Jiménez-Moyano,aPompeyo Viciana,bBelén Alejos,c Bonaventura Clotet,a,dJulia G. Prado,aJavier Martinez-Picadoa,c,e
airsiCaixa AIDS Research Institute, Badalona, Spain
bHospital Universitario Virgen del Rocio, Seville, Spain
cCentro Nacional de Epidemiología–ISCIII, Madrid, Spain
dUniversity of Vic–Central University of Catalonia (UVic-UCC), Vic, Spain
eCatalan Institution for Research and Advanced Studies (ICREA), Barcelona, Spain
ABSTRACT Viremic nonprogressors (VNPs) constitute a very scarce group of un-treated human immunodeficiency virus type 1 (HIV-1)-infected individuals who
main-tain stable CD4⫹T cell counts despite high levels of HIV-1 replication. The specific
factors associated with this atypical control of the HIV infection have been poorly described. Since specific T cell responses seem to be one of the main causes of HIV-1 control in elite controllers, we studied whether HIV-1 Gag-specific cytotoxic T lymphocyte (CTL) responses could also modulate disease control in VNPs. We char-acterized the immune responses from four VNPs compared to those of five standard progressors (SPs) during the first years of HIV-1 infection. We observed no differ-ences in the breadth and frequency of Gag-specific cellular responses. Furthermore,
we obtained 217 HIV-1Gagclonal sequences in which the viral variability of Gag
in-creased over 3 years of infection for synonymous and nonsynonymous mutations in
both VNPs and SPs. VNPs evolution rates ingagwere comparable to SPs. This
obser-vation is in line with a similar accumulation of CTL putative escape mutations in Gag epitopes targeted by CTL responses. Altogether, the absence of viral pathogenesis in VNP individuals seems to be independent of HIV-Gag-specific CTL responses. This novel information guides to the study of alternative mechanism of HIV-1 pathogene-sis control.
IMPORTANCE Control of HIV infection has been widely studied in elite controllers or long-term nonprogressor models. However, there is a less-known group of
individu-als, termed viremic nonprogressors (VNPs), who maintain stable CD4⫹T cell counts
despite high plasma viremia. The mechanisms involved in this remarkable control of HIV-1 pathogenesis clearly have implications for the development of new drugs and vaccines. We show here for the first time that VNPs have immune responses and HIV-gag evolution similar to those of standard progressors. Remarkably, we demon-strate that the mechanism of pathogenesis control in these individuals differs from some elite controllers that are reported to have improved immune control. This is noteworthy since it opens the door to new, as-yet-unknown mechanisms for HIV control. Our novel results advance the understanding of mechanisms involved in viremic nonprogression and suggest that there are alternative mechanisms to the adaptive immune responses for an effective control of viral pathogenesis.
KEYWORDS CTL response, HIV-1, viremic nonprogressors, progression, viral pathogenesis
Received28 February 2018Accepted21
March 2018
Accepted manuscript posted online28
March 2018
CitationSalgado M, Garcia-Minambres A,
Dalmau J, Jiménez-Moyano E, Viciana P, Alejos B, Clotet B, Prado JG, Martinez-Picado J. 2018. Control of HIV-1 pathogenesis in viremic nonprogressors is independent of Gag-specific cytotoxic T lymphocyte responses. J Virol 92: e00346-18.https://doi.org/10.1128/JVI.00346-18.
EditorGuido Silvestri, Emory University
Copyright© 2018 Salgado et al. This is an
open-access article distributed under the terms of theCreative Commons Attribution 4.0 International license.
Address correspondence to Maria Salgado, [email protected], or Javier Martinez-Picado, [email protected].
crossm
on November 6, 2019 by guest
http://jvi.asm.org/
U
ntreated human immunodeficiency virus (HIV) infection leads to a progressivereduction on CD4⫹T lymphocytes, which finally results in the development of
AIDS-defining symptoms. This severe immunosuppression is typically associated with high levels of viral replication (1, 2). However, the termed HIV-1 viremic nonprogressors
(VNPs) maintain stable CD4⫹ T cell counts despite high plasma viremia (3). This
infrequent phenotype resembles the natural infection of sooty mangabeys and African green monkeys by the simian immunodeficiency virus (SIV) (4). SIV-infected natural host nonhuman primates rarely progress to AIDS and have normal life spans despite displaying high levels of viral replication. Both human VNPs and sooty mangabeys have the common characteristic of presenting low immune activation despite the high viremia (3, 5).
The specific viral and host factors associated with this atypical control of the HIV-1 infection are poorly described. Recent data suggest that VNPs might be infected with virus with impaired fitness (6), although previous studies showed no significant
alter-ations inenv- andnef-associated functions (7, 8). On the other side, limited infection of
Tcm and Tscm CD4⫹T cells in VNPs has been reported (9), suggesting that host factors
rather than specific viral properties may allow VNPs to dodge HIV-1 pathogenesis and chronic immune activation. Research performed in nonhuman primates have sug-gested that SIV-specific cytotoxic T lymphocyte (CTL)-mediated immune responses are not responsible for the lack of disease progression in the SIV natural host (10, 11). However, no further immunological studies have been performed in humans.
An effective HIV-specific CTL response is postulated as one of the main causes of HIV-1 control in elite controllers (12), but there are no studies addressing whether VNPs could avoid the HIV-1 disease progression through alternative CTL-related mechanisms. It is therefore essential to understand whether cellular HIV-specific immune responses play a role in VNPs. This study evaluates whether HIV-specific CTL responses are effective in controlling the viral pathogenesis in VNPs compared to HIV-infected standard progressors (SPs) during 3 years in the absence of combination antiretroviral therapy. Adaptive immune pressure in a highly replicating viral environment might contribute to select viral mutants with impaired viral fitness and consequently reduced viral pathogenesis.
RESULTS
Subjects.Clinical characteristics from the studied individuals are depicted in Table
1. VNPs and SPs presented similar plasma viremia (4.6⫾0.22 log HIV RNA copies/ml
versus 4.4⫾0.23 log HIV RNA copies/ml, respectively). The SP group had significantly
lower CD4⫹T cell levels (VNP [707⫾215 cells/l] versus SP [216⫾308 cells/l]), with
greater cell decay over time (VNP [23⫾60 cells/l/yr] versus SP [117⫾6 cells/l/yr]).
The time from the seroconversion year of the first sample (t0) was similar in both
groups.
CTL responses between VNPs and SPs. HLA class I was genotyped for all the individuals (Table 1). None of the participants carried protective HLA allele B*5701 or B*2701. Rapid progression alleles (B*3503) were also absent in both groups.
In order to characterize HIV-specific CTL responses in the VNP group, we assessed
the production of gamma interferon (IFN-␥) by peripheral blood mononuclear cells
(PBMCs) stimulated with Gag peptides. Longitudinal analysis was only performed in the
VNPs, since PBMC samples were not available for SPs att0. Nonetheless, comparisons
between VNPs and SPs were performed att3.
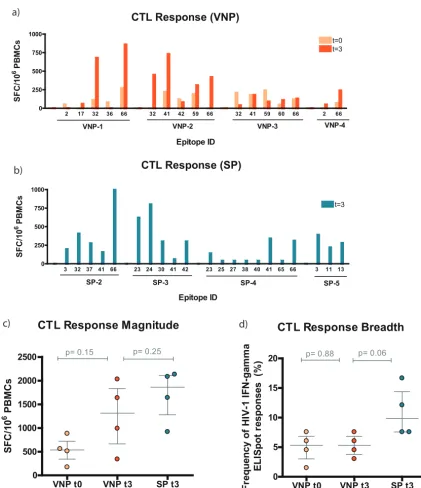
CTL responses per subject are depicted in Fig. 1a and b. Specific epitopes in p24Gag
and p6Gag—32 (MREPRGSDIAGTTSTL), 41 (YVDRFYKTLRAEQASQEV), and 66 (KELYPLAS
LRSLFGNDPSSQ)—were overrepresented in both VNPs and SPs. Those regions seemed to be immunodominant in the early phase of the HIV-1 infection. The magnitudes of the responses slightly increased over time in VNPs, but not their breadths (Fig. 1c and
d). When both groups were compared at t3, similar responses were found, but the
frequency was slightly higher in SPs (Fig. 1c and d). Together, these data suggest that
on November 6, 2019 by guest
http://jvi.asm.org/
TABLE 1 Clinical data a Group Patient ID Age (yr) Gender
Estimated seroconversion date
(yr) Yr sampled ( t0 ) Period (yrs) between t0 and t3 samples CD4 decay (cells/ l/yr) CD4 count (cells/ l) at t3 Mean VL (log copies HIV-RNA/ml) HIV subtype HLA allele(s) VNP VNP-1 33 Male 2007 2008 3.3 ⫺ 74 632 5.0 B A * 0301, A * 3201, B * 4403, B * 4901, Cw * 0701, Cw * 1601 VNP-2 30 Male 2008 2009 3.1 ⫺ 56 999 4.3 B A * 0201, A * 3201, B * 4402, B * 4402, Cw * 0501, Cw * 0501 VNP-3 28 Male 2006 2008 2.7 16 593 4.7 B A * 0201, A * 0201, B * 0702, B * 5101, Cw * 0702, CW * 1502 VNP-4 31 Male 2006 2008 2.6 10 783 4.6 CRF19 A * 2902, A * 6802, B * 4403, B * 5301, Cw * 0401, Cw * 1601 SP SP-1 40 Male 2000 2001 3.1 ⫺ 115 468 4.4 B A * 0201, A * 6802, B * 1402, B * 1801, Cw * 0501, Cw * 0802 SP-2 47 Male 2007 2008 3.2 ⫺ 117 342 4.2 B A * 1101, A * 3001, B * 1302, B * 1501, Cw * 0303, Cw * 0602 SP-3 43 Male 2005 2007 2.6 ⫺ 121 34 4.1 B A * 2402, A * 2601, B * 4405, B * 5101, Cw * 0202, Cw * 1402 SP-4 38 Male 2006 2007 2.1 ⫺ 234 352 5.0 B A * 0301, A * 3002, B * 1801, B * 3503, Cw * 04, Cw * 05 SP-5 44 Male 2007 2008 2.3 ⫺ 110 216 4.5 B A * 0301, A * 2902, B * 4001, B * 4403, Cw * 0304, Cw * 1601 aFor the epidemiological data, the age, estimated seroconversion date, time between samples, CD4 counts at time point t3 , CD4 decays, mean viral load, HIV-1 subtype, and HLAs are detailed for each individual. The VNP and SP groups showed differences in CD4 counts and CD4 decays but not in mean viral loads.
on November 6, 2019 by guest
http://jvi.asm.org/
VNPs and SPs presented similar T cell HIV-specific responses, although the breadth tends to be wider in SPs.
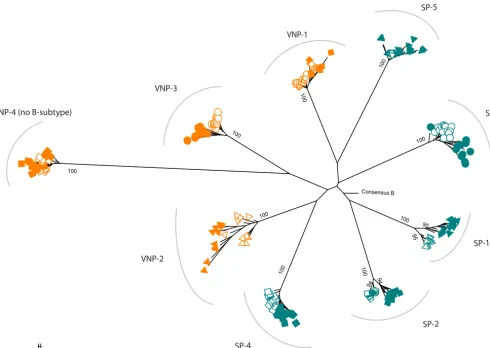
Viral evolution in VNPs and SPs.In order to identify the impact of HIV-specific CTL responses in viral evolution, we analyzed 217 clonal Gag sequences obtained from plasma by limiting dilution. For each individual, we obtained a median of 12 indepen-dent Gag sequences (range, 10 to 14) in two different time points separated by 2.5 to 3 years. In all cases, sequences grouped independently per subject (Fig. 2). Since VNP-4 carried non-B subtype virus, these sequences clustered distantly from the rest. Gag
sequences diverged over time in all subjects, with t0 andt3 clustering separately in
most cases.
a)
d)
c)
b)
CTL Response (VNP)
2 17 32 36 66 32 41 42 59 66 32 41 59 60 66 2 66 0
250 500 750 1000
t=0 t=3
VNP-1 VNP-2 VNP-3 VNP-4
Epitope ID
SF
C
/1
0
6 PB
M
C
s
CTL Response (SP)
3 32 37 41 66 23 24 30 41 42 23 25 27 38 40 41 65 66 3 11 13 0
250 500 750 1000
t=3
SP-2 SP-3 SP-4 SP-5
Epitope ID
SF
C
/1
0
6 PB
M
C
s
CTL Response Magnitude
VNP t0 VNP t3 SP t3 0
500 1000 1500 2000
2500 p= 0.15 p= 0.25
SF
C
/1
0
6 PB
M
C
s
CTL Response Breadth
VNP t0 VNP t3 SP t3 0
5 10 15
20 p= 0.88 p= 0.06
Fr
e
que
nc
y
of
H
IV
-1
I
FN
-ga
m
m
a
E
L
IS
p
o
t r
e
sp
o
n
ses (
%
)
FIG 1Epitope-specific CTL response in VNPs and SPs. (a and b) Map of the specific overlapping epitopes that generated IFN-␥ responses for VNPs and SPs, respectively. Data are presented as spot-forming cells (SFC) per 106PBMCs. Specifically, for VNPs we were able to compare samples fromt0(light orange) with those fromt3(dark orange). (c) Specific CTL response magnitude. The magnitude of the response was the additive response of all the positive wells measured as SFC/106PBMCs. VNP data are represented in light orange (t0) or dark orange (t3). SP data are presented in dark blue (t3). (d) Specific CTL response breadth.
on November 6, 2019 by guest
http://jvi.asm.org/
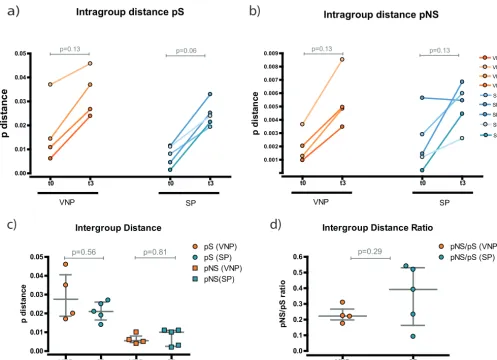
[image:4.594.42.464.68.556.2]Using a p-distance algorithm, we calculated the diversity of the sequences repre-sented in the tree. This parameter measures the proportion of changes in each sequence calculated as synonymous (pS) or nonsynonymous (pNS) (Fig. 3). Consis-tently, we observed a longitudinal increase in genetic diversity over time for both VNPs and SPs (Fig. 3a and b), although statistically significant differences were not reached. This supports that genetic diversity increases over time, as suggested by the phyloge-netic tree.
To compare whether the degree of diversity is different between VNPs and SPs, we measured the global evolution per individual (Fig. 3c). We observed no changes between the two groups in either synonymous or nonsynonymous mutations. Likewise, there were no differences when we analyzed Gag regions p7, p24, or p2 separately (data not shown). Finally, we checked whether there was positive evolution by examining the pNS/pS ratio.
No significant differences were found, and both ratios were⬍1, indicating that there was
not a predominant positive selection in any of the groups (Fig. 3d).
Altogether, these data reflect continuous viral evolution between VNP and SP during the study period despite differences in viral pathogenesis. Therefore, no changes in the rate of evolution were observed between groups.
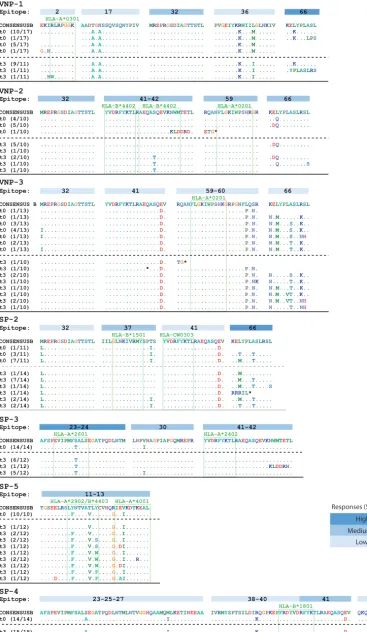
CTL-associated epitope evolution.We further evaluated the appearance of Gag immune mutants as an indirect measure of CTL pressure. For each individual, we checked intraepitope viral evolution during follow-up (Fig. 4). Both groups developed putative escape mutations in gag epitopes during follow-up. The mutations were mainly concentrated in the regions shared with a specific HLA-restricted epitope, but
95
95
100
100 94
94
100 100
100 100
100
100
100
100
0.001
Consensus B
VNP-4 (no B-subtype)
VNP-3
SP-3 SP-5
VNP-1
SP-1
SP-2
SP-4 VNP-2
FIG 2Phylogenetic tree ofgagclonal sequences from VNPs and SPs. VNP sequences are indicated in orange, and SP sequences are indicated in blue. Sequences fromt0are represented as open symbols and fromt3as filled symbols.
on November 6, 2019 by guest
http://jvi.asm.org/
[image:5.594.49.540.72.420.2]also potential compensatory adjacent mutations were observed. Putative escape mu-tation appeared in epitopes that induced low-, medium-, and high-magnitude CTL responses, as shown in Fig. 4.
DISCUSSION
Due to the rarity of the VNP phenotype among HIV-infected individuals, few cohorts with accurate follow-up have been described. In this study, we monitored VNPs and SPs longitudinally in order to understand whether cellular HIV-specific immune responses play a role in controlling viral pathogenesis. We observed no improved immune response in the VNP group, as happens in other HIV-1 nonprogression phenotypes such as elite controllers or long-term nonprogressors (13, 14).
We observed how gag evolution increased over time similarly in VNPs and SPs.
Differences were not observed when we studied nucleotides or amino acid changes. However, when we analyzed the variation in the epitopes with positive responses, we observed that these areas were more variable at the study baseline in VNPs than in SPs. The number of Gag CTL escape mutants has been previously associated with viral replicative capacity (15). Since putative escape mutations happen later at the same level in both groups, it seems that this is not conferring an advantage to the VNPs to sidestep viral pathogenesis. This contrasts with observations in other cohorts with
Intragroup distance pS
t0 t3 t0 t3
0.00 0.01 0.02 0.03 0.04 0.05
VNP SP
p=0.13 p=0.06
p
d
ist
an
ce
Intragroup distance pNS
t0 t3 t0 t3
0.001 0.002 0.003 0.004 0.005 0.006 0.007 0.008 0.009
VNP SP
VNP-1 VNP-2 VNP-3 VNP-4
SP-3 SP-1
SP-5 SP-2
SP-4
p=0.13 p=0.13
p
d
ist
an
ce
Intergroup Distance
VNP SP VNP SP
0.00 0.01 0.02 0.03 0.04 0.05
pS (VNP) pS (SP) pNS (VNP) pNS(SP)
p=0.56 p=0.81
p di
s
ta
nc
e
Intergroup Distance Ratio
VNP SP
0.0 0.1 0.2 0.3 0.4 0.5 0.6
pNS/pS (VNP) pNS/pS (SP)
p=0.29
pN
S
/pS
r
a
ti
o
a)
b)
c)
d)
FIG 3Evolution analysis of the gag sequences. Diversity is measured as the p-distance measuring the proportion of changes in each sequence calculated as nucleotide (synonymous) or amino acid changes (nonsynonymous). (a and b) Intragroup distances. Variability in each subject’s group of sequences was determined at each time point. Each participant is represented by a different shade of orange (VNPs) or blue (SPs). (c) Intergroup distances. Evolution over time was determined for each participant. VNP samples are indicated by orange symbols and SP samples by blue. Synonymous evolution is indicated by circles and nonsynonymous evolution by squares. (d) Intergroup distance ratio. pNS/pS ratios were determined. VNP samples are indicated in orange and SP samples in blue.
on November 6, 2019 by guest
http://jvi.asm.org/
[image:6.594.44.541.71.431.2]VNP-1
Epitope: 2 17 32 36 66
HLA-A*0301
CONSENSUSB EKIRLRPGGK AADTGNSSQVSQNYPIV MREPRGSDIAGTTSTL PVGEIYKRWIILGLNKIV KELYPLASL
t0 (10/17) .......... ...A.A........... ................ .......K...M...... ..K......
t0 (1/17) ...A.A........... ................ .......K...M...... ..K...LPS
t0 (5/17) .......... ...A.A........... ................ .......K...M......
t0 (1/17) G.N....... ...A.A........... ................ .......K...M......
t3 (9/11) .......... ...A.A........... ................ .......K...I...... ..K......
t3 (1/11) .......... ...A.A........... ................ .......K...I...... .YPLASLRS
t3 (1/11) ..NW...... ...A.A........... ................ .......K...I......
VNP-2
Epitope: 32 41-42 59 66
HLA-B*4402 HLA-B*4402 HLA-A*0201
CONSENSUSB MREPRGSDIAGTTSTL YVDRFYKTLRAEQASQEVKNWMTETL RQANFLGKIWPSHKGR KELYPLASLRSL
t0 (4/10) ................ .......................... ................ ..Q.........
t0 (5/10) ................ .......................... ................ .DQ.........
t0 (1/10) ................ ...................KLDDRD. ETG*
t3 (5/10) ................ .......................... ................ .DQ.........
t3 (1/10) ................ .......................... ................
t3 (2/10) ................ ..............T........... ................ .DQ.........
t3 (1/10) ................ ..............T........... ................ ..Q........S t3 (1/10) ................ ..............T........... ................
VNP-3
Epitope: 32 41 59-60 66
HLA-A*0201
CONSENSUS BMREPRGSDIAGTTSTL YVDRFYKTLRAEQASQEV RQANFLGKIWPSHKGRPGNFLQSR KELYPLASLRSL
t0 (1/13) ................ ................D. ....................P.N.
t0 (1/13) ................ ................D. ....................P.N. N.M......K..
t0 (3/13) ................ ................D. ....................P.N. N.M...S..K..
t0 (4/13) I............... ................D. ....................P.N. N.M...S..K..
t0 (1/13) I............... ................D. ....................P.N. N.M...S..NH
t0 (2/13) ................ ................D. ....................P.N. N.M...T..K..
t0 (1/13) I............... ................D. ....................P.N. N.M...T..K..
t3 (1/10) ................ ................D. TG*
t3 (1/10) ................ ............*...D. ....................P.N.
t3 (2/10) ................ ................D. ....................P.N. N.....S..K..
t3 (1/10) ................ ................D. ....................P.NK N.....T..K..
t3 (1/10) ................ ................D. ....................P.N. N.M...T..K..
t3 (1/10) ................ ................D. ....................P.N. N.M..VT..K..
t3 (2/10) ................ ................D. ....................P.N. N.M..VT..NH
t3 (1/10) ................ ................D. ....................P.N. N.....T..NH
SP-2
Epitope: 32 37 41 66
HLA-B*1501 HLA-CW0303
CONSENSUSB MREPRGSDIAGTTSTL IILGLNKIVRMYSPTS YVDRFYKTLRAEQASQEV KELYPLASLRSL
t0 (1/11) L............... ..............I. ................D.
t0 (3/11) L............... ..............I. ................D. ..T...T.....
t0 (7/11) L............... ..............I. ................D. ..M...T.....
t3 (1/14) L............... ................ ................D. ..M.........
t3 (7/14) L............... ................ ................D. ..M...T.....
t3 (1/14) L............... ................ ................D. ..M...T....S
t3 (1/14) L............... ................ ................D. RRRIL*
t3 (2/14) L............... ..............I. ................D. ..M...T.....
t3 (2/14) L............... ..............I. ................D. ..T...T.....
SP-3
Epitope: 23-24 30 41-42
HLA-A*2601 HLA-A*2402
CONSENSUSB AFSPEVIPMFSALSEGATPQDLNTM LHPVHAGPIAPGQMREPR YVDRFYKTLRAEQASQEVKNWMTETL
t0 (14/14) ..........T.............. ...I.............. ..........................
t3 (6/12) ..........T.............. .................. ..........................
t3 (1/12) ..........T.............. .................. ...................KLDDRN.
t3 (5/12) ..........T.............. ...I.............. ..........................
SP-5
Epitope: 11-13
HLA-A*2902/B*4403 HLA-A*4001
CONSENSUSB TGSEELRSLYNTVATLYCVHQRIEVKDTKEAL
t0 (10/10) .........F....V......G..I.......
t3 (1/12) ..............V......G..I.......
t3 (2/12) .........F....V......G..I.......
t3 (2/12) .........F....V.S....G..I.......
t3 (1/12) .........F....V.S....G.DI.......
t3 (1/12) .........F....V.W....G..I.......
t3 (2/12) .........F....V.W....G..I...R...
t3 (1/12) .........F....V.W....G.DI.......
t3 (1/12) .........F....V.F....G..I.......
t3 (1/12) ....D....F....V.F....G.AI.......
SP-4
Epitope: 23-25-27 38-40 65-66 41
HLA-B*1801
CONSENSUSB AFSPEVIPMFSALSEGATPQDLNTMLNTVGGHQAAMQMLKETINEEAA IVRMYSPTSILDIRQGPKEPFRDYVDRFYKTLRAEQASQEV QKQEPIDKELYPLASL
t0 (14/14) .............A.......................I.......... .............K.........................D. ...DQ.......S...
t3 (15/15) .............A.......................I.......... .............K.........................D. ...DQ.......S... IR
N
NN N
LRRRRA MT
D
N G
. . *
. .
. . .
F G . . . . . . .
. . . . . . .
G S Y LR
PE E Y R
.
. . .
SL C
W W W
F
R G
G G G G G G G G G
P T
.
Low (<250) Medium (250-750)
Responses (SCF/106PBMCs)
High (>750)
FIG 4Genetic variation in epitopes with positive responses in each subject. Blue boxes represents the relative intensity IFN-␥ responses in each epitope. VNP-4 responses are not shown since they are outside the sequenced area. The SP-9 immune response was not determined due to the bad cell quality. Open boxes represents HLA-associated epitopes.
on November 6, 2019 by guest
http://jvi.asm.org/
[image:7.594.45.412.75.707.2]nonpathogenic infection as the elite controllers. Previous work performed in elite controllers associated a strong immune response against Gag epitopes with a sustained control of the HIV-1 disease (16) and epitope-dependent evolution. In the present
study, we chose thegaggene because it is the most conserved gene in the entire HIV-1
genome, and the majority of CTL immunodominant responses are directed against Gag. However, additional analyses of HIV-1 Env evolution might provide additional information linked to differential humoral response between groups, as previously described (8).
Major distinguishing features of SIV infection in its natural hosts (African green monkeys and sooty mangabeys) include the absence of disease progression (despite displaying high viremia and high viral replication rates in the intestine), the rapid resolution of virus-induced inflammation, the lack of microbial translocation, rapid control of viral replication in secondary lymphoid organs, and a lack of viral trapping by follicular dendritic cells (FDCs) in follicles (17–24). Recent data demonstrate that, in nonpathogenic SIV infection of African green monkeys, natural killer cells accumulate in an interleukin-15-dependent manner in the follicles of secondary lymphoid organs of the animals and exert efficient control of viral replication within lymph nodes (25). Therefore, the role of NK cells should also be explored in HIV-infected subjects with a VNP phenotype to understand their contribution in limiting viral pathogenesis. How-ever, the extremely scarce number of HIV-infected individuals with this nonprogressive disease profile, along with the current recommendations of rapid antiretroviral therapy initiation in all patients irrespective of the time since HIV-1 transmission (26), may limit the investigation of this hypothesis. In this sense, the conclusions of our study are conditioned to its small sample size. Likewise, the absence of baseline samples for SPs limited our power to reach robust conclusions when global immune responses were measured. However, this limitation was compensated for by performing an extensive study of the immunological marks within the viral genome using a significant number of clonal sequences per individual.
To our knowledge, this is the first report evaluating the immune cytotoxic response in VNP HIV-infected individuals. We here demonstrated that HIV-specific CTL responses are not responsible for the control of HIV-induced pathogenesis in subjects with an absence of CD4 T-cell depletion despite high viral replication. Alternative mechanisms,
including humoral responses or differential infection of T cell CD4⫹subsets, might be
an alternative mechanism of protection against HIV-mediated immune depletion. Further research will unravel whether the VNP phenotype is associated with additional host factors beyond the scope of the present study.
MATERIALS AND METHODS
Subjects.We selected four VNPs and five untreated HIV-infected SPs from the IrsiCaixa VNPs Cohort and the Spanish AIDS Research Network Cohort (CoRIS) (27). VNPs were defined as HIV-infected subjects with viral loads above 10,000 HIV RNA copies/ml that maintained CD4⫹T cells counts above 500 cells/l for more than 5 years with decays of less than 100 cells/l/year. SPs are HIV-infected subjects within the same range of plasma viremia but with a decay in CD4⫹T cells counts greater than 100 cells/l/year, falling below 500 cells/l after 3 years of monitoring. All of the samples were retrospectively obtained from naive individuals within 4 years after infection. The seroconversion date was estimated using last negative HIV test.
HLA typing and assessment of HIV-specific CTL responses.High-resolution HLA class I typing for alleles A, B, and Cw was performed at the Blood and Tissue Bank of Barcelona. Comprehensive HIV-1 epitope screening of optimal responses was carried out using the IFN-␥ELISpot assay, as previously described (28). PBMCs were stimulated with a bulk of 66 clade B consensus overlapping peptides covering the entire Gag protein. Wells were considered positive above the background level, as previously reported (29). The breadth of HIV-specific responses was calculated as follows: (number of positive responses/number of peptides tested)⫻100. The magnitude of response was the additive response of all the positive wells.
Gag amplification and phylogenetic analyses.Plasma samples were collected at two time points per individual separated by 2 to 3 years (t0andt3). Viral RNA was isolated from plasma (Qiagen) and retrotranscribed in cDNA using the 3=-outer primer and SSIII retrotranscriptase (Invitrogen). To prevent resampling, gag was amplified from cDNA using limiting-dilution clonal nested PCR as previously described (30). To ensure single gene amplification, we only sequenced positive PCRs if less of 25% of the reactions were positive. This translated to a minimum of 86% probability of clonality according to Poisson distribution. Additional quality control was done by discarding residual sequences with double peaks in the chromatograms. Onlygagclonal sequences were included in the phylogenetic analysis.
on November 6, 2019 by guest
http://jvi.asm.org/
Sequences were assembled using Sequencher 5.0, and the alignments were manually adjusted in Bioedit. Maximum-likelihood analyses with a Kimura two-parameter phylogenetic reconstruction were per-formed. Nonsynonymous and synonymous p-distances were calculated on the Nei-Gojobori algorithm by comparing grouped sequences fromt0andt3for each subject using MEGA 4.0 software (31).
Statistical analyses.Statistical analysis was performed using a Wilcoxon paired test or a Mann-Whitney test for paired or unpaired data, respectively.
ACKNOWLEDGMENTS
We thank the founders for support of this project. We also thank all the centers and investigators involved in CoRIS.
M.S. was supported by a Sara Borrell grant (CD11/00286). The RIS cohort (CoRIS) is supported by the Instituto de Salud Carlos III through the Red Temática de Investi-gación Cooperativa en Sida (RD06/006 RD12/0017/0018, RD16/0025/0041) as part of
the Plan Nacional R⫹D⫹I and cofinanced by ISCIII-Subdirección General de Evaluación
y el Fondo Europeo de Desarrollo Regional (FEDER). This study was supported by the National Health Institute Carlos III (PI14/01058) and the Gilead Fellowship Program GLD 15/00298. J.G.P. holds a Miguel Servet II contract (CPII15/00014) funded by ISCIII. E.J.-M. is supported by Redes Temáticas de Investigación en SIDA (ISCIII RETIC RD16/0025/ 0041); Acción Estratégica en Salud; Plan Nacional de Investigación Científica, Desarrollo e Innovación Tecnológica 2008-2011; and Instituto de Salud Carlos III, Fondos FEDER. M.S., A.G.-M., and E.J.-M. performed the experiments. J.D., P.V., and B.A. selected and designed the cohorts. M.S., B.C., J.G.P., and J.M.-P. designed the experiments and drafted the paper.
P.V. and B.A. are members of CoRISpe and the HIV HGM BioBank Study Group.
REFERENCES
1. Mellors JW, Muñoz A, Giorgi JV, Margolick JB, Tassoni CJ, Gupta P, Kingsley LA, Todd JA, Saah AJ, Detels R, Phair JP, Rinaldo CR. 1997. Plasma viral load and CD4⫹lymphocytes as prognostic markers of HIV-1 infection. Ann Intern Med 126:946 –954.https://doi.org/10.7326/0003
-4819-126-12-199706150-00003.
2. Rodríguez B, Sethi AK, Cheruvu VK, Mackay W, Bosch RJ, Kitahata M, Boswell SL, Mathews WC, Bangsberg DR, Martin J, Whalen CC, Sieg S, Yadavalli S, Deeks SG, Lederman MM. 2006. Predictive value of plasma HIV RNA level on rate of CD4 T-cell decline in untreated HIV infection. JAMA 296:1498 –1506.https://doi.org/10.1001/jama.296.12.1498. 3. Choudhary SK, Vrisekoop N, Jansen CA, Otto SA, Schuitemaker H,
Mie-dema F, Camerini D. 2007. Low immune activation despite high levels of pathogenic human immunodeficiency virus type 1 results in long-term asymptomatic disease. J Virol 81:8838 – 8842.https://doi.org/10.1128/JVI
.02663-06.
4. Silvestri G. 2008. AIDS pathogenesis: a tale of two monkeys. J Med Primatol 37(Suppl 2):S6 –S12. https://doi.org/10.1111/j.1600-0684
.2008.00328.x.
5. Shaw JM, Hunt PW, Critchfield JW, McConnell DH, Garcia JC, Pollard RB, Somsouk M, Deeks SG, Shacklett BL. 2013. Short communication: HIV⫹ viremic slow progressors maintain low regulatory T cell numbers in rectal mucosa but exhibit high T cell activation. AIDS Res Hum Retrovi-ruses 29:172–177.https://doi.org/10.1089/aid.2012.0268.
6. Weber J, Gibson RM, Sácká L, Strunin D, Hodek J, Weberová J, Pávová M, Alouani DJ, Asaad R, Rodriguez B, Lederman MM, Quiñones-Mateu ME. 2017. Impaired human immunodeficiency virus type 1 replicative fitness in atypical viremic nonprogressor individuals. AIDS Res Ther 14:15.
https://doi.org/10.1186/s12981-017-0144-0.
7. Heigele A, Camerini D, Van’t Wout AB, Kirchhoff F. 2014. Viremic long-term nonprogressive HIV-1 infection is not associated with abnormalities in known Nef functions. Retrovirology 11:13.https://doi.org/10.1186/
1742-4690-11-13.
8. Curriu M, Fausther-Bovendo H, Pernas M, Massanella M, Carrillo J, Ca-brera C, López-Galíndez C, Clotet B, Debré P, Vieillard V, Blanco J. 2012. Viremic HIV-infected individuals with high CD4 T cells and functional envelope proteins show anti-gp41 antibodies with unique specificity and function. PLoS One 7:e30330.https://doi.org/10.1371/journal.pone
.0030330.
9. Klatt NR, Bosinger SE, Peck M, Richert-Spuhler LE, Heigele A, Gile JP, Patel N, Taaffe J, Julg B, Camerini D, Torti C, Martin JN, Deeks SG, Sinclair E,
Hecht FM, Lederman MM, Paiardini M, Kirchhoff F, Brenchley JM, Hunt PW. 2014. Limited HIV infection of central memory and stem cell mem-ory CD4⫹ T cells is associated with lack of progression in viremic individuals. PLoS Pathog 10:e1004345.https://doi.org/10.1371/journal
.ppat.1004345.
10. Barry AP, Silvestri G, Safrit JT, Sumpter B, Kozyr N, McClure HM, Staprans SI, Feinberg MB. 2007. Depletion of CD8⫹ cells in sooty mangabey monkeys naturally infected with simian immunodeficiency virus reveals limited role for immune control of virus replication in a natural host species. J Immunol 178:8002– 8012.https://doi.org/10
.4049/jimmunol.178.12.8002.
11. Dunham R, Pagliardini P, Gordon S, Sumpter B, Engram J, Moanna A, Paiardini M, Mandl JN, Lawson B, Garg S, McClure HM, Xu Y-X, Ibegbu C, Easley K, Katz N, Pandrea I, Apetrei C, Sodora DL, Staprans SI, Feinberg MB, Silvestri G. 2006. The AIDS resistance of naturally SIV-infected sooty mangabeys is independent of cellular immunity to the virus. Blood 108:209 –217.https://doi.org/10.1182/blood-2005-12-4897.
12. Buckheit RW, III, Salgado M, Silciano RF, Blankson JN. 2012. Inhibitory potential of subpopulations of CD8⫹T cells in HIV-1-infected elite suppressors. J Virol 86:13679 –13688. https://doi.org/10.1128/JVI
.02439-12.
13. Betts MR, Nason MC, West SM, De Rosa SC, Migueles SA, Abraham J, Lederman MM, Benito JM, Goepfert PA, Connors M, Roederer M, Koup RA. 2006. HIV nonprogressors preferentially maintain highly functional HIV-specific CD8⫹T cells. Blood 107:4781– 4789.https://doi.org/10.1182/
blood-2005-12-4818.
14. Bailey JR, Brennan TP, O’Connell KA, Siliciano RF, Blankson JN. 2009. Evidence of CD8⫹T-cell-mediated selective pressure on human immu-nodeficiency virus type 1 Nef in HLA-B*57⫹elite suppressors. J Virol 83:88 –97.https://doi.org/10.1128/JVI.01958-08.
15. Adland E, Paioni P, Thobakgale C, Laker L, Mori L, Muenchhoff M, Csala A, Clapson M, Flynn J, Novelli V, Hurst J, Naidoo V, Shapiro R, Gary Huang K-H, Frater J, Prendergast A, Prado JG, Jooste P, R Goulder PJ, Huang KHG, Frater J, Prendergast A, Prado JG, Ndung’u T, Walker BD, Carrington M, Jooste P, Goulder PJR. 2015. Discordant impact of HLA on viral replicative capacity and disease progression in pediatric and adult HIV infection. PLoS Pathog 11:1–26. https://doi.org/10.1371/journal.ppat
.1004954.
16. Miura T, Brockman MA, Schneidewind A, Lobritz M, Pereyra F, Rathod A, Block BL, Brumme ZL, Brumme CJ, Baker B, Rothchild AC, Li B, Trocha A,
on November 6, 2019 by guest
http://jvi.asm.org/
Cutrell E, Frahm N, Brander C, Toth I, Arts EJ, Allen TM, Walker BD. 2009. HLA-B57/B*5801 human immunodeficiency virus type 1 elite controllers select for rare gag variants associated with reduced viral replication capacity and strong cytotoxic T-lymphocyte recognition. J Virol 83: 2743–2755.https://doi.org/10.1128/JVI.02265-08.
17. Beer B, Scherer J, zur Megede J, Norley S, Baier M, Kurth R. 1996. Lack of dichotomy between virus load of peripheral blood and lymph nodes during long-term simian immunodeficiency virus infection of African green monkeys. Virology 219:367–375.https://doi.org/10.1006/viro.1996
.0262.
18. Diop OM, Gueye A, Dias-Tavares M, Kornfeld C, Faye A, Ave P, Huerre M, Corbet S, Barre-Sinoussi F, Müller-Trutwin MC. 2000. High levels of viral replication during primary simian immunodeficiency virus SIVagm infec-tion are rapidly and strongly controlled in African green monkeys. J Virol 74:7538 –7547.https://doi.org/10.1128/JVI.74.16.7538-7547.2000. 19. Goldstein S, Ourmanov I, Brown CR, Beer BE, Elkins WR, Plishka R,
Buckler-white A, Hirsch VM. 2000. Wide range of viral load in healthy African green monkeys naturally infected with simian immunodefi-ciency virus. J Virol 74:11744 –11753.https://doi.org/10.1128/JVI.74
.24.11744-11753.2000.
20. Broussard SR, Staprans SI, White R, Whitehead EM, Feinberg MB, Allan JS. 2001. Simian immunodeficiency virus replicates to high levels in natu-rally infected African green monkeys without inducing immunologic or neurologic disease. J Virol 75:2262–2275.https://doi.org/10.1128/JVI.75
.5.2262-2275.2001.
21. Gueye A, Diop OM, Ploquin MJY, Kornfeld C, Faye A, Cumont M-C, Hurtrel B, Barré-Sinoussi F, Müller-Trutwin MC. 2004. Viral load in tissues during the early and chronic phase of nonpathogenic SIVagm infection. J Med Primatol 33:83–97. https://doi.org/10.1111/j.1600-0684.2004
.00057.x.
22. Cumont M-C, Diop O, Vaslin B, Elbim C, Viollet L, Monceaux V, Lay S, Silvestri G, Le Grand R, Müller-Trutwin M, Hurtrel B, Estaquier J. 2008. Early divergence in lymphoid tissue apoptosis between pathogenic and nonpathogenic simian immunodeficiency virus infections of nonhuman primates. J Virol 82:1175–1184.https://doi.org/10.1128/JVI.00450-07. 23. Brenchley JM, Vinton C, Tabb B, Hao XP, Connick E, Paiardini M, Lifson
JD, Silvestri G, Estes JD. 2012. Differential infection patterns of CD4⫹T cells and lymphoid tissue viral burden distinguish progressive and non-progressive lentiviral infections. Blood 120:4172– 4181.https://doi.org/
10.1182/blood-2012-06-437608.
24. Martinot AJ, Meythaler M, Pozzi L-A, Dalecki Boisvert K, Knight H, Walsh D, Westmoreland S, Anderson DC, Kaur A, O’Neil SP. 2013. Acute SIV infection in sooty mangabey monkeys is characterized by rapid virus clearance from lymph nodes and absence of productive infection in germinal centers. PLoS One 8:e57785.https://doi.org/10.1371/journal
.pone.0057785.
25. Huot N, Jacquelin B, Garcia-Tellez T, Rascle P, Ploquin MJ, Madec Y, Reeves RK, Derreudre-Bosquet N, Müller-Trutwin M. 2017. Natural killer cells migrate into and control simian immunodeficiency virus replication in lymph node follicles in African green monkeys. Nat Med 23: 1277–1286.https://doi.org/10.1038/nm.4421.
26. World Health Organization. 2017. Guidelines for managing advanced HIV disease and rapid initiation of antiretroviral therapy. World Health Organization, Geneva, Switzerland.
27. Sobrino-Vegas P, Gutiérrez F, Berenguer J, Labarga P, García F, Alejos-Ferreras B, Muñoz MA, Moreno S, del Amo J, CoRIS. 2011. La cohorte de la red española de investigación en sida y su biobanco: organización, principales resultados y pérdidas al seguimiento. Enferm Infecc Micro-biol Clin 29:645– 653.https://doi.org/10.1016/j.eimc.2011.06.002. 28. Addo MM, Yu XG, Rathod A, Cohen D, Eldridge RL, Strick D, Johnston
MN, Corcoran C, Wurcel AG, Fitzpatrick CA, Feeney ME, Rodriguez WR, Basgoz N, Draenert R, Stone DR, Brander C, Goulder PJR, Rosenberg ES, Altfeld M, Walker BD. 2003. Comprehensive epitope analysis of human immunodeficiency virus type 1 (HIV-1)-specific T-cell responses directed against the entire expressed HIV-1 genome demonstrate broadly di-rected responses, but no correlation to viral load. J Virol 77:2081–2092.
https://doi.org/10.1128/JVI.77.3.2081-2092.2003.
29. Dalmau J, Rotger M, Erkizia I, Rauch A, Reche P, Pino M, Esteve A, Palou E, Brander C, Paredes R, Phung P, Clotet B, Telenti A, Martinez-Picado J, Prado JG, CoRP Study Group. 2014. Highly pathogenic adapted HIV-1 strains limit host immunity and dictate rapid disease progression. AIDS 28:1261–1272.https://doi.org/10.1097/QAD.0000000000000293. 30. O’Connell KA, Brennan TP, Bailey JR, Ray SC, Siliciano RF, Blankson JN.
2010. Control of HIV-1 in elite suppressors despite ongoing replication and evolution in plasma virus. J Virol 84:7018 –7028.https://doi.org/10
.1128/JVI.00548-10.
31. Tamura K, Dudley J, Nei M, Kumar S. 2007. MEGA4: molecular evolution-ary genetics analysis (MEGA) software version 4.0. Mol Biol Evol 24: 1596 –1599.https://doi.org/10.1093/molbev/msm092.