P R I M A R Y R E S E A R C H A R T I C L E
Predicting the cumulative effect of multiple disturbances on
seagrass connectivity
Alana Grech
1,2|
Emmanuel Hanert
3|
Len McKenzie
4|
Michael Rasheed
4|
Christopher Thomas
5|
Samantha Tol
4|
Mingzhu Wang
2|
Michelle Waycott
6|
Jolan Wolter
3|
Rob Coles
41
ARC Centre of Excellence for Coral Reef Studies, James Cook University, Townsville, QLD, Australia
2
Department of Environmental Sciences, Macquarie University, Sydney, NSW, Australia
3
Earth and Life Institute (ELI), Universite catholique de Louvain, Louvain-la-Neuve, Belgium
4
TropWATER (Centre for Tropical Water & Aquatic Ecosystem Research), James Cook University, Cairns, QLD, Australia
5
Institute of Mechanics, Materials and Civil Engineering, Universite catholique de Louvain, Louvain-la-Neuve, Belgium
6
School of Biological Sciences, Environment Institute, Australian Centre for Evolutionary Biology and Biodiversity, The University of Adelaide, Adelaide, SA, Australia
Correspondence
Alana Grech, ARC Centre of Excellence for Coral Reef Studies, James Cook University, Townsville, QLD, Australia.
Email: [email protected]
Funding information
Macquarie University; James Cook University; Australian Research Council Centre of Excellence for Coral Reef Studies; Ian Potter Foundation; Sea World Research and Rescue Foundation Inc, Grant/Award Number: SWR/6/15; Wallonie-Bruxelles International
Abstract
The rate of exchange, or connectivity, among populations effects their ability to
recover after disturbance events. However, there is limited information on the extent
to which populations are connected or how multiple disturbances affect connectivity,
especially in coastal and marine ecosystems. We used network analysis and the
out-puts of a biophysical model to measure potential functional connectivity and predict
the impact of multiple disturbances on seagrasses in the central Great Barrier Reef
World Heritage Area (GBRWHA), Australia. The seagrass networks were densely
connected, indicating that seagrasses are resilient to the random loss of meadows.
Our analysis identified discrete meadows that are important sources of seagrass
propagules and that serve as stepping stones connecting various different parts of
the network. Several of these meadows were close to urban areas or ports and likely
to be at risk from coastal development. Deep water meadows were highly connected
to coastal meadows and may function as a refuge, but only for non-foundation
spe-cies. We evaluated changes to the structure and functioning of the seagrass
net-works when one or more discrete meadows were removed due to multiple
disturbance events. The scale of disturbance required to disconnect the seagrass
net-works into two or more components was on average
>
245 km, about half the length
of the metapopulation. The densely connected seagrass meadows of the central
GBRWHA are not limited by the supply of propagules; therefore, management
should focus on improving environmental conditions that support natural seagrass
recruitment and recovery processes. Our study provides a new framework for
assessing the impact of global change on the connectivity and persistence of coastal
and marine ecosystems. Without this knowledge, management actions, including
coastal restoration, may prove unnecessary and be unsuccessful.
K E Y W O R D S
connectivity, cumulative effects, graph theory, Great Barrier Reef, networks, seagrass
1
|
I N T R O D U C T I O N
The rate of exchange, or connectivity, among populations affects
population and metapopulation dynamics and genetics (Cowen &
Sponaugle, 2009; McMahon et al., 2014), responses to species
inva-sions and disease transmission, species expansion and the
replenish-ment of populations after disturbance events (Treml, Halpin, Urban,
& Pratson, 2008). For example, well-connected coral reefs receive a
high number of larvae from multiple source reefs and recover more
rapidly from disturbances such as bleaching and storms (Hughes,
Bellwood, Folke, Steneck, & Wilson, 2005; Thomas, Bridge,
Figueir-edo, Deleersnijder, & Hanert, 2015). Identifying and protecting
path-ways of connectivity are critical to effective conservation outcomes
because they support population persistence, ecosystem function
and biological diversity (Steneck et al., 2009). However, connectivity
estimates are rarely incorporated into conservation decision-making
because of a lack of quantitative data on dispersal pathways and the
spatial scale and extent to which populations are connected (Almany
et al., 2009; Magris, Pressey, Weeks, & Ban, 2014). Measuring
dis-persal and connectivity is particularly difficult in marine ecosystems
because of the challenges associated with tracking propagules,
indi-viduals and larvae (D’Aloia et al., 2015) over broad spatial scales and in a dynamic three-dimensional fluid environment (Saunders et al.,
2016).
Studies that empirically measure dispersal and connectivity in
marine ecosystems use techniques such as electronic tagging (Block
et al., 2011), capture–mark–recapture (Lowe & Allendorf, 2010),
lar-val tagging (Almany, Berumen, Thorrold, Planes, & Jones, 2007), and
genetic approaches, such as DNA parentage analysis (e.g. Almany
et al., 2013; Harrison et al., 2012; Planes, Jones, & Thorrold, 2009).
However, empirical measures of connectivity are limited to a few
marine species due to cost and logistical constraints (Abesamis,
Stockwell, Bernardo, Villanoy, & Russ, 2016; Kool, Moilanen, &
Treml, 2013) and relatively small spatial and temporal scales
(Andrello et al., 2013). An alternative approach is the coupling of
species dispersal parameters with hydrodynamic parameters in
bio-physical models (e.g. Abesamis et al., 2016; Cowen, Paris, &
Srini-vasan, 2006; Grech et al., 2016; Thomas et al., 2014; Treml &
Halpin, 2012). Biophysical models predict the movement of
individu-als by tracking particles using numerical models to describe the
motion of waters, and biological parameters to define the attributes
of a species, including larval and propagule duration and mortality,
timing of release and behaviour in the water column. Outputs of
bio-physical models can be used to populate matrices with the number
of“virtual”individuals moving among locations, enabling the explo-ration and analysis of connectivity using techniques such as graph
theory (Treml et al., 2008).
The application of graph (or network) theory to landscape
ecol-ogy and conservation biolecol-ogy is rapidly growing, particularly in
con-nectivity and metapopulation analysis (Urban, Minor, Treml, &
Schick, 2009). Graph theory provides a flexible framework for
visual-ising and charactervisual-ising connectivity at multiple spatial scales by
rep-resenting how habitats and subpopulations are physically or logically
linked (Rayfield, Fortin, & Fall, 2011). In weighted graphs (or
net-works), nodes represent discrete habitat patches or subpopulations,
and edges (or links) between nodes indicate the direction and
rela-tive strength of dispersal and the resultant functional connections.
Graph theory enables the assessment of the emergent properties
and key structural characteristics of large and complex networks
(Kool et al., 2013). For example, measures of centrality (e.g.
betwee-ness, degree and closeness) indicate the role of a node relative to its
neighbours or the entire network (Estrada & Bodin, 2008). These
measures are important for identifying habitats or subpopulations
that exert a high degree of influence over the entire network or
metapopulation. Graph theory also enables the assessment of the
impact of disturbance events on connectivity, a task that is
notori-ously complex and difficult to measure (Gonzalez, Rayfield, & Lindo,
2011). Removing nodes or edges from a graph indicates the
poten-tial of a metapopulation to withstand the loss of discrete habitats or
subpopulations (Cumming, Bodin, Ernstson, & Elmqvist, 2010) and
provides a measure of a metapopulation’s robustness to disturbance events (Saunders et al., 2016; Urban & Keitt, 2001).
Tropical seagrasses are regularly exposed to multiple disturbance
events, both natural (e.g. storms, cyclones and high rainfall) and
human-induced (e.g. coastal development, sediment loads from land
use, dredging and shipping; Grech et al., 2012). It is typical that
studies on seagrass recruitment and recovery following disturbance
events focus on clonal reproduction (e.g. Kendrick et al., 2017).
Sex-ual reproduction is also an essential mechanism for recruitment and
recovery, but its contribution to the persistence and maintenance of
seagrass populations is less understood (Kendrick et al., 2012).
Stud-ies examining both sexual and asexual reproduction have found that
while some seagrass populations rely largely on clonal growth for
population maintenance (Rasheed, 1999, 2004), in the case of large
scale meadow loss (Rasheed, McKenna, Carter, & Coles, 2014), or
for annual or ephemeral populations (Hovey et al., 2015; York et al.,
2015), sexual reproduction is of critical importance. Seagrass fruits
and propagules of most species are capable of dispersing long
dis-tances via the convective forces of ocean waves and currents
(Ken-drick et al., 2017; McMahon et al., 2014). Long distance dispersal
supports meadow connectivity and the natural recolonisation of
sites after disturbance events (Kendrick et al., 2017); however, very
few studies have attempted to quantify seagrass dispersal and
con-nectivity at broad spatial scales (Jahnke et al., 2017; Ruiz-Montoya,
Lowe, & Kendrick, 2015). Tropical seagrasses occur in some of the
world’s most threatened coastal regions (Orth et al., 2006; Waycott et al., 2009), and there is a critical need to assess the role of
con-nectivity in seagrass replenishment and recovery after disturbance
events, the effect of disturbance events on seagrass connectivity
and its implications for the conservation of coastal habitats (York
et al., 2017).
The goal of our study was to assess seagrass connectivity and
quantify the cumulative impact of multiple disturbance events in the
central Great Barrier Reef World Heritage Area (GBRWHA),
Queens-land, Australia. Potential functional connectivity was measured using
the outputs of a biophysical model of seagrass dispersal and
settle-ment and network analysis. Network analysis was used to evaluate
changes to the structure and functioning of the seagrass networks
when one or more discrete meadows were removed due to multiple
disturbance events. We used the outputs of our analysis to evaluate
seagrass meadow connectivity in the central GBRWHA, predict the
impact of disturbance events on connectivity and to identify
strate-gies that support the replenishment and recovery of seagrass
2
|
M A T E R I A L S A N D M E T H O D S
2.1
|
Study area
The GBRWHA covers an area of 348,000 km2 (Figure 1) and was inscribed on the World Heritage List in 1981 for its superlative
natu-ral beauty, ecological diversity and relative intactness. The Austnatu-ralian
Government has international responsibilities under the World
Her-itage Convention to conserve the region, including its seagrass
habi-tats. The~40,000 km2of tropical seagrass habitats of the GBRWHA region are characterised by low nutrient availability and high
diver-sity, disturbance and productivity (Coles et al., 2015; Waycott et al.,
2009) and are spatially and temporally dynamic (ephemeral). The 15
GBRWHA seagrass species are a vital component of the reef
ecosys-tem and provide food for numerous fish, crustacean, sea turtles and
dugong (Unsworth, van Keulen, & Coles, 2014). We assessed
poten-tial functional connectivity among seagrass meadows using the
cen-tral GBRWHA as an example (Figure 1). This area includes
~6,000 km2of seagrass habitats and was chosen because: (1) there
are>30 years of seagrass data and biophysical models available; (2)
there is published evidence of seagrass loss and recovery in the
region (e.g. Rasheed et al., 2014); and (3) the central GBRWHA has
been exposed to a variety of disturbance events, including cyclones
(e.g. Category 5 Yasi, Category 4 Hamish and Category 4 Debbie),
high rainfall events causing turbid flood plumes, urban and industrial
development (e.g. Townsville) and port developments (e.g. Townsville
and Abbot Point; Figure 1).
2.2
|
Seagrass dispersal and connectivity modelling
We created connectivity matrices for seagrass meadows in the
cen-tral GBRWHA using the biophysical model outputs of Grech et al.
(2016). Grech et al. (2016) delineated the spatial extent of seagrass
meadows with a spatial (geographic information system [GIS]) layer
of intertidal, shallow subtidal and deep water seagrass distribution,
derived from McKenzie, Yoshida, Grech, and Coles (2014) and Coles,
(a)
(b)
(c)
F I G U R E 1 (a) Distribution of
foundation (Halodule, Cymodoceaand
Zosteraspecies) and non-foundation
(Halophilaspecies) seagrass meadows in
the central Great Barrier Reef World Heritage Area; (b) the location of the central Great Barrier Reef World Heritage Area study area on the north-east coast of Australia (QLD, Queensland); and, (c) the location of the study area in the Great Barrier Reef World Heritage Area [Colour figure can be viewed at
[image:3.595.214.549.305.732.2]McKenzie, De’ath, Roelofs, and Lee Long (2009) (Figure 1). They modelled the hydrodynamics of the central GBRWHA using the
depth-integrated finite element Second-generation Louvain-la-Neuve
Ice-ocean Model (SLIM; Lambrechts et al., 2008). Biological
parame-ters were incorporated in SLIM to simulate the dispersal and
settle-ment patterns of “virtual” propagules (i.e. plant fragment, fruit or spathe) to and from known sites of seagrass presence. These
param-eters included: (1) simulating the dispersal of “virtual” propagules floating at the surface (affected by wind speed and direction) and
suspended below the surface; (2) a first-order decay function to
sim-ulate the gradual settlement of particles; and (3) 68 simulations ran
for a maximum of 8 weeks during the peak of the flowering period
(from 1 August 2012 to 31 January 2013), capturing variability in
winds, tides and currents.
The total area of seagrass included in the Grech et al. (2016)
anal-ysis was 6,710.2 km2 (intertidal and shallow subtidal
=857.5 km2;
deep=5,852.7 km2), comprised of 100 discrete meadows (intertidal
and subtidal=97; deep=3; Table S1). The size of intertidal and
shallow subtidal seagrass meadows ranged from 0.41 to 157.1 km2 (mean=8.8 km2) and deep water 1,417.3
–2,335.0 km2
(mean=1,950.9 km2; Table S1). To facilitate connectivity analysis, individual seagrass meadows were allocated into one of two
gener-alised species classes based on similar life-history traits (Figure 1;
Kilminster et al., 2015): the structurally more robust, competitively
dominant and persistent tropical seagrass species (generaHalodule,
Cymodoceaand Zostera; n=67), referred to as foundation species,
and the structurally small, ephemeral and transient species of the
genusHalophila(n=33), referred to as non-foundation species.
Grech et al. (2016) utilised a model which spread the particle
release locations evenly across intertidal and shallow subtidal
mead-ows at intervals of~2 km, and an equal number of particles
(repre-senting “virtual” seagrass propagules) were released per location. Release locations were spread evenly across each deep water
mea-dow at intervals of ~10 km. The number of particles released per
unit area was smaller in deep water meadows than in intertidal and
shallow subtidal meadows because deep water seagrasses have
lower biomass and abundance relative to coastal seagrass (Coles
et al., 2007, 2009; Rasheed et al., 2014).
We calculated the cumulative“virtual”propagule settlement from the 68 simulations of Grech et al. (2016) within foundation and
non-foundation meadows in GIS. The outputs were used to populate
weighted and directed connectivity matrices of the number of“ vir-tual”propagules from every seagrass meadowito every other mea-dowj.
2.3
|
Connectivity measures
We used the foundation and non-foundation seagrass connectivity
matrices and network analysis to explore spatial patterns of
connec-tivity, identify potential dispersal pathways and locate critical source
meadows in the central GBRWHA. In our study, networks (referred
to as habitat graphs) are a set of nodes that represent discrete
sea-grass meadows (McKenzie et al., 2014) and edges (or links) between
nodes indicate functional connections. Edges are weighted by the
number of “virtual” propagules from every seagrass meadow i to every other meadowj.
We used the GIS software ArcGIS 10.2 (https://www.arcgis.com)
and the network analysis software Gephi 0.9.2 (https://gephi.org) to
quantify connectivity of the foundation and non-foundation habitat
graphs. At a network scale, we used a range of measures to define
the two habitat graphs (Table 1) and node degree distribution
(prob-ability distributions of node degrees over the entire network) to
assess communicability within the network (Kool et al., 2013; Minor
& Urban, 2008). At an element (node) scale, we used: betweenness
centrality to identify meadows that serve as stepping stones
con-necting various different parts of the habitat graph (Estrada & Bodin,
2008; Treml & Halpin, 2012); outflux (or weighted out-degree) to
identify important source meadows (Magris, Treml, Pressey, &
Weeks, 2015); PageRank to identify important source meadows that
takes into account the full topology of the habitat graph (Allesina &
Pascual, 2009) and local retention to identify the relative amount of
meadow self-replenishment (Treml & Halpin, 2012). We used
modu-larity and the Louvain algorithm (Blondel, Guillaume, Lambiotte, &
Lefebvre, 2008) to detect communities (or clusters) of nodes that
are densely connected to each other and weakly connected to other
nodes in the network (Thomas et al., 2014). A sensitivity analysis
was used to identify a resolution with a modularity value>0.4,
indi-cating that the graph had a prominent community structure.
Large meadows released a higher number of“virtual”propagules in the 68 simulations of Grech et al. (2016) relative to smaller
mead-ows because they had more particle release locations (seeSeagrass
dispersal and connectivity modelling). We assessed the influence of
meadow size on the habitat graphs by comparing outflux with
mea-dow area to identify nodes that contributed a high number of
propagules to the network relative to their size.
We compared the foundation and non-foundation habitat graphs
with a random network to assess their network type. We generated
random networks using the Erdos-R} enyi model in the R package
igraph (Csardi & Nepusz, 2006). The Erd}os-Renyi model uses the
same number of nodes and edges of a real graph to generate a
ran-dom network. The difference between the real and ranran-dom graphs is
that the edges in the random graph are randomly distributed
between nodes. A total of 1,000 random networks were created
using the same number of nodes and edges of the foundation and
non-foundation graphs. We used Wilcoxon’s signed-rank tests to determine whether the network metrics of the random graphs were
significantly different to the network metrics of the foundation and
non-foundation habitat graphs.
2.4
|
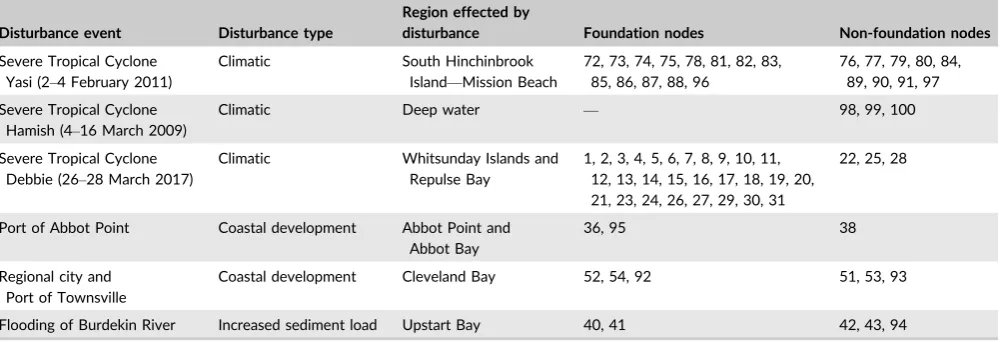
Cumulative impact assessment
We assessed the cumulative effect of multiple impacts on the
connec-tivity of foundation and non-foundation meadows by sequentially
removing nodes (meadows) similar in spatial location to six real-world
events (Table 2; Figure S1): Severe Tropical Cyclone Yasi; Severe
Abbot Point development; the regional city (population~172,000) and
Port of Townsville; and flooding of the Burdekin River. We assumed
that all meadows immediately adjacent to Abbot Point, Townsville
and the Burdekin River were completely destroyed, and all meadows
exposed to the very destructive winds of Cyclone Yasi, Hamish and
Debbie were completely destroyed. We used a Bray–Curtis
dissimilar-ity matrix and three network measures to assess the relative impact
of all possible combinations of disturbance events (n=63) on the
connectivity of foundation and non-foundation habitat graphs:
net-work diameter (or traversibility; maximum number of connections
required to traverse the network; Minor & Urban, 2008; Moore,
Gre-war, & Cumming, 2016); network density (or connectance; measures
how close the network is to complete; Moore et al., 2016); and
aver-age clustering coefficient (averaver-age of the clustering coefficient of
nodes in the network; Minor & Urban, 2008).
We assessed the spatial scale of disturbance required to
discon-nect the habitat graphs into two or more components by
sequen-tially removing nodes (meadows) from the foundation and
non-foundation habitat graphs. The nearest node of every focal
mea-dow (n=100) was removed until the habitat graph was
discon-nected. We then measured the Euclidian distance between the focal
meadow and its furthest cut-node. A cut-node is a single node that
causes a network to be disconnected into two or more components
when it is removed (Urban & Keitt, 2001).
3
|
R E S U L T S
The foundation species habitat graph was comprised of 67 nodes
and 1,406 edges (Figures 2 and S2, Tables 1 and S1) and the
non-foundation graph 33 nodes and 487 edges (Figures 2 and S3,
Tables 1 and S1). Both graphs were densely connected and featured
only one component. Both graphs also exhibited the properties of a
small-world network: highly clustered (Table 1), no hubs (i.e. nodes
with a high number of edges relative to other nodes; Figure S4) and
short average path length and graph diameter relative to network
order (Table 1). In small-world networks, connectivity is resilient to
the random loss of nodes as there are many redundant connections
(Minor & Urban, 2007, 2008).
There was no significant difference in the network diameter,
num-ber of components and average path length between the
non-founda-tion habitat graph and the random network of the same number of
nodes and edges. However, the foundation habitat graph was less
con-nected than what occurs randomly; the network diameter and average
path length were significantly lower (p<.001) in the random network;
however, the number of components was the same (1).
The“virtual”propagules released from high outflux node 40 pri-marily remained within Upstart Bay, resulting in a high level of local
retention (97%; Figures 3 and 4, Table S1). Other meadows of high
(>90%) local retention were also located in Upstart Bay
(non-founda-tion node 94) and near Hinchinbrook Island (founda(non-founda-tion nodes 82,
83, 88 and 96, non-foundation nodes 80 and 84), in Repulse Bay
(foundation node 5) and around the Whitsunday Islands (foundation
nodes 7 and 9; Figures 3 and 4, Table S1). Meadows with high local
retention are more likely to be self-persistent (Burgess et al., 2014),
but are also vulnerable to disturbance events as they are less
con-nected to other meadows in the network and therefore less likely to
be replenished.
We removed local retention from node outflux to provide a
mea-sure of the relative importance of meadows as a source of
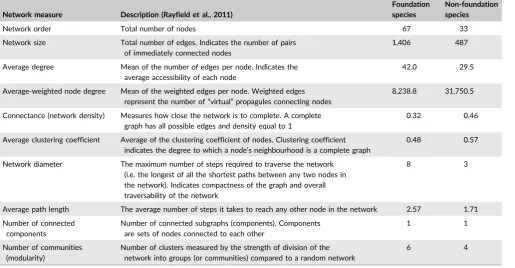
T A B L E 1 Network measures of the foundation and non-foundation habitat graphs
Network measure Description (Rayfield et al., 2011)
Foundation species
Non-foundation species
Network order Total number of nodes 67 33
Network size Total number of edges. Indicates the number of pairs of immediately connected nodes
1,406 487
Average degree Mean of the number of edges per node. Indicates the average accessibility of each node
42.0 29.5
Average-weighted node degree Mean of the weighted edges per node. Weighted edges represent the number of“virtual”propagules connecting nodes
8,238.8 31,750.5
Connectance (network density) Measures how close the network is to complete. A complete graph has all possible edges and density equal to 1
0.32 0.46
Average clustering coefficient Average of the clustering coefficient of nodes. Clustering coefficient indicates the degree to which a node’s neighbourhood is a complete graph
0.48 0.57
Network diameter The maximum number of steps required to traverse the network (i.e. the longest of all the shortest paths between any two nodes in the network). Indicates compactness of the graph and overall traversability of the network
8 3
Average path length The average number of steps it takes to reach any other node in the network 2.57 1.71
Number of connected components
Number of connected subgraphs (components). Components are sets of nodes connected to each other
1 1
Number of communities (modularity)
Number of clusters measured by the strength of division of the network into groups (or communities) compared to a random network
[image:5.595.46.562.67.335.2]propagules (Figure 3, Table S1). Meadows of high outflux minus local
retention were located in Cleveland Bay (foundation nodes 52 and
92, non-foundation node 53), deep water (non-foundation nodes 98,
99 and 100), Abbot Point (foundation nodes 35 and 36,
non-founda-tion node 38) and around the Whitsunday Islands (foundanon-founda-tion nodes
6, 8 and 21; Figures 3 and 4, Table S1). High outflux foundation
nodes 52 and 92 and non-foundation nodes 53 and 99 in Cleveland
Bay and deep water also had high PageRanks values, further
sup-porting their relative importance as source meadows in the region
(Table S1).
We used the measure of outflux minus local retention (Figure 3)
to assess the influence of meadow size on a nodes contribution to
“virtual” propagules. Large foundation meadows exported greater numbers of “virtual” propagules than smaller meadows (Table S1), and there was a positive and significant correlation (r(66)=.86,
p<.001) between meadow area and meadow outflux (Figure S5).
Large non-foundation meadows also exported a high number of“ vir-tual” seagrass propagules, and there was a positive and significant correlation (r(32)=.87, p<.001) between meadow area and
mea-dow outflux (Figure S5). The three large non-foundation deep water
meadows (nodes 98, 99 and 100; Figure 4) had a disproportionately
low outflux relative to their size because the density of particle
release locations was smaller and many “virtual” propagules dis-persed in a north-east direction (Grech et al., 2016). Meadows that
contributed a high number of “virtual” propagules relative to their size were located in Cleveland Bay (foundation nodes 52 and 92,
non-foundation nodes 53), deep water (non-foundation nodes 98, 99
and 100), the Whitsunday Islands (foundation node 21) and Abbot
Point (foundation node 36, non-foundation node 38; Figure 4,
Table S1).
The betweenness centrality measure identified three foundation
meadows and six non-foundation meadows that were critical for
maintaining connectivity (Estrada & Bodin, 2008) by acting as
step-ping stones between various different parts of the network
(Figures 2, S2 and S3, Table S1). Stepping stone nodes of the
foun-dation habitat graph were the large meadows of the Whitsunday
Islands (node 21), Abbot Point (node 95) and Cleveland Bay (node
92; Figure 4). Stepping stone nodes of the non-foundation habitat
graph were the large deep water meadows (nodes 98, 99 and 100)
and meadows located near Hinchinbrook Island (nodes 84 and 97)
and Cleveland Bay (node 53; Figure 4).The size of meadows
influ-enced betweenness centrality because large meadows have a high
outflux of“virtual”propagules and therefore a greater likelihood of encountering other meadows in the 68 dispersal simulations of
Grech et al. (2016).
Modularity identified six foundation and four non-foundation
dis-crete communities (Figures 2, 4, S2 and S3). Connectivity in the
foundation habitat graph follows a south to north pathway: Repulse
Bay (Figure 4e), the Whitsunday Islands (Figure 4e), Edgecumbe
Bay–Upstart Bay (Figure 4d), Cleveland Bay and Bowling Green Bay
(Figure 4c) and Halifax Bay–Hinchinbrook Island (Figure 4b). The
south to north pathway of connectivity is driven by strong
south-easterly winds during the peak of the flowering period (Grech et al.,
2016). The non-foundation habitat graph exhibits a south to north
dispersal pathway along the coast, and also a cross-shelf dispersal
pathway (east to west) due to the influence of the three large deep
water meadows. The boundaries of the three coastal foundation
communities align to the boundaries of the non-foundation
[image:6.595.51.553.78.249.2]commu-nities (i.e. Upstart Bay–Edgecumbe Bay [Figure 4d], Cleveland Bay
[Figure 4c] and Halifax Bay–Hinchinbrook Island [Figure 4b]).
The three large deep water meadows form a non-foundation
community with a small meadow in Mission Beach (node 91) at the
northern boundary of the modelling domain (Figure 4a). Node 91 is
weakly connected to other coastal nodes (degree=7; Table S1),
possibly signalling the northern limit of the central GBRWHA
sea-grass metapopulation. The four nodes of Repulse Bay are also
weakly connected (Figure S2) to the foundation habitat graph
rela-tive to other nodes and communities because it faces south-east
T A B L E 2 Foundation and non-foundation meadows (nodes) that overlapped or were adjacent to six disturbance events (Figure S1) in the
central Great Barrier Reef World Heritage Area
Disturbance event Disturbance type
Region effected by
disturbance Foundation nodes Non-foundation nodes
Severe Tropical Cyclone Yasi (2–4 February 2011)
Climatic South Hinchinbrook Island—Mission Beach
72, 73, 74, 75, 78, 81, 82, 83, 85, 86, 87, 88, 96
76, 77, 79, 80, 84, 89, 90, 91, 97
Severe Tropical Cyclone Hamish (4–16 March 2009)
Climatic Deep water — 98, 99, 100
Severe Tropical Cyclone Debbie (26–28 March 2017)
Climatic Whitsunday Islands and Repulse Bay
1, 2, 3, 4, 5, 6, 7, 8, 9, 10, 11, 12, 13, 14, 15, 16, 17, 18, 19, 20, 21, 23, 24, 26, 27, 29, 30, 31
22, 25, 28
Port of Abbot Point Coastal development Abbot Point and Abbot Bay
36, 95 38
Regional city and Port of Townsville
Coastal development Cleveland Bay 52, 54, 92 51, 53, 93
Flooding of Burdekin River Increased sediment load Upstart Bay 40, 41 42, 43, 94
(the predominant wind direction during the peak of the flowering
period), possibly signalling the Whitsunday Island community as the
southern limit of the central GBRWHA seagrass metapopulation.
The greatest impact to the foundation habitat graph was from the
removal of meadows adjacent to the regional city and Port of
Towns-ville, followed by the Port of Abbot Point, Cyclone Debbie, Cyclone
Yasi and flooding of the Burdekin River (Figure S1 and Table S2).
Cyclone Hamish had no impact on the foundation habitat graph
because it occurred over deep water non-foundation meadows only.
The results of the node removal method and dissimilarity matrix did
not produce a logical ranking of impact by disturbance events for the
non-foundation habitat graph (Table S3), indicating a limitation of the
approach for graphs with a small (<30) network order.
The scale of disturbance events required to disconnect the
habi-tat graphs into two or more components was assessed by identifying
the furthest cut-node from every meadow in the network. The
aver-age distance between every node’s furthest cut-node of the founda-tion habitat graph was 290 km (STD 102.1) and the non-foundafounda-tion
habitat graph 246 km (STD 69.5).
(a)
(b)
F I G U R E 2 Habitat graphs of (a) foundation and (b)
non-foundation seagrass meadows in the central Great Barrier Reef World Heritage Area. Each point represents one node (meadow). The size of the node illustrates its betweenness centrality and the colour illustrates its community (see Figure 4). A high betweenness centrality indicates nodes that are critical for maintaining
connectivity relative to other meadows by acting as stepping stones between various different parts of the network. Meadows in the same community are more strongly connected with each other than with meadows in other communities. The connections (edges) between nodes are shown in grey, with weaker connections filtered out [Colour figure can be viewed at wileyonlinelibrary.com]
(a)
(b)
F I G U R E 3 (a) Local retention rates of foundation (blue) and
non-foundation (green) meadows and (b) outflux (number of“virtual” seagrass propagules released from meadows that settle on
[image:7.595.46.287.52.466.2]4
|
D I S C U S S I O N
This study used network analysis and the outputs of a biophysical
model to address two questions that are integral to the effective
management of coastal habitats: what is the role of connectivity in
seagrass replenishment and recovery after disturbance events, and
what is the cumulative impact of multiple disturbance events on
sea-grass connectivity? In our central GBRWHA study area, we found
that the seagrass habitat graphs became disconnected into two or
more components if the cumulative size of disturbance events was
>245 km. Our analysis also revealed three previously unknown fea-tures of seagrasses in the central GBRWHA: (1) seagrass meadows
between the Whitsunday Islands and Mission Beach (Figure 1) form
a metapopulation within the greater GBRWHA population; (2) deep
water non-foundation meadows may function as a stepping stone
from the south to the north and are highly connected to coastal
meadows; and (3) the central GBRWHA seagrass foundation and
non-foundation metapopulations are densely connected and exhibit
the properties of small-world networks. This study used a theoretical
approach to assess the ecological implications of connectivity, and
therefore did not take into account finer scale biological and
stochastic processes that may influence propagule production and
recruitment in seagrass meadows. We identify locations where
empirical studies could be used to assess the production of
propag-ules to verify the conclusions of our study.
We found that the most northerly and southerly nodes in our
study area were weakly connected to the foundation and
non-foun-dation habitat graphs (Figures 2, S2 and S3), indicating the existence
of a seagrass metapopulation in the central GBRWHA. The most
northern meadow in the study area is weakly connected to other
coastal meadows and the most southern meadows (Repulse Bay) are
south-east facing, limiting their capacity to supply propagules to the
(a)
(b)
(c)
(d)
(e)
F I G U R E 4 Communities of foundation
[image:8.595.49.414.49.525.2]north. The existence of a seagrass metapopulation in the central
GBRWHA has multiple implications for management. For example,
disturbance events that impact seagrass meadows at one location
potentially have implications for seagrass meadows at other
loca-tions within the metapopulation. Maintaining a functional ecosystem,
therefore, necessitates considering impacts on seagrass meadows at
not only the site of a disturbance event but also at the community
(Figure 4) and metapopulation scale in, for example, Environmental
Impact Assessments (EIA) for new coastal developments.
It is possible that seagrass metapopulations are spread along the
GBRWHA coast at similar scales to the central GBRWHA (~500 km).
Most of the “virtual” propagules released by Grech et al. (2016) remained within the study area and previous modelling of deep
water seagrass meadows has suggested the presence of north–south
discontinuities in meadow distribution (Coles et al., 2009). Identifying
seagrass metapopulations beyond the boundary of the central
GBRWHA would require extending the biophysical models to the
entire length of the coast (~2,300 km). Our approach would also be
improved by comparing potential functional connectivity of
sea-grasses with realised connectivity, measured using genetic analyses.
However, genetic diversity-based estimates of connectivity reflect
the combined outcome of what will potentially be multiple
recruit-ment events over the life of the existing meadow. The potential for
dispersal is often predicted to be larger than realised dispersal in
marine ecosystems (Burgess et al., 2014; Jahnke et al., 2017). In our
study, this could translate to an overprediction of connectivity for
meadows that are far apart. However, the longer lived nature of
sea-grass propagules (viable plant fragments, fruit or spathes) relative to
other marine organisms, such as coral larvae (Thomas et al., 2015),
supports our predictions of dense habitat graphs with long
connec-tions. The reasons for discrepancies between estimates of potential
functional connectivity and realised connectivity are postdispersal,
presettlement and postsettlement processes (Jahnke et al., 2017).
More information on these processes would improve the
perfor-mance of connectivity studies that rely on biophysical models to
measure dispersal and settlement.
The deep water non-foundation meadows exhibited high levels
of outflux and betweenness centrality because they are large (total
area>5,800 km2), highly connected to coastal meadows and release
propagules that have the capacity to disperse over long distances.
Grech et al. (2016) recorded particles released from the deep water
meadows dispersing >900 km to the north. Deep water meadows
may function as stepping stones from the south to the north,
enabling the sharing of genotypes over long distances. Deep water
meadows may also function as an off-shore refuge area for
non-foundation seagrasses, assisting in recovery by providing
propagules to coastal meadows after major disturbance events. Deep
water meadows have previously been shown to be more resilient
(higher recovery capacity) than coastal seagrass meadows (Rasheed
et al., 2014), enhancing their value as a seagrass refugia. The refugia
function of deep water meadows is likely to become more important
under climate change because of sea level rise and the predicted
increased frequency and energy of the most intense cyclones
(Knutson et al., 2010). However, deep water meadows only produce
non-foundation species propagules and have limited effect on the
persistence of foundation species. In addition, no evidence or
mech-anism for connectivity from deep water to coastal seagrass
popula-tions of these species has been documented although they are likely
to exist.
The foundation and non-foundation habitat graphs exhibited the
properties of small-world networks and are therefore resilient to the
random loss of nodes because there are many redundant
connec-tions (Minor & Urban, 2007, 2008). Small-world networks are more
robust to perturbations than other network architectures and, in
bio-logical systems, may reflect an evolutionary advantage (Barabasi &
Albert, 1999). However, not all meadows in the habitat graphs were
equally important ecologically or for management. Nine meadows in
Cleveland Bay, Abbot Point, the Whitsundays, Hinchinbrook Island
and deep water had a particularly high outflux and betweenness
centrality (Figures 2 and 3, Table S1). This suggests that these nodes
should be a high priority for protection and conservation as they
perform two important functions: they provide an important source
of propagules in the central GBRWHA and serve as stepping stones
connecting various parts of the metapopulation. Stepping stones
facilitate long-distance dispersal and contribute to species
persis-tence across wide spatial and temporal scales (Saura, Bodin, & Fortin,
2014). The nine meadows also had a high in-degree, meaning that
they are robust to perturbations as many nodes are available to
sup-ply them with propagules if they are affected by a disturbance event
(Table S1). Empirical studies on seagrass ecology are needed to
assess the production and recruitment of propagules and to verify
the actual conservation value of the nine meadows.
The outputs of our cumulative impact assessment provided
fur-ther evidence that seagrasses in the central GBRWHA are robust to
multiple disturbance events. We found that the scale of cumulative
impact required to disconnect the habitat graphs into two or more
components was on average>245 km, around half the length of the
central GBRWHA metapopulation. In context, the very destructive
winds of Severe Tropical Cyclone Yasi, one of the largest cyclones in
Australia’s recent history, covered ~150 km of coastline. We also found that the locations of disturbance events resulted in differing
levels of impact on the foundation habitat graph. Connectivity was
effected by impacts occurring in the centre of the metapopulation,
near the regional city and Port of Townsville (Cleveland Bay) and the
Port of Abbot Point (Figure 1). Foundation meadows in Cleveland
Bay are so important to connectivity that their loss is equal to the
combined loss of seagrass meadows in the Whitsundays, Abbot
Point and Upstart Bay (Figure 1; Table S2). Even though Cyclone
Yasi covered the greatest area, it had minimal impact on connectivity
as it covered a single, highly connected community (Figure 4b) of
relatively low outflux that occurred at the edge of the network
(Fig-ure S2). The same approach to assessing cumulative impact did not
yield a clear result for the non-foundation habitat graph because its
small network order (33) limited the number of nodes that could be
removed before the network measures became unstable (Moilanen,
Large-scale replanting of seagrasses in response to disturbance
events (e.g. Severe Tropical Cyclone Yasi, McKenna et al., 2015) has
previously been canvassed by management authorities in the
GBRWHA. The evidence base for seagrass restoration is limited by
our poor understanding of and ability to provide advice on the
alter-native action: waiting for natural modes of recovery to occur. Our
study informs some of those questions. Supply of propagules for
most meadows will not limit replenishment and recovery after
distur-bance events because meadows in the central GBRWHA are densely
connected. The outputs of Tol et al. (2017) further demonstrate that
the availability of seagrass propagules in the GBRWHA may assist
the natural recovery of seagrass meadows because green turtles and
dugong have the ability to move viable seagrass seeds to new
loca-tions. Observed slow recovery of seagrass meadows, in excess of
2 years (Preen, Lee Long, & Coles, 1995), is likely the result of poor
postdisturbance environmental conditions such as sediment mobility,
changed topography and water quality. Poor environmental health
metrics have previously been shown to reduce the likelihood of
suc-cessful restoration (van Katwijk et al., 2016).
Management approaches to enhance recovery need to include
environmental conditions as well as recruitment. Physically restoring
seagrass plants are unlikely to be successful until the environmental
health of the recipient site has recovered. Once the environment has
recovered, we found that planting seagrasses may be unnecessary in
most meadows in the study area as propagules, in theory, are readily
available and recruitment and recovery could occur naturally. The
exceptions to this would be meadows with high local retention but
not well connected (e.g. Upstart Bay, Figure 1). There may be other
exceptions as the model uses a theoretical production of propagules
applied across meadows of the same type. In reality, the production
of sexual propagules and fragments may vary both temporally and
spatially. Despite these limitations, our approach points to a high
degree of connectivity and replenishment potential, and the recent
recovery of large-scale losses of seagrasses that occurred in sections
of the GBRWHA between 2010 and 2011 would support this
(McKenna et al., 2015; Rasheed et al., 2014).
The tropics are faced with a changing global climate, including
warming sea temperatures (Hughes et al., 2017) and the increased
intensity of tropical storms. The cumulative impact of anthropogenic
activities, such as coastal development and poor watershed
manage-ment, have significantly increased in tropical and coastal regions in
the previous decade (Halpern et al., 2015). Losses of seagrass at
scales>245 km may become frequent. Our study points to the need
to understand complex processes, such as connectivity, in order to
effectively assess postdisturbance replenishment, recruitment and
recovery. Combining the outputs of biophysical models and network
analysis offers a powerful framework for understanding the
connec-tivity in marine and coastal ecosystems and identifying important
sites that support population persistence. Quantifying the impact of
multiple disturbance events on connectivity further informs the
like-lihood of population persistence under global change. Without this
knowledge, management actions, including coastal restoration, may
prove unnecessary and be unsuccessful.
A C K N O W L E D G E M E N T S
Funding for this research was provided by Macquarie University,
James Cook University, Australian Research Council Centre of
Excel-lence for Coral Reef Studies, the Ian Potter Foundation, Sea World
Research and Rescue Foundation Inc (SWR/6/15) and
Wallonie-Bruxelles International. The authors thank G. Cumming (James Cook
University) for advice on the network analysis.
D A T A
Grech, A. (2017). Connectivity of seagrass meadows in the central
Great Barrier Reef. James Cook University. https://doi.org/10.4225/
28/59f7ae655a579
This dataset includes the connectivity matrices of the foundation
and non-foundation species habitat graphs and the edge tables for
net-work analysis.
Grech, A. (2017). Network metrics and spatial distribution of
sea-grass in the central Great Barrier Reef. James Cook University.
https://doi.org/10.4225/28/59fbbefa1337c
Spatial (GIS) layer of the 100 seagrass meadows. Attribute table
contains information on the node scale network metrics.
O R C I D
Alana Grech http://orcid.org/0000-0003-4117-3779
R E F E R E N C E S
Abesamis, R. A., Stockwell, B. L., Bernardo, L. P. C., Villanoy, C. L., & Russ, G. (2016). Predicting reef fish connectivity from biogeographic patterns and larval dispersal modelling to inform the development of marine reserve networks.Ecological Indicators,66, 534–544. https://d oi.org/10.1016/j.ecolind.2016.02.032
Allesina, S., & Pascual, M. (2009). Googling food webs: Can an Eigenvec-tor measure species’ importance for coextinctions? PLoS
Computa-tional Biology, 5, e1000494. https://doi.org/10.1371/journal.pcbi.
1000494
Almany, G. R., Berumen, M. L., Thorrold, S. R., Planes, S., & Jones, G. P. (2007). Local replenishment of coral reef populations in a marine reserve.
Science,316(5825), 742–744. https://doi.org/10.1126/science.1140597
Almany, G. R., Connolly, S. R., Heath, D. D., Hogan, J. D., Jones, G. P., McCook, L. J.,. . .Williamson, D. H. (2009). Connectivity, biodiversity conservation and the design of marine reserve networks for coral reefs.Coral Reefs,28 (2), 339–351. https://doi.org/10.1007/s00338-009-0484-x
Almany, G. R., Hamilton, R. J., Bode, M., Matawai, M., Potuku, T., Saenz-Agudelo, P.,. . .Jones, G. P. (2013). Dispersal of grouper larvae drives local resource sharing in a coral reef fishery. Current Biology, 23(7), 626–630. https://doi.org/10.1016/j.cub.2013.03.006
Andrello, M., Mouillot, D., Beuvier, J., Albouy, C., Thuiller, W., & Manel, S. (2013). Low connectivity between Mediterranean marine protected areas: A biophysical modelling approach for the dusky grouper
Epine-phelus marginatus.PLoS One,8, e68564. https://doi.org/10.1371/jour
nal.pone.0068564
Barabasi, A., & Albert, R. (1999). Emergence of scaling in random net-works.Science,286(5439), 509–512.
movements in a dynamic ocean.Nature,475, 86–90. https://doi.org/ 10.1038/nature10082
Blondel, V. D., Guillaume, J. L., Lambiotte, R., & Lefebvre, E. (2008). Fast unfolding of communities in large networks. Journal of Statistical
Mechanics: Theory and Experiment,2008, P10008. https://doi.org/10.
1088/1742-5468/2008/10/P10008
Burgess, S. C., Nickols, K. J., Griesemer, C. D., Barnett, L. A., Dedrick, A. G., Satterthwaite, E. V.,. . .Botsford, L. W. (2014). Beyond connectiv-ity: How empirical methods can quantify population persistence to improve marine protected area design. Ecological Applications, 24(2), 257–270. https://doi.org/10.1890/13-0710.1
Coles, R. G., McKenzie, L. J., De’ath, G., Roelofs, A., & Lee Long, W. J. (2009). Spatial distribution of deep water seagrass in the inter-reef lagoon of the Great Barrier Reef World Heritage Area. Marine
Ecology Progress Series, 392, 57–68. https://doi.org/10.3354/me
ps08197
Coles, R. G., McKenzie, L. J., Rasheed, M. A., Mellors, J., Taylor, H., Dew,
K.,. . .Grech, A. (2007).Status and Trends of Seagrass Habitats in the
Great Barrier Reef World Heritage Area. Unpublished report to the
Marine and Tropical Sciences Research Facility, Reef and Rainforest Research Centre Limited, Cairns, Australia. Retrieved from http:// www.seagrasswatch.org/Info_centre/Publications/113_QDPI_Coles_e t_al_2007_Status_and_Trends.pdf
Coles, R. G., Rasheed, M. A., McKenzie, L. J., Grech, A., York, P. H., Sheaves, M.,. . .Bryant, C. (2015). The Great Barrier Reef World Her-itage Area seagrasses: Managing this iconic Australian ecosystem resource for the future.Estuarine, Coastal and Shelf Science,153, A1– A12. https://doi.org/10.1016/j.ecss.2014.07.020
Cowen, R. K., Paris, C. B., & Srinivasan, A. (2006). Scaling of connectivity in marine populations. Science, 311(5760), 522–527. https://doi.org/ 10.1126/science.1122039
Cowen, R. K., & Sponaugle, S. (2009). Larval dispersal and marine popula-tion connectivity. Marine Science, 1, 443–466. https://doi.org/10. 1146/annurev.marine.010908.163757
Csardi, G., & Nepusz, T. (2006). The igraph software package for complex network research.International Journal, Complex Systems,1695, 1–9. http://www.necsi.edu/events/iccs6/papers/c1602a3c126ba822d0bc 4293371c.pdf
Cumming, G. S., Bodin, O., Ernstson, H., & Elmqvist, T. (2010). Network analysis in conservation biogeography: Challenges and opportunities.
Diversity and Distributions, 16, 414–425. https://doi.org/10.1111/j.
1472-4642.2010.00651.x
D’Aloia, C. C., Bogdanowicz, S. M., Francis, R. K., Majoris, J. E., Harrison, R. G., & Buston, P. M. (2015). Patterns, causes and consequences of marine larval dispersal. Proceedings of the National Academy of
Sciences of the United States of America, 112(45), 13940–13945.
https://doi.org/10.1073/pnas.1513754112
Estrada, E., & Bodin, O. (2008). Using network centrality measures to manage landscape connectivity. Ecological Applications, 18, 1810– 1825. https://doi.org/10.1890/07-1419.1
Gonzalez, A., Rayfield, B., & Lindo, Z. (2011). The disentangled bank: How loss of habitat fragments and disassembles ecological networks.
American Journal of Botany,98(3), 503–516. https://doi.org/10.3732/
ajb.1000424
Grech, A., Chartrand-Miller, K., Erftemeijer, P., Fonseca, M., McKenzie, L., Rasheed, M.,. . .Coles, R. (2012). A comparison of threats, vulnerabil-ities and management opportunvulnerabil-ities in global seagrass bioregions.
Environmental Research Letters, 7(2), 024006. https://doi.org/10.
1088/1748-9326/7/2/024006
Grech, A., Wolter, J., Coles, R. G., McKenzie, L. J., Rasheed, M., Thomas,
C.,. . .Hanert, E. (2016). Spatial patterns of seagrass meadow
replen-ishment. Diversity and Distributions, 22, 1150–1162. https://doi.org/ 10.1111/ddi.12479
Halpern, B. S., Frazier, M., Potapenko, J., Casey, K. S., Koenig, K., Longo,
C., . . . Walbridge, S. (2015). Spatial and temporal changes in
cumulative human impacts on the world’s ocean.Nature
Communica-tions,6, 7615. https://doi.org/10.1038/ncomms8615
Harrison, H. B., Williamson, D. H., Evans, R. D., Almany, G. R., Thorrold, S. R., Russ, G. R.,. . .Jones, G. P. (2012). Larval export from marine reserves and the recruitment benefit for fish and fisheries. Current
Biology,22(11), 444–446.
Hovey, R. K., Statton, J., Fraser, M. W., Ruiz-Montoya, L., Zavala-Perez, A., Rees, M.,. . .Kendrick, G. A. (2015). Strategy for assessing impacts in ephemeral tropical seagrasses. Marine Pollution Bulletin, 101(2), 594–599. https://doi.org/10.1016/j.marpolbul.2015.10.054
Hughes, T. P., Bellwood, D. R., Folke, C., Steneck, R. S., & Wilson, J. (2005). New paradigms for supporting the resilience of marine ecosystems.Trends in Ecology and Evolution,20, 380–386. https://doi. org/10.1016/j.tree.2005.03.022
Hughes, T. P., Kerry, J. T., Alvarez-Noriega, M., Alvarez-Romero, J. G., Anderson, K. D., Baird, A. H.,. . .Bridge, T. C. (2017). Global warming and recurrent mass bleaching of corals.Nature,543(7645), 373–377. https://doi.org/10.1038/nature21707
Jahnke, M., Casagrandi, R., Melia, P., Schiavina, M., Schultz, S. T., Zane, L., & Procaccini, G. (2017). Potential and realized connectivity of the seagrass Posidonia oceanica and their implication for conservation.
Diversity and Distributions, 23(12), 1423–1434. https://doi.org/10.
1111/ddi.12633
van Katwijk, M. M., Thorhaug, A., Marba, N., Orth, R. J., Duarte, C. M., Kendrick, G. A., . . . Cunha, A. (2016). Global analysis of seagrass restoration: The importance of large-scale planting.Journal of Applied
Ecology,53(2), 567–578. https://doi.org/10.1111/1365-2664.12562
Kendrick, G. A., Orth, R. J., Statton, J., Hovey, R., Ruiz-Montoya, L., Lowe, R. J.,. . .Sinclair, E. A. (2017). Demographic and genetic connectivity: The role and consequences of reproduction, dispersal and recruit-ment in seagrasses. Biological Reviews, 92(2), 921–938. https://doi. org/10.1111/brv.12261
Kendrick, G. A., Waycott, M., Carruthers, T. J., Cambridge, M. L., Hovey, R., Krauss, S. L.,. . .Ooi, J. L. (2012). The central role of dispersal in the maintenance and persistence of seagrass populations.BioScience, 62(1), 56–65. https://doi.org/10.1525/bio.2012.62.1.10
Kilminster, K., McMahon, K., Waycott, M., Kendrick, G. A., Scanes, P., McKen-zie, L.,. . .Glasby, T. (2015). Unravelling complexity in seagrass systems for management: Australia as a microcosm.Science of the Total Environ-ment,534, 97–109. https://doi.org/10.1016/j.scitotenv.2015.04.061 Knutson, T. R., McBride, J. L., Chan, J., Emanuel, K., Holland, G., Landsea,
C.,. . .Sugi, M. (2010). Tropical cyclones and climate change.Nature
Geoscience,3, 157–163. https://doi.org/10.1038/ngeo779
Kool, J., Moilanen, A., & Treml, E. A. (2013). Population connectivity: Recent advances and new perspectives.Landscape Ecology,28, 165– 185. https://doi.org/10.1007/s10980-012-9819-z
Lambrechts, J., Hanert, E., Deleersnijder, E., Bernard, P.-E., Legat, V., Rea-cle, J.-F., & Wolanski, E. (2008). A multi-scale model of the hydrody-namics of the whole Great Barrier Reef.Estuarine, Coastal and Shelf
Science,79, 143–151. https://doi.org/10.1016/j.ecss.2008.03.016
Lowe, W. H., & Allendorf, F. W. (2010). What can genetics tell us about population connectivity? Molecular Ecology, 19(23), 3038–3051. https://doi.org/10.1111/j.1365-294X.2010.04688.x
Magris, R. A., Pressey, R. L., Weeks, R., & Ban, N. C. (2014). Integrating connectivity and climate change into marine conservation planning.
Biological Conservation, 170, 207–221. https://doi.org/10.1016/j.bioc
on.2013.12.032
Magris, R. A., Treml, E. A., Pressey, R. L., & Weeks, R. (2015). Integrating multiple species connectivity and habitat quality into conservation planning for coral reefs.Ecography,38, 1–16.
McKenna, S., Jarvis, J., Sankey, T., Reason, C., Coles, R., & Rasheed, M. (2015). Declines of seagrasses in a tropical harbour, North Queens-land, Australia, are not the result of a single event.Journal of
Bio-sciences,40(2), 389–398.
McKenzie, L. J., Yoshida, R. L., Grech, A., & Coles, R. (2014).Composite of coastal seagrass meadows in Queensland, Australia - November 1984 to June 2010. PANGAEA. Retrieved from https://doi.org/doi.pan gaea.de/10.1594/pangaea.826368
McMahon, K., van Dijk, K., Ruiz-Montoya, L., Kendrick, G. A., Krauss, S. L., Waycott, M.,. . .Duarte, C. (2014). The movement ecology of sea-grasses.Proceedings of the Royal Society B,281, 20140878. https://d oi.org/10.1098/rspb.2014.0878
Minor, E. S., & Urban, D. L. (2007). Graph theory as a proxy for spatially explicit population models in conservation planning.Ecological
Appli-cations,17, 1771–1782. https://doi.org/10.1890/06-1073.1
Minor, E. S., & Urban, D. L. (2008). A graph-theory framework for evalu-ating landscape connectivity and conservation planning.Conservation
Biology, 22(2), 297–307. https://doi.org/10.1111/j.1523-1739.2007.
00871.x
Moilanen, A. (2011). On the limitations of graph-theoretic connectivity in spatial ecology and conservation. Journal of Applied Ecology, 48(6), 1543–1547. https://doi.org/10.1111/j.1365-2664.2011.02062.x Moore, C., Grewar, J., & Cumming, G. (2016). Quantifying network
resili-ence: Comparison before and after a major perturbation shows strengths and limitations of network metrics.Journal of Applied Ecol-ogy,53, 636–645. https://doi.org/10.1111/1365-2664.12486 Orth, R. J., Carruthers, T. J., Dennison, W. C., Duarte, C. M., Fourqurean,
J. W., Heck, K. L.,. . .Short, F. T. (2006). A global crisis for seagrass ecosystems. BioScience, 56(12), 987–996. https://doi.org/10.1641/ 0006-3568(2006)56[987:AGCFSE]2.0.CO;2
Planes, S., Jones, G. P., & Thorrold, S. R. (2009). Larval dispersal connects fish populations in a network of marine protected areas.Proceedings
of the National Academy of Sciences of the United States of America,
106(14), 5693–5697. https://doi.org/10.1073/pnas.0808007106 Preen, A., Lee Long, W. J., & Coles, R. G. (1995). Flood and cyclone
related loss, and partial recovery, of more than 1000 km2of seagrass
in Hervey Bay, Queensland.Australia. Aquatic Botany,52(1–2), 3–17. Rasheed, M. A. (1999). Recovery of experimentally created gaps within a
tropical Zostera capricorni (Aschers.) seagrass meadow, Queensland Australia.Journal of Experimental Marine Biology and Ecology, 235(2), 183–200. https://doi.org/10.1016/S0022-0981(98)00158-0 Rasheed, M. A. (2004). Recovery and succession in a multi-species
tropi-cal seagrass meadow following experimental disturbance: The role of sexual and asexual reproduction.Journal of Experimental Marine
Biol-ogy and EcolBiol-ogy., 310(1), 13–45. https://doi.org/10.1016/j.jembe.
2004.03.022
Rasheed, M. A., McKenna, S. A., Carter, A. B., & Coles, R. G. (2014). Con-trasting recovery of shallow and deep water seagrass communities following climate associated losses in tropical north Queensland, Aus-tralia.Marine Pollution Bulletin,83, 491–499. https://doi.org/10.1016/ j.marpolbul.2014.02.013
Rayfield, B., Fortin, M. J., & Fall, A. (2011). Connectivity for conservation: A framework to classify network measures.Ecology,92(4), 847–858. https://doi.org/10.1890/09-2190.1
Ruiz-Montoya, L., Lowe, R. J., & Kendrick, G. A. (2015). Contemporary connectivity is sustained by wind- and current-driven seed dispersal among seagrass meadows. Movement Ecology, 3, 9. https://doi.org/ 10.1186/s40462-015-0034-9
Saunders, M. I., Brown, C. J., Foley, M. M., Febria, C. M., Albright, R., Mehling, M. G.,. . .Burfeind, D. D. (2016). Human impacts on con-nectivity in marine and freshwater ecosystems assessed using graph theory: A review.Marine and Freshwater Research,67, 277–290. Saura, S., Bodin, O., & Fortin, M. J. (2014). Stepping stones are crucial
for species’ long-distance dispersal and range expansion through habitat networks. Journal of Applied Ecology, 51(1), 171–182. https://doi.org/10.1111/1365-2664.12179
Steneck, R. S., Paris, C. B., Arnold, S. N., Ablan-Lagman, M. C., Alcala, A. C., Butler, M. J.,. . .Sale, P. F. (2009). Thinking and managing outside
the box: Coalescing connectivity networks to build region-wide resili-ence in coral reef ecosystems.Coral Reefs,28(2), 367–378. https://d oi.org/10.1007/s00338-009-0470-3
Thomas, C. J., Bridge, T. C. L., Figueiredo, J., Deleersnijder, E., & Hanert, E. (2015). Connectivity between submerged and near-sea-surface coral reefs: Can submerged reef populations act as refuges? Diversity and
Distributions,21(10), 1254–1266. https://doi.org/10.1111/ddi.12360
Thomas, C. J., Lambrechts, J., Wolanski, E., Traag, V. A., Blondel, V. D., Deleersnijder, E., & Hanert, E. (2014). Numerical modelling and graph theory tools to study ecological connectivity in the Great Barrier Reef.Ecological Modelling,272, 160–174. https://doi.org/10.1016/j.ec olmodel.2013.10.002
Tol, S., Jarvis, J., York, P., Grech, A., Congdon, B., & Coles, R. (2017). Long distance biotic dispersal of tropical seagrass seeds by marine mega-herbivores.Scientific Reports,7, 1–8.
Treml, E. A., & Halpin, P. A. (2012). Marine population connectivity iden-tifies ecological neighbours for conservation planning in the coral tri-angle. Conservation Letters, 5, 441–449. https://doi.org/10.1111/j. 1755-263X.2012.00260.x
Treml, E. A., Halpin, P. A., Urban, D. L., & Pratson, L. (2008). Modeling population connectivity by ocean currents: A graph-theoretic approach for marine conservation. Landscape Ecology, 23, 19–36. https://doi.org/10.1007/s10980-007-9138-y
Unsworth, R. K., van Keulen, M., & Coles, R. G. (2014). Seagrass mead-ows in a globally changing environment.Marine Pollution Bulletin,83 (2), 383–386. https://doi.org/10.1016/j.marpolbul.2014.02.026 Urban, D. L., & Keitt, T. (2001). Landscape connectivity: A
graph-theore-tic perspective. Ecology, 82(5), 1205–1218. https://doi.org/10.1890/ 0012-9658(2001)082[1205:LCAGTP]2.0.CO;2
Urban, D. L., Minor, E. S., Treml, E. A., & Schick, R. S. (2009). Graph mod-els of habitat mosaics. Ecology Letters, 12(3), 260–273. https://doi. org/10.1111/j.1461-0248.2008.01271.x
Waycott, M., Duarte, C. M., Carruthers, T. J., Orth, R. J., Dennison, W. C., Olyarnik, S., . . .Kendrick, G. A. (2009). Accelerating loss of sea-grasses across the globe threatens coastal ecosystems.Proceedings of
the National Academy of Sciences of the United States of America,106
(30), 12377–12381. https://doi.org/10.1073/pnas.0905620106 York, P. H., Carter, A. B., Chartrand, K., Sankey, T., Wells, L., & Rasheed,
M. A. (2015). Dynamics of a deep-water seagrass population on the Great Barrier Reef: Annual occurrence and response to a major dredging program. Scientific Reports, 5, 13167. https://doi.org/10. 1038/srep13167
York, P. H., Smith, T. M., Coles, R. G., McKenna, S. A., Connolly, R. M., Irving, A. D.,. . .Sullivan, B. K. (2017). Identifying knowledge gaps in seagrass research and management: An Australian perspective.
Mar-ine Environmental Research, 127, 163–172. https://doi.org/10.1016/
j.marenvres.2016.06.006
S U P P O R T I N G I N F O R M A T I O N
Additional Supporting Information may be found online in the
supporting information tab for this article.
How to cite this article:Grech A, Hanert E, McKenzie L, et al. Predicting the cumulative effect of multiple
disturbances on seagrass connectivity.Glob Change Biol.
![FIGURE 1(a) Distribution ofthe central Great Barrier Reef WorldHeritage Area; (b) the location of thecentral Great Barrier Reef World HeritageArea study area on the north-east coast ofAustralia (QLD, Queensland); and, (c) thelocation of the study area in the GreatBarrier Reef World Heritage Area [Colourfigure can be viewed atfoundation (Halodule, Cymodocea andZostera species) and non-foundation(Halophila species) seagrass meadows inwileyonlinelibrary.com]](https://thumb-us.123doks.com/thumbv2/123dok_us/144777.21921/3.595.214.549.305.732/distribution-worldheritage-heritagearea-queensland-greatbarrier-colourfigure-atfoundation-inwileyonlinelibrary.webp)

![FIGURE 4Communities of foundationHalifax Bay and Hinchinbrook Islandregion; (c) foundation communitynon-foundation communityBay and foundation communityBowling Green Bay; (d) foundationcommunitycommunityand non-foundation seagrasses in thecentral Great Barrier Reef World HeritageArea: (a) non-foundation deep watercommunity J; (b) foundation community Eand non-foundation community H of the F and I of Cleveland D of C and non-foundation G of the Upstart Bay, AbbotBay and Edgecumbe Bay region; and (e)foundation community A of Repulse Bayand foundation community B of theWhitsunday region [Colour figure can beviewed at wileyonlinelibrary.com]](https://thumb-us.123doks.com/thumbv2/123dok_us/144777.21921/8.595.49.414.49.525/foundationhalifax-islandregion-communitybowling-foundationcommunitycommunityand-heritagearea-watercommunity-thewhitsunday-wileyonlinelibrary.webp)
