This article was downloaded by: [Alfio Parisi] On: 22 August 2015, At: 14:45
Publisher: Taylor & Francis
Informa Ltd Registered in England and Wales Registered Number: 1072954 Registered office: 5 Howick Place, London, SW1P 1WG
Click for updates
Instrumentation Science & Technology
Publication details, including instructions for authors and subscription information:
http://www.tandfonline.com/loi/list20
Characterization of the Corrosion of Iron Using a
Smartphone Camera
D. Igoea & A. V. Parisia a
Faculty of Health, Engineering and Sciences, University of Southern Queensland, Toowoomba, Australia
Accepted author version posted online: 21 Aug 2015.
To cite this article: D. Igoe & A. V. Parisi (2015): Characterization of the Corrosion of Iron Using a Smartphone Camera, Instrumentation Science & Technology, DOI: 10.1080/10739149.2015.1082484
To link to this article: http://dx.doi.org/10.1080/10739149.2015.1082484
Disclaimer: This is a version of an unedited manuscript that has been accepted for publication. As a service
to authors and researchers we are providing this version of the accepted manuscript (AM). Copyediting, typesetting, and review of the resulting proof will be undertaken on this manuscript before final publication of the Version of Record (VoR). During production and pre-press, errors may be discovered which could affect the content, and all legal disclaimers that apply to the journal relate to this version also.
PLEASE SCROLL DOWN FOR ARTICLE
Taylor & Francis makes every effort to ensure the accuracy of all the information (the “Content”) contained in the publications on our platform. However, Taylor & Francis, our agents, and our licensors make no
representations or warranties whatsoever as to the accuracy, completeness, or suitability for any purpose of the Content. Any opinions and views expressed in this publication are the opinions and views of the authors, and are not the views of or endorsed by Taylor & Francis. The accuracy of the Content should not be relied upon and should be independently verified with primary sources of information. Taylor and Francis shall not be liable for any losses, actions, claims, proceedings, demands, costs, expenses, damages, and other liabilities whatsoever or howsoever caused arising directly or indirectly in connection with, in relation to or arising out of the use of the Content.
Characterization of the Corrosion of Iron Using a Smartphone Camera
D. Igoe1, A. V. Parisi1
1
Faculty of Health, Engineering and Sciences, University of Southern Queensland, Toowoomba, Australia
To whom correspondence is to be addressed E-mail: [email protected]
Abstract
Smartphone technology provides bountiful opportunities for greater participation in
scientific and technological research. Digital camera image sensors have been used for
the detection, measurement, and monitoring of corrosion; this work extends that
capability to the smartphone. It has been observed that as the corrosion increased in
clean iron, red responses decreased proportionally. Green and blue responses
quantifiably decreased faster, matching the observed overall reddening as the corrosion
increased. Potential noise sources due to the variable texture of the corroded samples had
a negligible effect on the results. The effectiveness of this method for the characterization
of a smartphone image sensor response to the degree of iron corrosion was reflected in
congruent validation tests and errors less than 5%. These results demonstrate that the
smartphone may be employed as a low cost and efficient means for the evaluation of
surface corrosion.
KEYWORDS: Smartphone, corrosion, image sensor
INTRODUCTION
Smartphone technology is ubiquitous and the inherent processing power,
programmability, and sensor arrays are generally underutilized. There has been
considerable work in the application of smartphone technology for scientific and
technological applications; examples include solar measurements [1], bacteriological
imaging [2], and seismographs [3]. Smartphone use for scientific and technological
investigations provides an opportunity for wider participation in these endeavours [1].
This research extends the use of the smartphone image sensor to determine the
concentration of iron that has corroded.
Corrosion, particularly of iron, is of great mutual concern of those in industry and
construction, home-owners, and those who love their cars. Corrosion is a natural process
that can be accelerated due to the presence of aerosol pollution [4-6]. Corrosion is not only
aesthetically displeasing to look at, it is of major concern to those who rely on the
stability and strength of iron and iron based alloys, such as steel [5-6]. The effects of
corrosion are costly, with an estimated cost to the United States economy in 1999 and
2001 of $276 billion dollars per year, or just over 3% of the gross national product [4].
There is a necessity to monitor the integrity of iron, particularly when exposed to areas of
high pollution, airborne salinity, and humidity. Practicalities demand that any monitoring
and detection of corrosion to be nondestructive [5]. Qi and Gelling [5] summarized the
main sensors used to detect corrosion as being one or a combination of electromagnetic,
electrochemical, optical fluorescent, and optical fiber mechanisms, all based on the
chemical, galvanic, and optical properties. In pipes, fiber optic systems have proven to be
invaluable in detecting corrosion [7-8]. For concrete reinforcement, the use of impedance
capacitive sensors has been found to be effective in alerting people to corrosion that is
not visible [9].
Digital image processing has also been used in the detection and monitoring of surficial
corrosion. Laboratory tests successfully demonstrated that the corrosion processes may
be monitored using digital speckle pattern interferometry [10]. Digital cameras have been
used for the detection of corrosion; particularly; the onset of the process. The color due to
the degree of corrosion was used as a basis of a Support Vector Machine [11]. Perlin Noise
has been used to simulate oxide corrosion textures to provide a means for visual
estimation of the amount of corrosion present in a sample quickly and accurately for
onsite inspections [6].
The image sensor used in a smartphone is based on complementary metal oxide
semiconductor (CMOS) technology [12]. Typically, images are saved in smartphones in
jpeg format, with the intensity of each of the red, green, and blue responses in each pixel
scaled as integers from 0 to 255 [13]. Smartphones are not designed to provide full spectral
data, but the color responses may be calibrated to quantify the magnitude and change in
incident light [1]. However, previous work has found that each smartphone image sensor
has differences in their response, due to various manufacturing methodologies [1], so this
study provides a method to characterize corrosion concentration. Smartphone image
sensors have been shown to have a negligible dark noise response [13].
A key factor when developing corrosion monitoring systems is that any system needs to
be easy to use and require minimal computational processing power to develop a model
for corrosion formation [4, 6]. The development of this method used a smartphone and
freely available image processing tools, as demonstrated in previous work [1-3]. This study
demonstrates the characterization of corrosion using an inexpensive smartphone image
sensor.
METHOD AND MATERIALS
The smartphone used was an LG L3 (LG Electronics, Seoul, South Korea). The
smartphone was Wi-Fi and Bluetooth enabled, allowing images to be sent directly to a
laptop. Image analysis, including developing histograms for grey (Y), red (R), green (G),
and blue (B) responses (scaled to 255) [13] and statistical data (mean and standard error)
of each image were determined using a freeware Java based image processing program
called ImageJ.
Clean square tiles (20 mm x 20 mm) were cut from an iron sheet. Corroded iron square
tiles (20 mm x 20 mm) were prepared by immersing pristine iron samples in saline water.
Other tiles were maintained in a pristine state. All samples were kept clear of other
contaminants, such as dirt and dust.
Each image was taken 1 m directly above an arrangement of 5 x 5 squares, with different
numbers of corroded and uncorroded tiles used firstly in geometric patterns for
calibration and then randomly scattered with different amounts of corroded tiles for
model validation. Each image contained approximately 63,000 pixels. For consistency in
the characterization, the calibration arrangements and the samples for the validation were
illuminated by a D65 daylight lamp placed 2 m above the samples.
The images were sent from the smartphone to a laptop and saved. These images were
individually opened in ImageJ. The average R, G, and B values were obtained by the
following menu commands: Plugins Analyze RGB Measure. The Grey response
(Y), representing the overall reflected light intensity from each sample was calculated by
[13]
0.3 0.59 0.11
Y R G B [1]
where R, G, and B represent the red, green and blue pixel values from the smartphone
image sensor.
Initially for calibration, 5 x 5 arrangements were made of pristine iron tiles and separately
corroded iron tiles. A geometric pattern of corrosion from the center and from the edges
were processed. The tiles were placed on a nonreflective neutral grey card. The
arrangements of the tiles are shown in Figure 1.
The calibration models were validated by further arrangements with a scattered
distribution of corroded iron tiles within the 5 x 5 grid. Ten pictures were taken for each
arrangement and the standard error calculated for each. The grey, red, green, and blue
responses using the calibration equations were compared with the values derived from the
validation images. Further validation was performed using three pieces of corroded iron
found in the surrounding area. These samples were characterized using the same method
as for calibration and validation measurements.
RESULTS
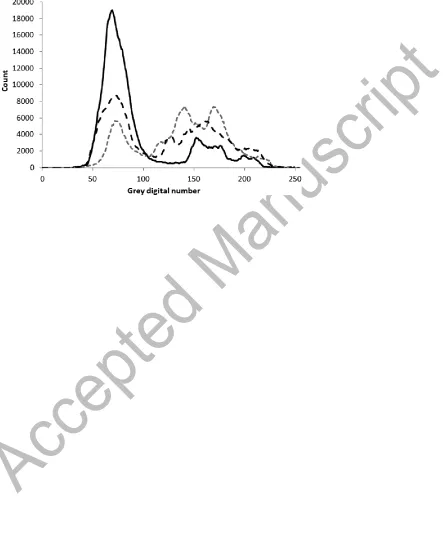
Several distinct and quantifiable patterns emerged from the image analysis. The
histograms revealed that the presence of increasing corrosion caused a peak with a center
digital value of approximately 73 to increase. At the same time, a decreasing and merging
trend was visible in a double peak at digital values of approximately 151 and 170 (Figure
2). Although the position of the lower intensity peak was different, the same trend was
present for all red, green, and blue channels.
CALIBRATION
The grey response had a negative relationship with the percentage corrosion in each
sample, starting from the approximate value for the sample with no corrosion (C0%).
This relationship has a coefficient of determination of 0.99. The relationship between
grey response (Y) to percentage corrosion (C0%) is in equation 2.
0% 1.06 %
Y C C [2]
The red response (R) exhibited a 1:1 decline with increasing corrosion, whereas the
decrease in the green (G) and blue (B) responses were steeper:
0% %
R C C [3]
0% 1.12 %
G C C [4]
0% 1.15 %
B C C [5]
Validation
Smartphone images of scattered corrosion and the corrosion on the three random samples
were used to validate the calibration relationships and demonstrated a coherent match to
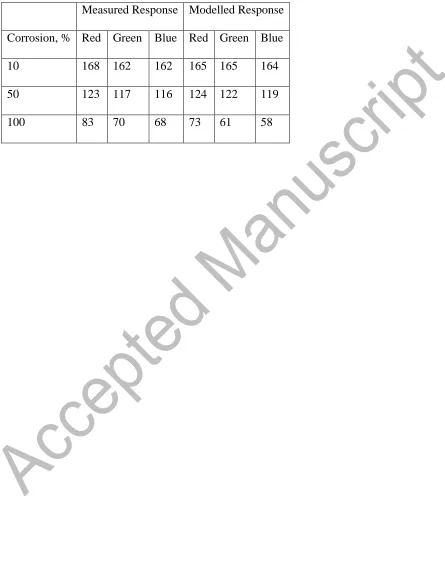
modelled values using equations (1), (2), (3), (4), and (5). A comparison between the
observed Y, R, G, and B values from corroded samples and the equivalent modelled
values from the calibration tests are shown in Table 1.
DISCUSSION
Overall, as the corrosion in each sample increased, the images’ grey and red response
decreases (darkens) at the same rate, and the green and blue responses darken faster, with
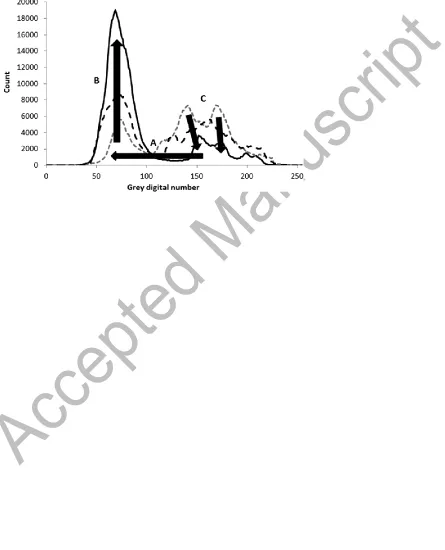
blue darkening the fastest. Figure 3 demonstrates that as the corrosion concentration
increased, the grey value darkened, increasing the count of pixels possessing the same
grey value as the 100 % corroded sample while not expanding the peak width. At the
same time, the higher value bimodal peak collapsed into a smaller single broad peak.
Despite the random variations observed in the texture of the corroded tiles [6], the grey
response with increasing concentration and the position of the peak remained consistent.
This is especially significant as different tiles were used in each trial, demonstrating that
the variability of texture did not result in excess noise in each image. Further, the
positioning of the tiles, from a patterned configuration in the calibration tests to random
placements for validation did not have any significant effect on the grey response trend.
Red, green, and blue responses also decreased, but at different rates. Equations (3), (4),
and (5) represent mathematical models of corrosion growth [4] as detected by a
smartphone camera. On visual inspection, the iron oxide is dark red, implying that there
is a minimal deviation in the red while there is a steeper decrease in the green and blue
responses. The red response darkens at the rate that the percentage of corrosion increases,
demonstrating that the red response is an indicator of the degree of corrosion, provided
that the initial pristine amount is known ( in equation 2). This approach is similar to
the Support Vector Machine method, but using a less complicated, resource consuming
approach [4, 11]. When compared to the red response, the green and blue responses
demonstrate a linear relationship with coefficients of determination of 0.99 for both.
When the green and blue responses are compared to the red, the relationships are very
similar to their response to increasing corrosion as shown by
1.13 21
G R [6]
1.18 29
B R [7]
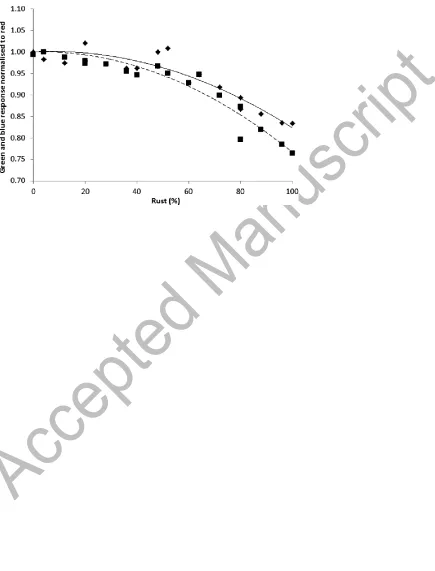
However, when the green and blue channel responses are normalized to red responses (G’
and B’ respectively) and compared to the proportion of corrosion, the relationship is a
broad negative parabola (Figure 4). The coefficients of the parabola are less than 10-4.
These relationships are significantly weaker than their calibrated values, with coefficients
of determination for G’ and B’ of 0.88 and 0.93, respectively:
5 2
% %
2 10 0.0003 1
G C C [8]
5 2
% %
2 10 0.0002 1
B C C [9]
The decrease in Figure 4 is consistent with the green and blue response calibration. The
broad parabolic nature of the relationship is likely to be an artifact of the corrosion
texture, as the divergence from the lines increases with increasing corrosion. The
normalization of the green and blue responses reveal that there was a reduction of up to
18% and 25% in their intensities.
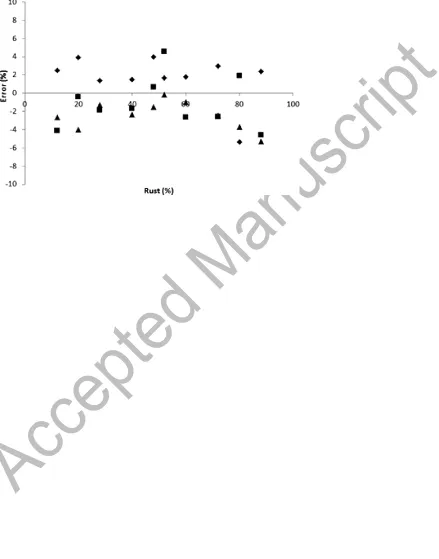
The scattering of the corroded pieces for the validation measurements introduced errors
of 1.7%, 1.1%, and 2.4% with the calibrated models for the red, green and blue
responses, respectively. There were no discernible patterns in errors with increasing
corrosion. However, the red response errors were generally positive while green and blue
errors were generally negative (Figure 5). This suggests that the smartphone image
sensor marginally compensated for the red response at the expense of the green and blue
responses. However, these errors are small and were within 5% of modelled values.
CONCLUSIONS
Varying amounts of red iron corrosion were characterized using a smartphone sensor,
with images analyzed by a simple Java processing program. Models for red, green, and
blue responses to corrosion were quantified. The red response exhibited a very strong
inverse 1:1 relationship with the percentage of corrosion, with the green and blue
responses having a quantifiably steeper regression. These results demonstrate that the
smartphone image sensor quantified the reddening and dimming of the iron with
increasing corrosion. Errors in all three color responses were within 5%, similar to what
was found using the Perlin noise based models [6]. These measurements indicated that
the variable texture of the corroded surface did not cause significant noise in the image
sensor, demonstrating that the smartphone is a low cost and efficient means of evaluating
surface corrosion.
ACKNOWLEDGMENT
We wish to acknowledge the Faculty of Health, Engineering and Sciences workshop for
the preparation of the iron and corroded materials used in this study.
REFERENCES
1. Igoe, D.; Parisi, A; Carter, B., Evaluating UVA aerosol optical depth using a
smartphone camera, Photochem. Photobiol., 2013, 89 (5), 1244-1248.
2. Breslauer, D.; Maamari, R.; Switz, N.; Lam, W.; Fletcher, D., Mobile phone based
clinical microscopy for global health applications, PLoS ONE, 2009, 4 (7), 1-6.
3. Feng, M.; Fukuda, Y.; Mizuta, M.; Ozer, E. Citizen Sensors for SHM: Use of
accelerometer data from smartphones, Sensors, 2015, 15 (2), 2980-2998.
4. Choudhary, P.; Anand, R. Determination of rate of degradation of iron plates due to
rust due to rust using image processing, Int. J. Eng. Res. 2015, 4 (2) 76-84
5. Qi, X.; Gelling, V. A review of different sensors applied to corrosion detection and
monitoring, Rec. Patents in Corr. Sci.2011, 1 (1), 1-7.
6. Acosta, M.; Diaz, J.; Castro, N. An innovative image-processing model for rust
detection using Perlin Noise to simulate oxide textures, Corr. Sci. 2014, 88, 141-151.
7. Rajeev, P.; Kodikara, J.; Chiu, W.; Kuen, T. Distributed optical fibre sensors and their
application in pipeline monitoring Key Eng. Mat. 2013, 558, 424-434.
8. Lee, J.; Yun, C.; Yoon, D. A structural corrosion monitoring sensor based on a pair of
prestrained fiber Bragg gratings, Meas. Sci. Tech. 2010, 21, 017002.
9. Rahman, S.; Ismail, M.; Noor, N.; Bakhtiav, H. Embedded capacitor sensor for
monitoring corrosion of reinforcement in concrete, J. Eng. Sci. Tech. 2012, 7 (2),
209-218.
10. Andres-Arroyo, A.; Andres, N.; Palero, V.; Arroyo, M.; Angurel, L. Possibilities and
limitations of digital speckle pattern interferometry in the analysis of corrosion processes
in metallic materials, Meas. Sci. Tech. 2013,24, 075204.
11. Sharma, V.; Thind, T. Techniques for detection of rusting of metals using image
processing: A survey, Int. J. Emerg. Sci. Eng, 2013, 1 (4), 60-62.
12. Hayes, T. Next-generation cell phone camera, Opt. Phot. 2012, 23, 17-21.
13. Igoe, D.; Parisi, A.V.; Carter, B. A method for determining the dark response for
scientific imaging with smartphones, Inst. Sci. Tech. 2014, 42 (5), 586-592.
14. Jost, T.; Ouerhani, N.; von Wartbug, R.; Muri, R.; Hugli, H. Assessing the
contribution of color in visual attention, Comp. Vis. Im. Und. 2005, 100 (1-2), 107-123.
Table 1 Comparison of red, green and blue responses to corroded materials with
calibration equations.
Measured Response Modelled Response
Corrosion, % Red Green Blue Red Green Blue
10 168 162 162 165 165 164
50 123 117 116 124 122 119
100 83 70 68 73 61 58
Figure 1. Arrangement of pristine and corroded iron tiles. Corroded tiles are shaded.
Figure 2. Combined histogram for the grey response of 20% (grey dashed line), 48%
(black dashed line) and 80% (black line) corrosion.
Figure 3. Relative darkening of the grey response with increasing corrosion. As corrosion
increased, the grey response decreases to the lower peak (A), resulting in a consistent
increase without widening (B), and causes a subsequent decrease of the upper values (C).
Figure 4. Green (diamonds and full line) and blue (squares and dashed line) responses
normalized to red response plotted against the degree of corrosion.
Figure 5. Error between the measured and modelled red (diamonds), green (squares), and
blue (triangles) responses with respect to the percentage of corrosion.