Quantitation of Productively Infected Monocytes and Macrophages of
Simian Immunodeficiency Virus-Infected Macaques
Claudia R. Avalos,aSarah L. Price,aEllen R. Forsyth,aJulia N. Pin,aErin N. Shirk,aBrandon T. Bullock,aSuzanne E. Queen,aMing Li,a Dane Gellerup,dShelby L. O’Connor,dM. Christine Zink,a,bJoseph L. Mankowski,a,b,cLucio Gama,aJanice E. Clementsa,b,c
Department of Molecular and Comparative Pathobiology, Johns Hopkins University School of Medicine, Baltimore, Maryland, USAa
; Department of Pathology, Johns Hopkins University School of Medicine, Baltimore, Maryland, USAb
; Department of Neurology, Johns Hopkins University School of Medicine, Baltimore, Maryland, USAc ; Department of Pathology and Laboratory Medicine, University of Wisconsin School of Medicine, Madison, Wisconsin, USAd
ABSTRACT
Despite the success of combined antiretroviral therapy (ART), human immunodeficiency virus (HIV) infection remains a
life-long infection because of latent viral reservoirs in infected patients. The contribution of CD4
ⴙT cells to infection and disease
progression has been extensively studied. However, during early HIV infection, macrophages in brain and other tissues are
in-fected and contribute to tissue-specific diseases, such as encephalitis and dementia in brain and pneumonia in lung. The extent
of infection of monocytes and macrophages has not been rigorously assessed with assays comparable to those used to study
in-fection of CD4
ⴙT cells and to evaluate the number of CD4
ⴙT cells that harbor infectious viral genomes. To assess the
contribu-tion of productively infected monocytes and macrophages to HIV- and simian immunodeficiency virus (SIV)-infected cells
in
vivo
, we developed a quantitative virus outgrowth assay (QVOA) based on similar assays used to quantitate CD4
ⴙT cell latent
reservoirs in HIV- and SIV-infected individuals in whom the infection is suppressed by ART. Myeloid cells expressing CD11b
were serially diluted and cocultured with susceptible cells to amplify virus. T cell receptor

RNA was measured as a control to
assess the potential contribution of CD4
ⴙT cells in the assay. Virus production in the supernatant was quantitated by
quantita-tive reverse transcription-PCR. Producquantita-tively infected myeloid cells were detected in blood, bronchoalveolar lavage fluid, lungs,
spleen, and brain, demonstrating that these cells persist throughout SIV infection and have the potential to contribute to the
viral reservoir during ART.
IMPORTANCE
Infection of CD4
ⴙT cells and their role as latent reservoirs have been rigorously assessed; however, the frequency of
produc-tively infected monocytes and macrophages
in vivo
has not been similarly studied. Myeloid cells, unlike lymphocytes, are
resis-tant to the cytopathic effects of HIV. Moreover, tissue-resident macrophages have the ability to self-renew and persist in the
body for months to years. Thus, tissue macrophages, once infected, have the characteristics of a potentially stable viral reservoir.
A better understanding of the number of productively infected macrophages is crucial to further evaluate the role of infected
myeloid cells as a potential viral reservoir. In the study described here we compared the frequency of productively infected CD4
ⴙT cells and macrophages in an SIV-infected macaque model. We developed a critical assay that will allow us to quantitate
my-eloid cells containing viral genomes that lead to productive infection in SIV-infected macaques and assess the role of
macro-phages as potential reservoirs.
L
entiviruses infect myeloid lineage cells in tissues, and these
cells are responsible for the multiorgan disease characteristic
of infection with this family of retroviruses (
1–3
). Human
immu-nodeficiency virus (HIV) was the first primate lentivirus identified
that infects CD4
⫹T cells as well as myeloid cells in the blood and
tissues of infected individuals (
4–6
). HIV infects myeloid cells in
lymph nodes, spleen, heart, lungs, the peripheral nervous system,
and the central nervous system (CNS) (
7–11
). The HIV genome
encodes genes that specifically interact and/or interfere with
re-striction factors present in myeloid cells, providing evolutionary
evidence that HIV replication in myeloid cells is important for
virus replication and pathogenesis
in vivo
(
12
).
Myeloid cells were thought to be terminally differentiated cells
with a limited life span. However, recent studies have
demon-strated that resident tissue macrophages are capable of
self-re-newal and that monocytes from blood differentiate into distinct
macrophage phenotypes after entering tissues (
13
,
14
). Moreover,
tissue-resident macrophages, such as alveolar macrophages,
splenic red pulp macrophages, and microglia, are derived from
embryonic yolk sac progenitor cells that self-renew with little to
no contribution from circulating monocytes during homeostasis
(
15–18
). Furthermore, HIV- and simian immunodeficiency virus
(SIV)-infected macrophages are not efficiently killed by CD8
⫹T
cells like infected CD4
⫹T cells are (
19
,
20
). Thus, resident tissue
macrophages remain in tissues long term, are relatively resistant to
Received15 February 2016 Accepted25 March 2016
Accepted manuscript posted online30 March 2016
CitationAvalos CR, Price SL, Forsyth ER, Pin JN, Shirk EN, Bullock BT, Queen SE, Li M, Gellerup D, O’Connor SL, Zink MC, Mankowski JL, Gama L, Clements JE. 2016. Quantitation of productively infected monocytes and macrophages of simian immunodeficiency virus-infected macaques. J Virol 90:5643–5656. doi:10.1128/JVI.00290-16.
Editor:G. Silvestri, Emory University School of Medicine
Address correspondence to Janice E. Clements, jclements@jhmi.edu.
Copyright © 2016 Avalos et al. This is an open-access article distributed under the terms of theCreative Commons Attribution 4.0 International license.
on November 7, 2019 by guest
http://jvi.asm.org/
the cytopathic effects of HIV infection compared to CD4
⫹T cells,
and may serve as stable viral reservoirs.
SIV-infected macaques have been used to study the
pathogen-esis of SIV
in vivo
and have been used as models of HIV infection
in humans. Like HIV, SIV infects both CD4
⫹T cells and
macro-phages in blood, tissues, and brain (
21–25
). Our laboratories
de-veloped and characterized a consistent, accelerated SIV-infected
macaque model resulting in AIDS and CNS disease (in
⬃
80% of
macaques) in 3 months, which is shorter than the course of disease
pathogenesis and frequency of CNS disease in other models of SIV
infection (
21
). Another model used to study CNS infection used
depletion of CD8
⫹T cells in SIV-infected macaques, which
re-sulted in the increased accumulation of infected macrophages in
the CNS and a heightened severity of neurological disease,
sug-gesting that infection of macrophages plays a key role in CNS
disease (
26
).
The frequency of HIV or SIV infection of macrophages in
tis-sues has previously been examined in a number of studies (
27
,
28
).
Infection is quantified by measuring the amount of viral DNA in
cells isolated from tissues; however, this approach overestimates
the number of productively infected CD4
⫹T cells due to the
pres-ence of a large proportion of defective proviruses
in vivo
(
29
,
30
).
A more rigorous approach to the quantification of cells that
har-bor replication-competent virus is the quantitative viral
out-growth assay (QVOA), which quantitates the number of
HIV-infected resting CD4
⫹T cells that produce infectious virus (
31–
33
). This assay has been used to quantify the number of resting
CD4
⫹lymphocytes
in vivo
in HIV-infected individuals on
antiret-roviral therapy (ART) that harbor replication-competent viral
ge-nomes and serves as one of the major assays for studying viral
latency in that cell type (
29
,
31
).
Using a QVOA that our laboratories developed for
SIV-in-fected nonhuman primate CD4
⫹T cells, we previously
demon-strated that the number of infected resting CD4
⫹T cells in the
blood and tissues of macaques in which SIV infection was
sup-pressed by ART was equivalent to the number of infected resting
CD4
⫹T cells in HIV-infected humans on ART (
31–35
). In this
study, we developed a novel macrophage QVOA (M-QVOA) to
assess the frequency of productively SIV-infected monocytes (in
blood) and macrophages (in tissues) using a well-characterized
SIV-infected macaque model (
36–38
). To determine the potential
contribution of CD4
⫹T cells to the quantitation of macrophages,
we also assessed the number of CD3
⫹T cells in each assay by
measuring the amount of T cell receptor

(TCR) RNA.
Using the myeloid M
-QVOA, we show that during chronic
SIV infection, productively infected monocytes or macrophages
are present in blood, bronchoalveolar lavage (BAL) fluid, lungs,
spleen, and brain. This assay can also be used to quantify myeloid
cells productively infected with HIV and SIV that may contribute
to viral persistence and latency in ART-treated humans and
ma-caques.
MATERIALS AND METHODS
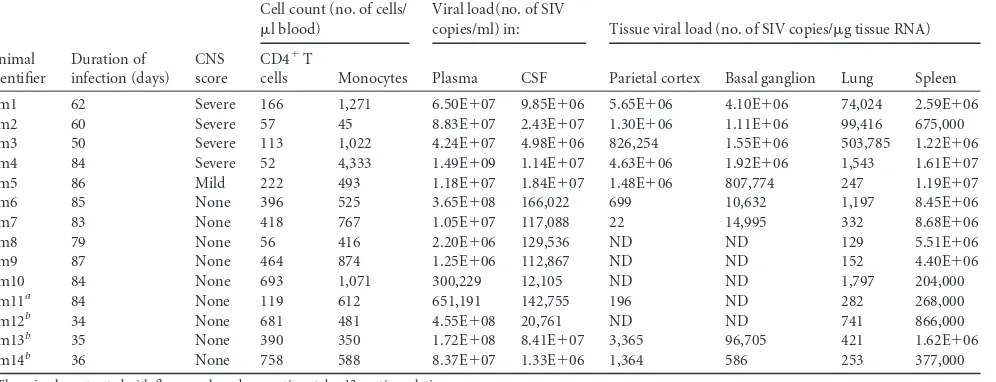
[image:2.585.46.544.79.270.2]Animal studies. Fourteen juvenile pigtailed macaques (Pms;Macaca nemestrina) were inoculated intravenously with the SIV/DeltaB670 swarm and the macrophage-tropic clone SIV/17E-Fr as previously de-scribed (36,38,39). One macaque (Pm11) was treated at 12 days postin-oculation (dpi) with 12.5 mg fluconazole and 5 mg paroxetine once per day orally and euthanized at⬃80 dpi as previously described (40). Three macaques (Pm12, Pm13, and Pm14) were treated at 28 days prior to virus inoculation with 2 mg minocycline/kg of body weight twice per day orally and were euthanized during asymptomatic infection (⬃35 dpi). These macaques were added to the study to investigate macrophage infection at different times after infection. These treatments did not affect either the plasma viral load or disease progression (40). Eleven macaques were eu-thanized during late-stage infection (50 to 87 dpi), and three macaques were euthanized during chronic infection (34 to 36 dpi) (Table 1). Blood and cerebrospinal fluid (CSF) samples were collected longitudinally postinfection. When macaques were euthanized, they were perfused with sterile saline to remove blood and circulating virus as described elsewhere (35). Viral loads in plasma and CSF, CD4⫹T cell counts in blood, and viral RNA levels in tissues were determined for all macaques in the study (Table 1). To assess the extent of CNS inflammation and pathology, brain tissue was evaluated as previously described and the degree of inflamma-tion was scored on a scale ranging from none to severe (38). These studies were performed in accordance with federal guidelines and institutional
TABLE 1Detailed characterization of the SIV-infected macaques used in the studyc
Animal identifier
Duration of infection (days)
CNS score
Cell count (no. of cells/ l blood)
Viral load(no. of SIV
copies/ml) in: Tissue viral load (no. of SIV copies/g tissue RNA)
CD4⫹T
cells Monocytes Plasma CSF Parietal cortex Basal ganglion Lung Spleen
Pm1 62 Severe 166 1,271 6.50E⫹07 9.85E⫹06 5.65E⫹06 4.10E⫹06 74,024 2.59E⫹06 Pm2 60 Severe 57 45 8.83E⫹07 2.43E⫹07 1.30E⫹06 1.11E⫹06 99,416 675,000 Pm3 50 Severe 113 1,022 4.24E⫹07 4.98E⫹06 826,254 1.55E⫹06 503,785 1.22E⫹06 Pm4 84 Severe 52 4,333 1.49E⫹09 1.14E⫹07 4.63E⫹06 1.92E⫹06 1,543 1.61E⫹07 Pm5 86 Mild 222 493 1.18E⫹07 1.84E⫹07 1.48E⫹06 807,774 247 1.19E⫹07 Pm6 85 None 396 525 3.65E⫹08 166,022 699 10,632 1,197 8.45E⫹06 Pm7 83 None 418 767 1.05E⫹07 117,088 22 14,995 332 8.68E⫹06
Pm8 79 None 56 416 2.20E⫹06 129,536 ND ND 129 5.51E⫹06
Pm9 87 None 464 874 1.25E⫹06 112,867 ND ND 152 4.40E⫹06
Pm10 84 None 693 1,071 300,229 12,105 ND ND 1,797 204,000
Pm11a 84 None 119 612 651,191 142,755 196 ND 282 268,000
Pm12b 34 None 681 481 4.55E⫹08 20,761 ND ND 741 866,000
Pm13b 35 None 390 350 1.72E⫹08 8.41E⫹07 3,365 96,705 421 1.62E⫹06 Pm14b 36 None 758 588 8.37E⫹07 1.33E⫹06 1,364 586 253 377,000
aThe animal was treated with fluconazole and paroxetine at day 12 postinoculation.
b
The animal was pretreated with minocycline at 28 days prior to infection.
cThe treatments did not affect virus replication or progression of disease. Abbreviations: ND, not detected (the level was below the limit of detection); Pm, pigtailed macaque.
on November 7, 2019 by guest
http://jvi.asm.org/
policies and approved by the Johns Hopkins School of Medicine Animal Care and Use Committee.
Isolation of myeloid cells and lymphocytes from blood and tissues. Peripheral blood mononuclear cells (PBMCs) were isolated by density gradient centrifugation on a 1.077-g/ml Percoll/Hanks gradient (GE Healthcare, Pittsburgh, PA) according to the manufacturer’s protocol. BAL fluid was obtained by passing 250 ml of sterile saline (Life Technol-ogies, Grand Island, NY) into the lungs via a bronchoscope. BAL fluid cells were isolated by passing the lavage samples through a 183-m-pore-size sterile mesh. Spleen and lung cells were mechanically removed from tis-sues using an 18-gauge needle and passed through a 100-m-mesh-size cell strainer. Brain parenchymal macrophages and microglia were isolated as previously described (41).
Blood, BAL fluid, lung, and spleen macrophages were cultured in RPMI 1640 medium (Life Technologies) supplemented with 20% heat-inactivated human type AB serum (Gemini Bio Products, West Sacra-mento, CA), 100 U/ml penicillin-streptomycin (Life Technologies), 20 g/ml gentamicin (Life Technologies), 2 mML-glutamine (Life
Technol-ogies), 2 mM sodium pyruvate (Sigma), 10 mM HEPES buffer (Life Tech-nologies), and 50 ng/ml recombinant human macrophage colony-stimu-lating factor (M-CSF; R&D, Minneapolis, MN). Brain macrophages were cultured in Dulbecco modified Eagle medium (Life Technologies) supple-mented with 5% heat-inactivated fetal bovine serum (FBS; Atlanta Bio-logicals), 5% IS giant cell tumor conditioned medium (Irvine Scientific, Santa Ana, CA), 100 U/ml penicillin-streptomycin (Life Technologies), 70 g/ml gentamicin (Life Technologies), 2 mML-glutamine (Life Technol-ogies), 3 mM sodium pyruvate (Sigma), and 10 mM HEPES buffer (Life Technologies).
CD4⫹T cells were cultured in RPMI 1640 medium supplemented with 10% heat-inactivated bovine serum (Atlanta Biologicals), 100 U/ml penicillin-streptomycin (Life Technologies), 1% T cell growth factor (31), and 100 U/ml interleukin-2 (IL-2; Novartis, New York, NY). Samples were analyzed fresh or frozen viably and rapidly thawed in the corre-sponding medium prior to cell isolation.
M-QVOA.Monocytes and tissue macrophages strongly express the integrin CD11b (42), a common myeloid marker (43–46). Myeloid cells were purified on the basis of expression of CD11b with a nonhuman primate CD11b antibody-conjugated microbead kit (Miltenyi Biotec, Au-burn, CA) according to the manufacturer’s protocol. The purified mac-rophages were cultured in triplicate in a 10-fold limiting dilution in the presence of 10M zidovudine (Sigma) and 25 nM darunavir (Janssen, Titusville, NJ) for 3 days for cell attachment or 7 days for differentiation of peripheral blood monocytes. Poly-L-lysine-coated plates (Sigma) were
used, and the plates were spun down at 2,000 rpm (872⫻g) for 10 min to increase cell adherence. The cells were washed twice with Hanks balanced salt solution (Life Technologies) to remove nonadherent CD3⫹ lympho-cytes. Medium containing 10 ng/ml recombinant human tumor necrosis factor alpha (TNF-␣; ProSpec, East Brunswick, NJ) and 1⫻105CEMx174
cells/well was added to each well. CEMx174 cells served to expand the virus released from infected cells, as previously described (47). The me-dium was replenished with TNF-␣after 4 days in coculture; supernatants and cell lysates were collected following 12 days of coculture with CEMx174 cells. The presence of replication-competent virus was deter-mined by isolating RNA from the supernatant and measuring the amount of SIV RNA by quantitative reverse transcription-PCR (qRT-PCR). The frequency of cells harboring replication-competent virus was determined by the use of limiting dilution assay statistics (32) and expressed as the number of infectious units per million (IUPM). The contents of two sets of negative-control wells with CEMx174 cells only were added to the cul-tures. In addition, to determine the number of CD3⫹T cells that were in the assay, the contents of duplicate control wells with CD11b⫹ macro-phages without CEMx174 cells were used to measure the amount of TCR RNA, as described below.
Generation of RNA standards for TCRRNA assay.RNA isolated from macaque CD3⫹T cells was reverse transcribed into cDNA using a
SuperScript II enzyme kit (Life Technologies) with 4.1 mM MgCl2, 0.5
mM (each) deoxynucleoside triphosphate, 1 mM dithiothreitol, 150 ng random hexamers, 1⫻first-strand buffer (provided in kit), and 1 unit of RNaseOUT in a 20-l reaction mixture. The sample was incubated at 25°C for 15 min, 42°C for 40 min, 85°C for 10 min, and 25°C for 10 min. The resulting cDNA was amplified by PCR using a PCR SuperMix high-fidelity kit (Life Technologies) with TCR-specific primers, forward primer 5=-GAG GAC CTG AAA AAG GTG TTC-3=and reverse primer 5=-CAT AGA GGA TGG TGG CAG ACA-3=, designed to be specific for the constant region of the TCRchain of macaques, as previously de-scribed (48). The mix was incubated for 30 s at 94°C, followed by 35 cycles of 94°C for 15 s, 50°C for 15 s, and 68°C for 30 s, and was then incubated at 72°C for 10 min. The resulting TCRPCR product was cloned into a pCR2.1 TOPO vector and sequenced, and the sequence was confirmed. Forin vitroRNA transcription, the plasmid was digested with BamHI, and TCRRNA was then generated with a MEGAscript T7 kit (Life Technol-ogies) and used as the control transcript for preparation of the standard curve.
Quantitation of TCRRNA.TCRRNA was quantitated by qRT-PCR using a QuantiTect kit (Qiagen), the above-described primers, and the probe 5=-/56-FAM/ACT TCC GCT/ZEN/GCC AAG TCC AGT TCT AT/3IABkFQ/-3=(where 56-FAM is 6-carboxyfluorescein, 3IABkFQ is 3= Iowa Black FQ, and Zen is an internal quencher [Integrated DNA Tech-nologies, Coralville, Iowa]), based on sequence analyses of macaque TCRRNA. Cycling conditions were as follows: 50°C for 30 min, 95°C for 15 min, and 45 cycles of 94°C for 15 s, 55°C for 15 s, and 60°C for 30 s. 18S rRNA was multiplexed with the TCRRNA to control for cell counts. To determine the average number of TCRcopies per CD3⫹T cell, PBMCs from seven uninfected macaques were labeled with phycoerythrin (PE)-conjugated anti-CD3 clone SP34 (BD Bioscience, San Jose, CA) and mag-netically separated using an EasySep PE positive selection kit (Stemcell Technologies, Vancouver, BC, Canada). The purity of the cells was con-firmed by flow cytometry (seeFig. 2A). A minimum of 4 aliquots of a million CD3⫹T cells from each macaque was used to isolate RNA that was analyzed by qRT-PCR for TCRRNA, and the number of copies of TCR RNA per macaque CD3⫹T cell was calculated (seeFig. 2B).
Flow cytometry.All CD11b⫹myeloid cells were labeled with PE-con-jugated anti-CD3 clone SP34 (BD Bioscience) and fluorescein isothiocya-nate-conjugated anti-CD11b clone Bear1 (Beckman Coulter, Brea, CA) to assess the selection efficiency. Purified CD4⫹T cells were stained with antibodies for HLA-DR clone L243 (BioLegend), CD3 clone SP34-2 (BD Bioscience), CD4 clone OKT4 (BioLegend), CD8 clone RPA-T8 (BioLeg-end), and TCR␥␦clone B1.1 (eBioscience). Cells were stained for 20 min at room temperature in 100l phosphate-buffered saline–2% FBS and fixed for 10 min with Fix/Lyse buffer (Becton Dickinson, Franklin Lakes, NJ). After fixation, samples were analyzed in a BD LSRFortessa flow cy-tometer using DIVA software (Becton Dickinson, Franklin Lakes, NJ). The gating of CD3⫹T cells was easily visualized as small CD3⫹ nonauto-fluorescent cells. All data were analyzed using FlowJo software. CD4⫹T cell and monocyte counts were analyzed as previously described (38).
Fluorescence microscopy.Cocultured live monocyte-derived macro-phages were treated at 37°C for 4 h with 10M pHrodo GreenEscherichia colibioparticles (Life Technologies), which can be phagocytosed only by functional macrophages and are nonfluorescent at neutral pH but which are fluorescent in the acidic pH of phagosomes (49). The cells were then stained at room temperature for 20 min with 2 drops/ml NucBlue live nuclear marker (Life Technologies), a Hoechst 33342 nuclear marker that emits fluorescence when bound to DNA (50). Images were taken on a Nikon Eclipse TE200 fluorescence microscope and merged using Adobe Photoshop CS4 software (Adobe, San Jose, CA).
T cell viral outgrowth assay.Total CD4⫹T cells were enriched by use of a nonhuman primate-specific microbead isolation kit (Miltenyi Bio-tec), which depleted cells expressing CD8, CD11b, CD16, CD20, CD56, and CD66abce. Infected CD4⫹T cells were quantified by using a previ-ously described 5-fold limiting dilution assay (34,35,47). The cells were
on November 7, 2019 by guest
http://jvi.asm.org/
cocultured with CEMx174 cells for 2 weeks. The culture supernatant was analyzed for SIV RNA by qRT-PCR. The frequencies of infected cells were determined by limiting dilution assay statistics (32) and were expressed in terms of the number of IUPM.
RNA isolation from cells and tissues.RNA was isolated from cell cultures with an RNeasy Plus minikit (Qiagen, Valencia, CA) according to the manufacturer’s protocol, with modifications. An on-column DNase digestion was performed using an RNase-free DNase kit (Qiagen) with the addition of 4 units of Turbo DNase (Life Technologies) to the enzyme mix. Two hundred microliters of fluid (from CSF, plasma, and culture supernatants) was isolated using a QIAamp MinElute virus spin kit (Qiagen) according to the manufacturer’s protocol, with modifications. An on-column DNase digestion was performed using the RNase-free DNase kit (Qiagen) with the addition of 3 units of RQ1 DNase (Promega, Madison, WI) to the enzyme mix.
Frozen tissues were isolated with RNase STAT-60 (Tel Test Inc., Friendswood, TX) and homogenized with a FastPrep-24 instrument (MP Biomedicals, Santa Ana, CA) in lysing matrix D tubes (MP Biomedicals). The sample was separated with chloroform, and the aqueous phase was treated with isopropanol to precipitate the RNA. The RNA was purified with an RNeasy minikit (Qiagen) with an on-column DNase digestion using the RNase-free DNase kit (Qiagen) and the addition of 3 units of RQ1 DNase (Promega) to the enzyme mix.
Quantitation of SIV RNA.SIV RNA was measured by qRT-PCR using a QuantiTect virus kit (Qiagen) and primers specific for the SIVgag re-gion, as previously described (34,51,52). Three reactions were performed for each sample. To control for DNA contamination, one reaction was analyzed by use of a reaction mixture without reverse transcriptase. Sam-ples were analyzed using a Rotor-Gene thermocycler (Qiagen).
PBMC infection.PBMCs from uninfected pigtailed macaques were isolated by use of a Percoll density gradient and plated in 48-well plates in RPMI 1640 medium supplemented with 2g/ml recombinant human IL-2 (Life Technologies) and 2g/ml phytohemagglutinin, M form (Life Technologies), overnight. The PBMCs were spinoculated for 2 h with 100 l supernatants from triplicate independent wells from M -QVOAs with samples from Pm6 and Pm4 (blood, spleen, microglia, and lung). The PBMCs were infected for 5 h at 37°C, the supernatant was removed, and excess virus was washed five times with sterile saline. The medium was replaced and supplemented with 2g/ml IL-2 (Life Technologies). Supernatants were collected at days 5, 10, and 13 post-inoculation.
SIVenvsequence analyses.Supernatant RNA was reverse transcribed into cDNA using a SuperScript III reverse transcriptase enzyme kit (Life Technologies) according to the manufacturer’s protocol. The resulting cDNA was amplified using a Platinum PCR SuperMix high-fidelity kit (Life Technologies), according to the manufacturer’s protocol, with two rounds of nested PCR against SIVenv-specific primers. The primer se-quences were as follows: for the 1st, round 5=-ARG AAT GCG ACA ATT CCC CT-3=for the forward primer and 5=-TCC ATC ATY CTT GTG CAT GAA G-3=for the reverse primer, and for the 2nd round, 5=-CAG TCA CAG AAC AGG CAA TAG A-3=for the forward primer and 5=-TAA GCA AAG CAT AAC CTG GMG GT-3=for the reverse primer. In both rounds, amplification was with the same cycling conditions: 94°C for 1 min and then 40 cycles of 94°C for 30 s, 55°C for 30 s, and 72°C for 1 min. The resulting product was⬃560 bp. The PCR product was purified using a DNA Clean & Concentrator-5 kit (Zymo Research) according to the man-ufacturer’s protocol and sequenced on an Illumina MiSeq sequencer. The sequences were analyzed using Geneious (version 8.0) software (Biomat-ters, Auckland, New Zealand).
Statistics.The frequencies of infected cells in limiting dilution assays were calculated using the IUPMStats (version 1.0) infection frequency calculator (http://silicianolab.johnshopkins.edu) (32). Correlations were computed using a two-tailed nonparametric Spearman rank correla-tion analysis. Statistical analyses were performed using Prism software (GraphPad Software, La Jolla, CA).
RESULTS
Development of M
-QVOAs.
The viral outgrowth assay used to
measure productively infected HIV- and SIV-infected resting
CD4
⫹T cells uses highly purified resting CD4
⫹T cells that are
serially diluted and activated with IL-2 (
31
,
33
). To amplify
infec-tious virus produced by CD4
⫹T cells, susceptible cells of human
cell lines (MT4 or CEMx174 cells) are added to each well and the
virus in the cell supernatants is quantified by qRT-PCR or
en-zyme-linked immunosorbent assay (
33–35
,
47
). The frequency of
productively infected cells is calculated on the basis of the number
of virus- or viral RNA-positive wells or replicates in each of the
serial dilutions (
32
,
33
).
Our macrophage quantitative viral outgrowth assay (M
-QVOA) was based on the same experimental approach used for
the CD4
⫹T cell QVOA. Monocytes and tissue macrophages
strongly express the integrin CD11b (
42
) and could be separated
from other cell types by sorting with CD11b-specific Miltenyi
magnetic beads (
43–46
). The CD11b
⫹cells were serially diluted,
and antiretroviral drugs were added to the culture to prevent virus
spread from nonadherent CD4
⫹T cells. Unlike T cells,
macro-phages do not divide exponentially when activated in culture and
require adherence to culture plates when grown
in vitro
(
53
). After
the monocytes or macrophages adhered to the culture plate,
re-sidual nonadherent T cells were removed from each well (
Fig. 1C
).
The purity of myeloid cells selected with CD11b-specific beads
was assessed by flow cytometry by examining cells that expressed
CD3 and CD11b. CD11b
⫹myeloid cells from blood, BAL fluid,
lungs, spleen, and brain from 14 SIV-infected macaques were
an-alyzed. Flow cytometry analyses of PBMCs isolated from blood
after CD11b
⫹cell selection showed that there were
⬍
1% CD3
⫹cells among the selected cells (
Fig. 1A
). The percentage of CD11b
⫹cells selected from tissues ranged from 94% to 99.1% (
Fig. 1B
).
CD11b
⫹cells adhered to the culture plates, and any residual
CD3
⫹lymphocytes that remained in the culture supernatant did
not proliferate (
Fig. 2C
).
To evaluate the presence of contaminating CD4
⫹T cells in the
macrophage cultures, CD11b
⫹macrophage control wells without
CEMx174 cells were analyzed at 12 days postseeding, the cells were
lysed, and TCR
RNA was quantitated by qRT-PCR. TCR
RNA
is present in macaque CD3
⫹T cells at an average of 3.8
⫾
0.8
copies per cell, as it was determined by qRT-PCR (
Fig. 2B
).
The number of CD3
⫹T cells was quantified prior to CD11b
⫹cell selection, after CD11b
⫹selection, and at the end of the
M-QVOAs in the control wells without CEMx174 cells (
Fig. 2C
). On
average, at the end of the assay less than 0.9% CD3
⫹T cells
re-mained among the monocyte-derived macrophages, 0.3% and
1.5% remained among the BAL fluid and lung macrophages,
re-spectively, 2.5% remained among the splenic macrophages, and
0.06% remained among the brain macrophages. Based on the
fre-quency of infection of CD4
⫹T cells quantitated by the standard
QVOA (see
Table 3
) and the CD4
⫹T cell percentages in the blood
and spleen determined by flow cytometry, we calculated that there
was, on average, less than one infected CD4
⫹T cell in any of the
M
-QVOAs (
Table 2
). Therefore, the small number of CD4
⫹T
cells that remained in the wells was not sufficient to contribute to
the amount of virus quantitated in the M
-QVOAs.
To ensure that SIV gene expression was active in all the infected
macrophages, TNF-␣, a potent activator of macrophages and the
U1 monocytic cell line (
54
,
55
), was added to all wells along
on November 7, 2019 by guest
http://jvi.asm.org/
with CEMx174 cells to expand replication-competent viruses.
CEMx174 is a T/B cell hybrid line widely used to propagate all
strains of SIV, including those used to infect the macaques in this
study (
47
,
56
).
Cell supernatants and lysates were isolated separately after 12
days of cocultivation (
Fig. 3A
). Viral RNA was isolated from cell
supernatants from triplicate wells and quantitated individually by
qRT-PCR. Wells were considered positive for SIV when RNA
lev-els were higher than 50 copies per 200
l of supernatant, which
was the threshold of detection for the qRT-PCR. The frequency of
virus according to the number of infectious units per million
(IUPM) was calculated using limiting dilution statistical analyses
(
32
).
To determine the viability of the macrophages cocultured with
CEMx174 cells, phagocytosis, a function of viable macrophages,
was measured by assessing the number of cells that engulfed
pHrodo Green
E. coli
bioparticles (
Fig. 3B
). Both CEMx174 cells
and macrophages were stained with NucBlue live nuclear stain.
The number of cells stained with both markers in each dilution of
macrophages reflected the number of viable CD11b
⫹macro-phages plated in the well. Despite the numerous CEMx174 cells in
the coculture system and the prolonged cell activation, the
num-ber of double-labeled macrophages reflected the numnum-ber
origi-nally plated. Furthermore, wells with 10
6CD11b
⫹macrophages
plated with CEMx174 cells (
Fig. 3B
, second column) and without
CEMx174 cells (
Fig. 3B
, last column) showed equivalent numbers
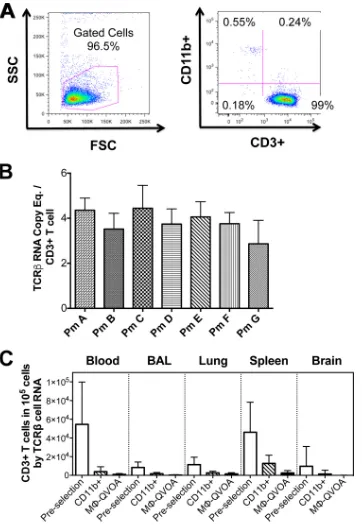
FIG 1Analysis of CD11b⫹monocytes and macrophages. Cells expressing CD11b were stained with antibodies to CD11b and CD3 to identify myeloid cells and lymphocytes. (A) Representative flow cytometry dot plots of the cell population after isolation with nonhuman primate-specific beads (left) and the highly purified population of CD11b⫹monocytes (right). (B) The frequency of CD11b⫹cells and CD3⫹cells in the indicated compartment was determined by flow cytometry. (C) Nonadherent cells from M-QVOAs were removed and analyzed by flow cytometry. Flow cytometry dot plots are shown for a representative animal. Cells were analyzed by forward scatter (FSC) and side scatter (SSC) (left) and for macrophage and T cell markers (right). Data are presented as means with standard deviations.on November 7, 2019 by guest
http://jvi.asm.org/
[image:5.585.133.451.64.507.2]of double-labeled cells. This suggests that the macrophages
re-mained viable throughout the M-QVOA, despite the coculture
conditions. Finally,
Fig. 3B
demonstrates that macrophages,
un-like lymphocytes, did not expand in culture; therefore, the
M-QVOA provides only a minimum estimate of the size of the
res-ervoir.
Quantitation of productively infected myeloid cells and
CD4
ⴙT cells in blood and tissues.
The SIV M-QVOA was used
to quantitate the number of productively infected monocytes in
blood and macrophages in the BAL fluid, lungs, spleen, and brain
of SIV-infected macaques (
Fig. 4
). The amount of infected
mac-rophages is an estimate of infection on the basis of the assumption
FIG 2Establishment of the TCRRNA assay. CD3⫹lymphocytes from PBMCs from seven uninfected macaques were purified using an anti-CD3 antibody-positive selection kit. CD3⫹cells were analyzed by flow cytometry. (A) Representative side scatter/forward scatter dot plots (left) and CD11b/CD3 plots (right) are shown. (B) The average number of TCRRNA copies per CD3⫹T cell was determined by qRT-PCR. Eq., equivalent. (C) The amount of TCRRNA in lysates of cells from the indicated compartments from M-QVOAs was measured by qRT-PCR, and the average number of CD3⫹T cells per 105cells was calculated prior to selection, following CD11b isolation, and in CD11b⫹macrophage control wells from M-QVOAs. Data are presented as means with standard deviations.on November 7, 2019 by guest
http://jvi.asm.org/
[image:6.585.111.473.65.591.2]that the cells isolated are representative of the population in each
tissue. The frequency of productively infected macrophages in
each tissue varied among the macaques, with the highest number
being found in the spleen (median, 424 IUPM), a secondary
lym-phoid tissue that contains both CD4
⫹T cells and tissue-resident
macrophages. A high frequency of productively infected
macro-phages was found in macaques with late-stage disease (
⬎
84 dpi) as
well as those with chronic disease (34 to 36 dpi), suggesting that
there is a steady-state level of infected macrophages in spleen or
that there is replenishment of infected macrophages throughout
infection due to macrophage turnover. In lung, the numbers of
productively infected interstitial macrophages were also very
sim-ilar between the animals with late-stage disease and those with
chronic infection; the number of productively infected interstitial
macrophages was
⬃
2.5-fold higher than the numbers of
produc-tively infected alveolar macrophages. However, when the
num-bers of productively infected interstitial and alveolar macrophages
within the same macaque were compared, the levels correlated
significantly (
r
⫽
1,
P
⬍
0.05) (
Fig. 5
). The interstitial
macro-phages are derived from blood monocytes, and interestingly,
monocyte-derived macrophages from blood had 31.5 IUPM,
equivalent to the levels in interstitial macrophages (32.2 IUPM)
(
Fig. 4
).
The majority of the CD11b
⫹cells isolated from brain represent
microglia; however, perivascular macrophages, which are
mono-cyte-derived macrophages from blood, also express CD11b. Brain
had the widest range of productively infected
microglia/macro-phages among all the tissues and between macaques. While spleen
contained the highest number of infected cells, the brains of
ani-mals with mild to severe CNS disease contained the next highest
number of infected cells (median, 231 IUPM). The two macaques
with the most productively infected cells (Pm3 and Pm4, with
24,000 IUPM) had severe encephalitis and high levels of viral RNA
in their brains. The macaques without CNS disease (Pm9
through Pm12) had undetectable numbers of infected
micro-glia/macrophages (
Table 3
) and little or no detectable viral
RNA in the brain (
Table 1
). The number of productively
in-fected microglia/macrophages trended toward a correlation
with the SIV RNA level in the two regions of the brain with the
highest levels of viral RNA, the basal ganglia (
r
⫽
0.71) and
parietal cortex (
r
⫽
0.64) (
Fig. 5
).
Productively infected CD4
⫹T cells in the blood had a median
of 206 IUPM, a number almost 10-fold higher than the number
for infected monocytes in blood (
34
,
35
). However, there was no
correlation between the plasma viral load and the frequency of
infected macrophages or lymphocytes in a particular tissue or
blood. The QVOAs provided a means for comparison of the
minimum estimate of the level of productive infection in the
two major SIV target cells. Further, they suggested that
macro-phages are a significant source of virus from tissues during
chronic infection.
Infectivity and sequence analyses of virus from M
-QVOAs.
To confirm that virus produced in the M
-QVOAs was
replica-tion competent, virus-containing supernatants from the
M-QVOAs with blood monocyte-derived macrophages, lungs,
spleens, and brains from SIV-infected macaques Pm4 and Pm6
were used to infect PBMCs isolated from uninfected macaques.
After infection, supernatants from the newly infected PBMCs
were analyzed at multiple time points for SIV RNA by
qRT-PCR. Viral spread was observed in all wells (
Fig. 6B
), indicating
that all original M
-QVOA supernatants contained
replica-tion-competent virus. Interestingly, wells with
⬍50 copies per
200
l of supernatant in the spleen (
Fig. 6C
, red symbols)
efficiently infected the PBMCs, suggesting that the virus in the
M
-QVOAs was infectious even when low levels of SIV RNA
were found in the supernatants. This provides evidence that
this novel viral outgrowth assay functions like the CD4
⫹T cell
QVOA.
Sequence analysis of the V1 region of SIV
env
was performed
with virus isolated from the QVOA wells done with both CD4
⫹T
cells and macrophages from the spleens of SIV-infected macaques
Pm4, Pm5, and Pm6. The predominant virus found by the
M-TABLE 2Percentages of infected CD4⫹T cells among macrophages in blood and spleen M-QVOAsCompartment and animal identifiera
No. of IUPM in CD4⫹ T cells
% CD3⫹T cells in M-QVOA by TCRRNA level
% CD4⫹T cells among CD3⫹ cells by flow cytometry
% CD4⫹T cells in M-QVOA by TCRRNA level
% infected CD4⫹ T cells in M-QVOA
No. of IUPM in CD11b⫹ macrophages
Blood
Pm4 8.08 0.17 48 0.08 0.0 369.97
Pm5 40.52 1.27 44 0.56 0.2 139. 38
Pm6 205.84 2.01 32 0.64 1.3 23,116.35
Pm7 71.06 0 34 0 0 2.07
Pm8 1,121.51 0 34 0 0 ⬍0.1b
Pm9 81.70 2.20 31 0.69 0.6 45.96
Pm12 420 0 64 0 0 8.48
Pm13 205.84 1.58 32 0.50 1.0 16.97
Pm14 1121.51 0.31 54 0.17 1.9 4.62
Spleen
Pm4 40.52 0.36 17 0.06 0.0 423.93
Pm5 9.14 6.23 23 1.41 0.1 854.58
Pm6 40.52 5.74 6 0.32 0.1 93,280.33
Pm9 205.84 2.02 9 0.18 0.4 23.12
a
Pm, pigtail macaque.
bBelow the limit of detection.
on November 7, 2019 by guest
http://jvi.asm.org/
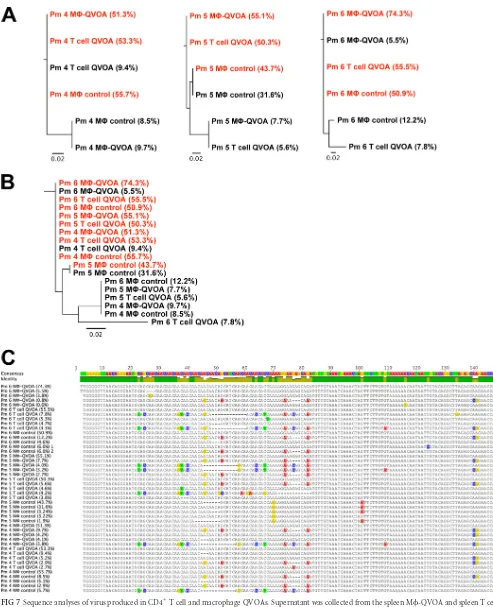
[image:7.585.39.549.79.284.2]QVOA and the CD4
⫹T cell QVOA within the spleen of the same
macaque was very similar (
Fig. 7A
). Furthermore, the viruses
pro-duced from CD4
⫹T cells and macrophages from three animals
also had very similar sequences (
Fig. 7B
and
C
). To exclude the
possibility of virus selection from coculture with CEMx174 cells,
virus isolated from control CD11b
⫹macrophage wells without
CEMx174 cells was also analyzed. Virus from only one
macro-phage control well had a sequence different from the predominant
sequence in the other M-QVOA wells (
Fig. 7
). This suggests that
coculture with CEMx174 cells did not significantly affect the
vi-ruses that replicated and that were detected in the M-QVOAs.
Further, the similarity of the infectious virus isolated from CD4
⫹T cells and macrophages in spleen during chronic infection
sug-gests that the SIVs in spleen during this period are dual tropic,
infecting both CD4
⫹T cells and macrophages.
DISCUSSION
HIV and SIV infection in tissues and
in vitro
has been widely
studied. However, the number of macrophages in tissues and
monocytes in blood that harbor replication-competent virus
has not been quantitated. In this study, we developed an assay
to measure the number of blood monocytes and tissue
macro-phages that contain replication-competent virus. This assay is
based on our previous macaque CD4
⫹T cell QVOA. The assay
required an understanding that macrophages require culture
conditions for adherence and that they do not undergo
expo-nential expansion like CD4
⫹T cells do. The
in vitro
culture of
primary tissue macrophages also required different conditions
for each tissue that we studied, unlike isolation of CD4
⫹T cells
from blood and tissues. In order to select macrophages from
tissues, expression of the CD11b antigen was used since it is
uniformly expressed on monocytes and macrophages. In
addi-tion, to exclude the contribution of CD4
⫹T cells to this assay,
we developed an assay for the detection and quantitation of
TCR

RNA.
Using this M-QVOA, we quantitated the number of
macro-phages that contained replication-competent virus in the blood,
BAL fluid, lung, spleen, and brain of SIV-infected macaques. We
demonstrated that macrophages isolated from the blood and from
several tissues of SIV-infected macaques harbored
replication-competent virus. We also showed that the blood-derived and
tis-sue macrophages used in the M-QVOA had normal phagocytic
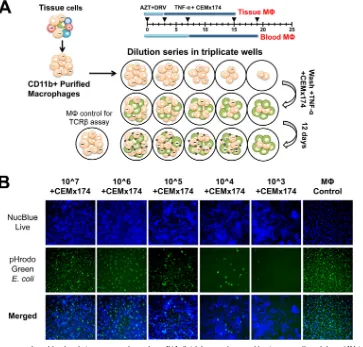
FIG 3M-QVOA. Monocytes from blood and tissue macrophages from BAL fluid, lung, spleen, and brain were collected from SIV-infected animals and purified by CD11b-specific bead selection. Macrophages expressing CD11b were plated in serial dilutions in triplicate wells. Cells were cultured with zidovudine (AZT) and darunavir (DRV). Nonadherent cells and the antiretrovirals were removed prior to activation with TNF-␣and coculture with CEMx174 cells. (A) Schematic of M-QVOA. (B) Live fluorescence microscopy of CD11b⫹monocyte-derived macrophages cocultured with CEMx174 cells stained with NucBlue live nuclear marker (top row, blue) or pHrodo GreenE. coli(middle row, green). Merged images are shown in the bottom row. Images were taken on a Nikon Eclipse TE200 microscope. Magnifications,⫻10.on November 7, 2019 by guest
http://jvi.asm.org/
[image:8.585.112.475.67.414.2]function and remained viable throughout the assay, despite
pro-longed culture and activation with TNF-
␣
. Further, the virus
pro-duced by the cells in the M-QVOA was capable of
de novo
infec-tion of macaque PBMCs. Finally, we characterized the virus
isolated from the M-QVOA by analyzing
env
sequences and
vi-rus infectivity in PBMCs. The
env
sequences from viruses isolated
from CD4
⫹T cell and macrophage QVOAs were not substantially
different. All isolated viruses replicated efficiently in PBMCs,
sug-gesting no selection in macrophages for altered virus tropism.
The number of productively infected macrophages in a given
tissue was surprisingly similar from macaque to macaque, whereas
the number of productively infected macrophages in different
tis-sues from the same SIV-infected macaque varied widely. The
nearly 10-fold difference in the number of productively infected
monocytes and the number of productively infected CD4
⫹T cells
in blood suggests that monocytes either are less susceptible to SIV
infection, have a higher turnover, or harbor more viral genomes
that are not replication competent. The highest number of
in-fected macrophages (424 IUPM) was measured in spleen,
demon-strating that splenic macrophages are highly susceptible to SIV
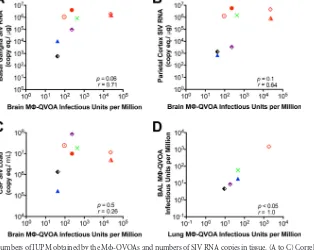
FIG 4Quantitation of SIV-infected monocytes, macrophages, and CD4⫹T cells in SIV-infected macaques. Monocytes and macrophages from blood, BAL fluid, lung, spleen, and brain were cocultured in M-QVOAs. CD4⫹T cells from the blood and spleen were isolated and plated in a limiting dilution similar to that for the M-QVOAs. The amount of SIV RNA in the supernatant was measured by qRT-PCR, and the frequency of IUPM was calculated using limiting dilution statistics based on the number of positive wells and the input number of cells. The number of IUPM for macrophages and T cells for each animal assayed is shown. Horizontal black lines, median IUPM values (displayed on thexaxis); red symbols, animals with severe CNS disease.FIG 5Correlation between the numbers of IUPM obtained by the M-QVOAs and numbers of SIV RNA copies in tissue. (A to C) Correlation between the numbers of IUPM from brain M-QVOA and numbers of SIV RNA copies in basal ganglion tissue (A) and parietal cortex tissue (B) and the CSF viral load (C); (D) correlation between the numbers of IUPM in lung macrophages and the numbers of IUPM in BAL fluid macrophages. Each symbol represents a single animal, and symbols in red represent animals with severe CNS disease. Significance was determined by Spearman’s rank correlation; aPvalue of⬍0.05 was considered significant.
on November 7, 2019 by guest
http://jvi.asm.org/
[image:9.585.65.532.67.229.2] [image:9.585.140.454.435.685.2]infection and harbor high levels of productive genomes. This
sug-gests a role for tissue microenvironments in mediating virus
in-fection of macrophages (
57
,
58
). The populations of macrophages
that reside in each tissue may be differentially susceptible to SIV/
HIV infection on the basis of the cytokine profiles of the organs
(
59–61
).
[image:10.585.41.546.80.267.2]It has recently been demonstrated that tissues contain two
phe-notypically different macrophage populations that are derived
TABLE 3Macrophage and CD4⫹T cell IUPM in blood and tissuesAnimal
identifiera CNS score
No. of IUPM in the indicated compartment by:
M-QVOA CD4⫹QVOA
Blood BAL fluid Lung Spleen Brain Blood Spleen
Pm1 Severe 231.16
Pm2 Severe 93.28
Pm3 Severe 23,978.95
Pm4 Severe 369.97 1,481.48 1,838.35 423.93 23,116.35 8.08 40.52
Pm5 Mild 139.38 57.79 46.23 854.58 427.29 40.52 9.14
Pm6 None 23,116.35 18.38 46.07 93,280.33 42.39 205.84 40.52
Pm7 None 2.07 71.06 81.70
Pm8 None ⬍0.1b 1,121.51 205.84
Pm9 None 45.96 1.81 ⬍1.0b 23.12 ⬍0.42b 81.70 205.84
Pm10 None ⬍2.31b
Pm11 None ⬍1.05b
Pm12 None 8.48 ⬍1.0b 11.56 57.79 ⬍0.2b 420
Pm13 None 16.97 8.48 18.38 462.33 231.16 205.84
Pm14 None 4.62 4.62 9.19 313.67 42.42 1121.51
aPm, pigtail macaque.
b
Below the limit of detection.
FIG 6Virus produced in M-QVOAs is replication competent. Supernatant was collected from the blood M-QVOA (A), lung M-QVOA (B), spleen M-QVOA (C), and brain M-QVOA (D) for Pm4 (filled symbols) and Pm6 (open symbols) and used to infect freshly isolated PBMCs by spinoculation. The amount of SIV RNA in the supernatant was measured by qRT-PCR prior to infection (input virus) and longitudinally for 13 dpi. SIV RNA levels are presented as the number of copies per 200l. Red symbols, wells whose input virus was undetectable.
on November 7, 2019 by guest
http://jvi.asm.org/
[image:10.585.139.450.365.684.2]FIG 7Sequence analyses of virus produced in CD4⫹T cell and macrophage QVOAs. Supernatant was collected from the spleen M-QVOA and spleen T cell QVOA for Pm4, Pm5, and Pm6. Viral RNA was isolated, and a two-round nested PCR for SIVenvwas performed. CD11b⫹macrophage wells without CEMx174 cells from the M-QVOA were used as controls. The most frequent (red) and the second most frequent (black) sequences are depicted along with the frequency of the viral clone (indicated in parentheses). (A and B) A tree of the nucleotide sequence alignment for each animal (A) and a phylogenetic tree of all clones (B) are shown. (C) Comparison of the nucleotide sequences of the prevailing clones with the consensus sequence, with percentages signifying the frequency of the clones. The scale bar represents the distance between the sequences. Analyses were performed by Geneious (version 8.0) software.
on November 7, 2019 by guest
http://jvi.asm.org/
[image:11.585.39.532.61.668.2]from either resident (i.e., fetus-derived) macrophages or
mono-cyte-derived macrophages that enter tissues from the bloodstream
(
62
,
63
). There are many indications that both types of
macro-phages harbor persistent virus after suppression of the infection
with ART. For example, some HIV-infected patients have a
com-pletely controlled plasma viral load yet have detectable virus in the
CSF, and some of these patients have accompanying CNS
symp-toms (
64
,
65
). HIV and SIV infection in brain is predominantly in
resident microglia and perivascular macrophages (
66–68
). In
ad-dition, lung inflammation is ongoing in some patients on ART in
which HIV infection is suppressed, in part due to infected tissue
macrophages (
69
,
70
). ART suppression of virus replication at all
stages of disease likely leads to the persistence of infected myeloid
cells in tissues. The M-QVOA that we have developed can be
used for human monocytes and macrophages, and the TCR

RNA qRT-PCR assay can detect transcripts from both human and
macaque CD3
⫹T cells. The M
-QVOA will be important for
measuring the number of myeloid cells in the tissues of
SIV-in-fected macaques and HIV-inSIV-in-fected individuals on ART in which
infection is suppressed.
We have previously reported a significant correlation between
CNS pathology and an elevated CSF viral load but not an elevated
plasma viral load (
38
); this has also been reported in HIV-infected
individuals with CNS encephalitis prior to ART (
71
).
Quantita-tion of productively infected macrophages in the brain using the
M-QVOA strongly supports the hypothesis that CD11b
⫹micro-glia/macrophages in the brain are the major contributors to CNS
infection since a trend toward a correlation between the number
of infected macrophages in both the basal ganglia and parietal
cortex of the brain with viral RNA levels but not the plasma viral
load was found. It is important to note that even in a model with a
high prevalence of CNS pathology similar to that in human
dis-ease, not all of the macaques in this study developed severe CNS
disease. However, those that did develop mild-severe CNS disease
had the highest frequency of infected macrophages in the brain.
This study suggests that the frequency of infection of macrophages
in the brain is directly correlated with and leads to CNS pathology.
In this study, both blood and tissue from untreated
SIV-in-fected macaques were analyzed because the numbers of
produc-tively SIV-infected myeloid cells and CD4
⫹T cells in tissues
dur-ing infection have not previously been measured. Our results
establish that productively infected tissue macrophages can be
quantitated, that the virus produced is infectious, and that there is
no TCR
RNA detectable in the infected macrophages. A recent
report concluded that tissue macrophages in SIV-infected
ma-caques contained SIV DNA from phagocytosis of CD4
⫹T cells
and that tissue macrophages were not a major source of virus
in
vivo
(
72
). In sharp contrast, we developed novel optimized
meth-ods for the isolation and evaluation of tissue macrophages, to
demonstrate clearly that SIV-infected tissue macrophages
pro-duce abundant replication-competent virus. Of note, these novel
assays provide a minimum estimate of the amount of productively
infected CD4
⫹T cells and myeloid cells in SIV-infected tissues
in
vivo
. It is possible that phagocytized CD4
⫹T cells infect
macro-phages
in vivo
, as it has been demonstrated
in vitro
(
73
), although
a recent study using mouse models has indicated that
macro-phages can sustain replication
in vivo
independently of T cells
(
74
). Using our techniques, it will now be possible to quantify the
number of latently infected CD4
⫹T cells and persistently infected
myeloid cells that harbor replication-competent virus in
SIV-in-fected macaques in which infection is suppressed by ART to
ad-vance our understanding of HIV latency.
ACKNOWLEDGMENTS
We thank Jeanne Sisk for assistance and the Johns Hopkins School of Medicine Retrovirus Laboratory for technical assistance and guidance.
We declare no conflict of interest.
This study was supported by NCRR and the Office of Research Infra-structure Programs (ORIP) of the NIH (grant P40 OD013117) and NIH grants P01 MH070306, NS077869, NS076357, U19-0AI076113, and R56 AI118753.
The funders had no role in the study design, data collection and inter-pretation, or the decision to submit the work for publication.
FUNDING INFORMATION
This work, including the efforts of Joseph L. Mankowski, was funded by HHS | National Institutes of Health (NIH) (P40 OD013117). This work, including the efforts of Joseph L. Mankowski, M. Christine Zink, Lucio Gama, and Janice E. Clements, was funded by HHS | National Institutes of Health (NIH) (P01 MH070306). This work, including the efforts of Janice E. Clements and Joseph L. Mankowski, was funded by HHS | National Institutes of Health (NIH) (R01 NS077869). This work, including the efforts of Janice E. Clements and Lucio Gama, was funded by HHS | National Institutes of Health (NIH) (R01 NS076357, U19 AI096113, and R56 AI118753).
REFERENCES
1.Gendelman HE, Narayan O, Molineaux S, Clements JE, Ghotbi Z.1985. Slow, persistent replication of lentiviruses: role of tissue macrophages and macrophage precursors in bone marrow. Proc Natl Acad Sci U S A82:
7086 –7090.http://dx.doi.org/10.1073/pnas.82.20.7086.
2.Cheevers WP, McGuire TC.1985. Equine infectious anemia virus: im-munopathogenesis and persistence. Rev Infect Dis7:83– 88.http://dx.doi .org/10.1093/clinids/7.1.83.
3.Ho DD, Rota TR, Hirsch MS.1986. Infection of monocyte/macrophages by human T lymphotropic virus type III. J Clin Invest77:1712–1715.http: //dx.doi.org/10.1172/JCI112491.
4.Lifson JD, Feinberg MB, Reyes GR, Rabin L, Banapour B, Chakrabarti S, Moss B, Wong-Staal F, Steimer KS, Engleman EG.1986. Induction of CD4-dependent cell fusion by the HTLV-III/LAV envelope glycoprotein. Nature323:725–728.http://dx.doi.org/10.1038/323725a0.
5.Gallo RC.1991. Human retroviruses: a decade of discovery and link with human disease. J Infect Dis164:235–243.http://dx.doi.org/10.1093/infdis /164.2.235.
6.Chiu IM, Yaniv A, Dahlberg JE, Gazit A, Skuntz SF, Tronick SR, Aaronson SA.1985. Nucleotide sequence evidence for relationship of AIDS retrovirus to lentiviruses. Nature317:366 –368.http://dx.doi.org/10 .1038/317366a0.
7.Haase AT.1986. Pathogenesis of lentivirus infections. Nature322:130 – 136.http://dx.doi.org/10.1038/322130a0.
8.Kelly KM, Tarwater PM, Karper JM, Bedja D, Queen SE, Tunin RS, Adams RJ, Kass DA, Mankowski JL. 2012. Diastolic dysfunction is associated with myocardial viral load in simian immunodeficiency virus-infected macaques. AIDS 26:815– 823. http://dx.doi.org/10.1097/QAD .0b013e3283518f01.
9.Laast VA, Shim B, Johanek LM, Dorsey JL, Hauer PE, Tarwater PM, Adams RJ, Pardo CA, McArthur JC, Ringkamp M, Mankowski JL.2011. Macrophage-mediated dorsal root ganglion damage precedes altered nerve conduction in SIV-infected macaques. Am J Pathol179:2337–2345.
http://dx.doi.org/10.1016/j.ajpath.2011.07.047.
10. Babas T, Vieler E, Hauer DA, Adams RJ, Tarwater PM, Fox K, Cle-ments JE, Zink MC.2001. Pathogenesis of SIV pneumonia: selective replication of viral genotypes in the lung. Virology287:371–381.http://dx .doi.org/10.1006/viro.2001.1043.
11. Zink MC, Clements JE.2002. A novel simian immunodeficiency virus model that provides insight into mechanisms of human immunodefi-ciency virus central nervous system disease. J Neurovirol8(Suppl 2):
S42–S48.
on November 7, 2019 by guest
http://jvi.asm.org/
12. Stevenson M.2015. Role of myeloid cells in HIV-1-host interplay. J Neu-rovirol21:242–248.http://dx.doi.org/10.1007/s13365-014-0281-3. 13. Yona S, Kim KW, Wolf Y, Mildner A, Varol D, Breker M, Strauss-Ayali
D, Viukov S, Guilliams M, Misharin A, Hume DA, Perlman H, Malis-sen B, Zelzer E, Jung S.2013. Fate mapping reveals origins and dynamics of monocytes and tissue macrophages under homeostasis. Immunity38:
79 –91.http://dx.doi.org/10.1016/j.immuni.2012.12.001.
14. Hashimoto D, Chow A, Noizat C, Teo P, Beasley MB, Leboeuf M, Becker CD, See P, Price J, Lucas D, Greter M, Mortha A, Boyer SW, Forsberg EC, Tanaka M, van Rooijen N, Garcia-Sastre A, Stanley ER, Ginhoux F, Frenette PS, Merad M.2013. Tissue-resident macrophages self-maintain locally throughout adult life with minimal contribution from circulating monocytes. Immunity38:792– 804.http://dx.doi.org/10 .1016/j.immuni.2013.04.004.
15. Davies LC, Jenkins SJ, Allen JE, Taylor PR.2013. Tissue-resident mac-rophages. Nat Immunol14:986 –995.http://dx.doi.org/10.1038/ni.2705. 16. Ginhoux F, Jung S.2014. Monocytes and macrophages: developmental
pathways and tissue homeostasis. Nat Rev Immunol14:392– 404.http: //dx.doi.org/10.1038/nri3671.
17. Prinz M, Priller J.2014. Microglia and brain macrophages in the molec-ular age: from origin to neuropsychiatric disease. Nat Rev Neurosci15:
300 –312.http://dx.doi.org/10.1038/nrn3722.
18. Gomez Perdiguero E, Klapproth K, Schulz C, Busch K, Azzoni E, Crozet L, Garner H, Trouillet C, de Bruijn MF, Geissmann F, Rodewald HR.2015. Tissue-resident macrophages originate from yolk-sac-derived erythro-myeloid progenitors. Nature518:547–551.http://dx.doi.org/10 .1038/nature13989.
19. Walker-Sperling VE, Buckheit RW, III, Blankson JN.2014. Compara-tive analysis of the capacity of elite suppressor CD4⫹and CD8⫹T cells to inhibit HIV-1 replication in monocyte-derived macrophages. J Virol88:
9789 –9798.http://dx.doi.org/10.1128/JVI.00860-14.
20. Vojnov L, Martins MA, Bean AT, Veloso de Santana MG, Sacha JB, Wilson NA, Bonaldo MC, Galler R, Stevenson M, Watkins DI.2012. The majority of freshly sorted simian immunodeficiency virus (SIV)-specific CD8(⫹) T cells cannot suppress viral replication in SIV-infected macrophages. J Virol 86:4682– 4687. http://dx.doi.org/10 .1128/JVI.06324-11.
21. Clements JE, Mankowski JL, Gama L, Zink MC.2008. The acceler-ated simian immunodeficiency virus macaque model of human immu-nodeficiency virus-associated neurological disease: from mechanism to treatment. J Neurovirol 14:309 –317. http://dx.doi.org/10.1080 /13550280802132832.
22. Ribeiro Dos Santos P, Rancez M, Pretet JL, Michel-Salzat A, Messent V, Bogdanova A, Couedel-Courteille A, Souil E, Cheynier R, Butor C.
2011. Rapid dissemination of SIV follows multisite entry after rectal inoc-ulation. PLoS One6:e19493.http://dx.doi.org/10.1371/journal.pone .0019493.
23. Yen PJ, Mefford ME, Hoxie JA, Williams KC, Desrosiers RC, Gabuzda D.2014. Identification and characterization of a macrophage-tropic SIV envelope glycoprotein variant in blood from early infection in SIVmac251-infected macaques. Virology 458 – 459:53– 68.http://dx .doi.org/10.1016/j.virol.2014.03.024.
24. Francella N, Gwyn SE, Yi Y, Li B, Xiao P, Elliott ST, Ortiz AM, Hoxie JA, Paiardini M, Silvestri G, Derdeyn CA, Collman RG.2013. CD4⫹T cells support production of simian immunodeficiency virus Env antibod-ies that enforce CD4-dependent entry and shape tropism in vivo. J Virol
87:9719 –9732.http://dx.doi.org/10.1128/JVI.01254-13.
25. Williams KC, Burdo TH.2009. HIV and SIV infection: the role of cellular restriction and immune responses in viral replication and pathogenesis. APMIS117:400 – 412.http://dx.doi.org/10.1111/j.1600 -0463.2009.02450.x.
26. Williams K, Westmoreland S, Greco J, Ratai E, Lentz M, Kim WK, Fuller RA, Kim JP, Autissier P, Sehgal PK, Schinazi RF, Bischofberger N, Piatak M, Lifson JD, Masliah E, Gonzalez RG. 2005. Magnetic resonance spectroscopy reveals that activated monocytes contribute to neuronal injury in SIV neuroAIDS. J Clin Invest115:2534 –2545.http://dx .doi.org/10.1172/JCI22953.
27. McIlroy D, Autran B, Cheynier R, Clauvel JP, Oksenhendler E, Debre P, Hosmalin A.1996. Low infection frequency of macrophages in the spleens of HIV⫹ patients. Res Virol147:115–121.http://dx.doi.org/10 .1016/0923-2516(96)80225-1.
28. Cribbs SK, Lennox J, Caliendo AM, Brown LA, Guidot DM. 2015. Healthy HIV-1-infected individuals on highly active antiretroviral therapy
harbor HIV-1 in their alveolar macrophages. AIDS Res Hum Retroviruses
31:64 –70.http://dx.doi.org/10.1089/aid.2014.0133.
29. Eriksson S, Graf EH, Dahl V, Strain MC, Yukl SA, Lysenko ES, Bosch RJ, Lai J, Chioma S, Emad F, Abdel-Mohsen M, Hoh R, Hecht F, Hunt P, Somsouk M, Wong J, Johnston R, Siliciano RF, Richman DD, O’Doherty U, Palmer S, Deeks SG, Siliciano JD.2013. Comparative analysis of measures of viral reservoirs in HIV-1 eradication studies. PLoS Pathog9:e1003174.http://dx.doi.org/10.1371/journal.ppat.1003174. 30. Ho YC, Shan L, Hosmane NN, Wang J, Laskey SB, Rosenbloom DI, Lai
J, Blankson JN, Siliciano JD, Siliciano RF.2013. Replication-competent noninduced proviruses in the latent reservoir increase barrier to HIV-1 cure. Cell155:540 –551.http://dx.doi.org/10.1016/j.cell.2013.09.020. 31. Siliciano JD, Siliciano RF.2005. Enhanced culture assay for detection and
quantitation of latently infected, resting CD4⫹T-cells carrying replica-tion-competent virus in HIV-1-infected individuals. Methods Mol Biol
304:3–15.
32. Rosenbloom DIS, Elliott O, Hill AL, Henrich TJ.2015. Designing and interpreting limiting dilution assays: general principles and applications to the latent reservoir for human immunodeficiency virus-1. Open Forum Infect Dis2:ofv123.http://dx.doi.org/10.1093/ofid/ofv123.
33. Laird GM, Eisele EE, Rabi SA, Lai J, Chioma S, Blankson JN, Siliciano JD, Siliciano RF.2013. Rapid quantification of the latent reservoir for HIV-1 using a viral outgrowth assay. PLoS Pathog9:e1003398.http://dx .doi.org/10.1371/journal.ppat.1003398.
34. Shen A, Zink MC, Mankowski JL, Chadwick K, Margolick JB, Carruth LM, Li M, Clements JE, Siliciano RF.2003. Resting CD4⫹T lymphocytes but not thymocytes provide a latent viral reservoir in a simian immuno-deficiency virus-Macaca nemestrina model of human immunoimmuno-deficiency virus type 1-infected patients on highly active antiretroviral therapy. J Virol77:4938 – 4949.http://dx.doi.org/10.1128/JVI.77.8.4938-4949.2003. 35. Dinoso JB, Rabi SA, Blankson JN, Gama L, Mankowski JL, Siliciano RF, Zink MC, Clements JE.2009. A simian immunodeficiency virus-infected macaque model to study viral reservoirs that persist during highly active antiretroviral therapy. J Virol 83:9247–9257.http://dx.doi.org/10.1128 /JVI.00840-09.
36.Mankowski JL, Flaherty MT, Spelman JP, Hauer DA, Didier PJ, Amedee AM, Murphey-Corb M, Kirstein LM, Munoz A, Clements JE, Zink MC.1997. Pathogenesis of simian immunodeficiency virus enceph-alitis: viral determinants of neurovirulence. J Virol71:6055– 6060. 37. Zink MC, Spelman JP, Robinson RB, Clements JE.1998. SIV infection
of macaques—modeling the progression to AIDS dementia. J Neurovirol
4:249 –259.http://dx.doi.org/10.3109/13550289809114526.
38. Zink MC, Suryanarayana K, Mankowski JL, Shen A, Piatak M, Jr, Spelman JP, Carter DL, Adams RJ, Lifson JD, Clements JE.1999. High viral load in the cerebrospinal fluid and brain correlates with severity of simian immunodeficiency virus encephalitis. J Virol73:10480 –10488. 39. Babas T, Dewitt JB, Mankowski JL, Tarwater PM, Clements JE, Zink
MC.2006. Progressive selection for neurovirulent genotypes in the brain of SIV-infected macaques. AIDS20:197–205.http://dx.doi.org/10.1097 /01.aids.0000198078.24584.21.
40. Meulendyke KA, Queen SE, Engle EL, Shirk EN, Liu J, Steiner JP, Nath A, Tarwater PM, Graham DR, Mankowski JL, Zink MC.2014. Combi-nation fluconazole/paroxetine treatment is neuroprotective despite ongo-ing neuroinflammation and viral replication in an SIV model of HIV neurological disease. J Neurovirol20:591– 602.http://dx.doi.org/10.1007 /s13365-014-0283-1.
41. Babas T, Munoz D, Mankowski JL, Tarwater PM, Clements JE, Zink MC.2003. Role of microglial cells in selective replication of simian immu-nodeficiency virus genotypes in the brain. J Virol77:208 –216.http://dx .doi.org/10.1128/JVI.77.1.208-216.2003.
42. Arnaout MA.1990. Structure and function of the leukocyte adhesion molecules CD11/CD18. Blood75:1037–1050.
43. Harms AS, Tansey MG.2013. Isolation of murine postnatal brain micro-glia for phenotypic characterization using magnetic cell separation tech-nology. Methods Mol Biol1041:33–39.http://dx.doi.org/10.1007/978-1 -62703-520-0_5.
44. Marek R, Caruso M, Rostami A, Grinspan JB, Das Sarma J. 2008. Magnetic cell sorting: a fast and effective method of concurrent isolation of high purity viable astrocytes and microglia from neonatal mouse brain tissue. J Neurosci Methods 175:108 –118.http://dx.doi.org/10.1016/j .jneumeth.2008.08.016.
45. Dupuis M, Denis-Mize K, Woo C, Goldbeck C, Selby MJ, Chen MC, Otten GR, Ulmer JB, Donnelly JJ, Ott G, McDonald DM.2000.
on November 7, 2019 by guest
http://jvi.asm.org/
bution of DNA vaccines determines their immunogenicity after intramus-cular injection in mice. J Immunol165:2850 –2858.http://dx.doi.org/10 .4049/jimmunol.165.5.2850.
46. Roca H, Varsos ZS, Sud S, Craig MJ, Ying C, Pienta KJ.2009. CCL2 and interleukin-6 promote survival of human CD11b⫹peripheral blood mononuclear cells and induce M2-type macrophage polarization. J Biol Chem284:34342–34354.http://dx.doi.org/10.1074/jbc.M109.042671. 47. Shen A, Yang HC, Zhou Y, Chase AJ, Boyer JD, Zhang H, Margolick JB,
Zink MC, Clements JE, Siliciano RF.2007. Novel pathway for induction of latent virus from resting CD4(⫹) T cells in the simian immunodefi-ciency virus/macaque model of human immunodefiimmunodefi-ciency virus type 1 latency. J Virol81:1660 –1670.http://dx.doi.org/10.1128/JVI.01396-06. 48. Smith MZ, Asher TE, Venturi V, Davenport MP, Douek DC, Price DA,
Kent SJ.2008. Limited maintenance of vaccine-induced simian immuno-deficiency virus-specific CD8 T-cell receptor clonotypes after virus chal-lenge. J Virol82:7357–7368.http://dx.doi.org/10.1128/JVI.00607-08. 49. Miksa M, Komura H, Wu R, Shah KG, Wang P.2009. A novel method
to determine the engulfment of apoptotic cells by macrophages using pHrodo succinimidyl ester. J Immunol Methods342:71–77.http://dx.doi .org/10.1016/j.jim.2008.11.019.
50. Kilgore JA, Dolman NJ, Davidson MW.2013. A review of reagents for fluorescence microscopy of cellular compartments and structures. Part II. Reagents for non-vesicular organelles. Curr Protoc Cytom 66:Unit 12.31.
http://dx.doi.org/10.1002/0471142956.cy1231s66.
51. Gama L, Shirk EN, Russell JN, Carvalho KI, Li M, Queen SE, Kalil J, Zink MC, Clements JE, Kallas EG. 2012. Expansion of a subset of CD14highCD16negCCR2low/negmonocytes functionally similar to myeloid-derived suppressor cells during SIV and HIV infection. J Leukoc Biol
91:803– 816.http://dx.doi.org/10.1189/jlb.1111579.
52. Meulendyke KA, Pletnikov MV, Engle EL, Tarwater PM, Graham DR, Zink MC.2012. Early minocycline treatment prevents a decrease in stri-atal dopamine in an SIV model of HIV-associated neurological disease. J Neuroimmune Pharmacol7:454 – 464.http://dx.doi.org/10.1007/s11481 -011-9332-1.
53. Martinez FO, Gordon S, Locati M, Mantovani A.2006. Transcriptional profiling of the human monocyte-to-macrophage differentiation and po-larization: new molecules and patterns of gene expression. J Immunol
177:7303–7311.http://dx.doi.org/10.4049/jimmunol.177.10.7303. 54. Fernandez G, Zaikos TD, Khan SZ, Jacobi AM, Behlke MA, Zeichner
SL.2013. Targeting IkappaB proteins for HIV latency activation: the role of individual IkappaB and NF-kappaB proteins. J Virol87:3966 –3978.
http://dx.doi.org/10.1128/JVI.03251-12.
55. Gallastegui E, Marshall B, Vidal D, Sanchez-Duffhues G, Collado JA, Alvarez-Fernandez C, Luque N, Terme JM, Gatell JM, Sanchez-Palomino S, Munoz E, Mestres J, Verdin E, Jordan A.2012. Combina-tion of biological screening in a cellular model of viral latency and virtual screening identifies novel compounds that reactivate HIV-1. J Virol86:
3795–3808.http://dx.doi.org/10.1128/JVI.05972-11.
56. Stefano KA, Collman R, Kolson D, Hoxie J, Nathanson N, Gonzalezs-carano F.1993. Replication of a macrophage-tropic strain of human immunodeficiency virus type 1 (HIV-1) in a hybrid cell line, CEMx174, suggests that cellular accessory molecules are required for HIV-1 entry. J Virol67:6707– 6715.
57. Cassetta L, Cassol E, Poli G.2011. Macrophage polarization in health and disease. ScientificWorldJournal11:2391–2402.http://dx.doi.org/10.1100 /2011/213962.
58. Okabe Y, Medzhitov R.2014. Tissue-specific signals control reversible program of localization and functional polarization of macrophages. Cell
157:832– 844.http://dx.doi.org/10.1016/j.cell.2014.04.016.
59. Mantovani A, Sica A, Sozzani S, Allavena P, Vecchi A, Locati M.2004. The chemokine system in diverse forms of macrophage activation and polarization. Trends Immunol25:677– 686.http://dx.doi.org/10.1016/j.it .2004.09.015.
60. Mulder R, Banete A, Basta S.2014. Spleen-derived macrophages are readily polarized into classically activated (M1) or alternatively activated
(M2) states. Immunobiology 219:737–745. http://dx.doi.org/10.1016/j .imbio.2014.05.005.
61. Cassol E, Cassetta L, Alfano M, Poli G.2010. Macrophage polarization and HIV-1 infection. J Leukoc Biol 87:599 – 608. http://dx.doi.org/10 .1189/jlb.1009673.
62. Cai Y, Sugimoto C, Liu DX, Mid