Natural Single-Nucleotide Variations in the HIV-1 Genomic SA1prox
Region Can Alter Viral Replication Ability by Regulating Vif
Expression Levels
Masako Nomaguchi,aNaoya Doi,aYosuke Sakai,aHirotaka Ode,bYasumasa Iwatani,b Takamasa Ueno,c,dYui Matsumoto,a Yasuyuki Miyazaki,a*Takao Masuda,eAkio Adachia
Department of Microbiology, Institute of Biomedical Sciences, Tokushima University Graduate School, Tokushima, Tokushima, Japana; Clinical Research Center, Department of Infectious Diseases and Immunology, National Hospital Organization Nagoya Medical Center, Nagoya, Aichi, Japanb; Center for AIDS Research, Kumamoto University, Kumamoto, Kumamoto, Japanc; International Research Center of Medical Sciences, Kumamoto University, Kumamoto, Kumamoto, Japand; Department of Immunotherapeutics, Graduate School of Medicine and Dentistry, Tokyo Medical and Dental University, Tokyo, Japane
ABSTRACT
We previously found that natural single-nucleotide variations located within a proximal region of splicing acceptor 1 (SA1prox)
in the HIV-1 genome could alter the viral replication potential and mRNA expression pattern, especially the
vif
mRNA level.
Here, we studied the virological and molecular basis of nucleotide sequence variations in SA1prox for alterations of viral
replica-tion ability. Consistent with our previous findings, variant clones indeed expressed Vif at different levels and grew distinctively
in cells with various APOBEC3G expression levels. Similar effects were observed for natural variations found in HIV-2 SA1prox,
suggesting the importance of the SA1prox sequence. To define nucleotides critical for the regulation of HIV-1 Vif expression,
effects of natural SA1prox variations newly found in the HIV Sequence Compendium database on
vif
mRNA/Vif protein levels
were examined. Seven out of nine variations were found to produce Vif at lower, higher, or more excessive levels than wild-type
NL4-3. Combination experiments of variations giving distinct Vif levels suggested that the variations mutually affected
vif
tran-script production. While low and high producers of Vif grew in an APOBEC3G-dependent manner, excessive expressers always
showed an impeded growth phenotype due to defects in single-cycle infectivity and/or virion production levels. The phenotype
of excessive expressers was not due primarily to inadequate expression of Tat or Rev, although SA1prox variations altered the
overall HIV-1 mRNA expression pattern. Collectively, our results demonstrate that HIV SA1prox regulates Vif expression levels
and suggest a relationship between SA1prox and viral adaptation/evolution given that variations occurred naturally.
IMPORTANCE
While human cells possess restriction factors to inhibit HIV-1 replication, HIV-1 encodes antagonists to overcome these
barri-ers. Conflicts between host restriction factors and viral counterparts are critical driving forces behind mutual evolution. The
interplay of cellular APOBEC3G and viral Vif proteins is a typical example. Here, we demonstrate that naturally occurring
sin-gle-nucleotide variations in the proximal region of splicing acceptor 1 (SA1prox) of the HIV-1 genome frequently alter Vif
ex-pression levels, thereby modulating viral replication potential in cells with various ABOBEC3G levels. The results of the present
study reveal a previously unidentified and important way for HIV-1 to compete with APOBEC3G restriction by regulating its Vif
expression levels. We propose that SA1prox plays a regulatory role in Vif counteraction against APOBEC3G in order to
contrib-ute to HIV-1 replication and evolution, and this may be applicable to other primate lentiviruses.
F
ollowing its entry into target cells, human immunodeficiency
virus type 1 (HIV-1) encounters intrinsic resistance factors
that provide the first line of host defense in the suppression of
infection. HIV-1 encodes proteins to evade this restriction and
maintain efficient replication. Antagonism between host
restric-tion factors and viral counterparts drives them to coevolve under
mutual selective pressure (
1–4
). We previously performed HIV-1
adaptation experiments and showed that growth-enhancing
mu-tations were clustered in a narrow region of the C-terminal
do-main of Pol-integrase (IN) (
5
). Virological analysis of these
mu-tations and comparative analysis of HIV-1 sequences revealed that
naturally occurring single-nucleotide variations in a proximal
re-gion of splicing acceptor 1 (SA1prox) (
Fig. 1A
) modulated viral
replication ability. Furthermore, we found that these variations in
SA1prox affected HIV-1 mRNA expression patterns, especially its
vif
mRNA levels, thereby suggesting a role of this region in viral
gene expression (
6
).
HIV-1 gene expression (transcription, capping,
polyadenyla-tion, splicing, nuclear export, and translation) is a highly
con-trolled process. Since HIV-1 must produce several encoding
pro-teins from the single genome,
⬎
40 mRNA species with nine viral
genes are generated by alternative splicing, which utilizes four
Received20 November 2015Accepted15 February 2016
Accepted manuscript posted online24 February 2016
CitationNomaguchi M, Doi N, Sakai Y, Ode H, Iwatani Y, Ueno T, Matsumoto Y, Miyazaki Y, Masuda T, Adachi A. 2016. Natural single-nucleotide variations in the HIV-1 genomic SA1prox region can alter viral replication ability by regulating Vif expression levels. J Virol 90:4563– 4578.doi:10.1128/JVI.02939-15.
Editor:W. I. Sundquist
Address correspondence to Akio Adachi, [email protected].
*Present address: Yasuyuki Miyazaki, Department of Microbiology and Cell Biology, Tokyo Metropolitan Institute of Medical Science, Setagaya-ku, Tokyo, Japan.
Copyright © 2016, American Society for Microbiology. All Rights Reserved.
on November 7, 2019 by guest
http://jvi.asm.org/
different splicing donor sites (SD1 to SD4) and seven different
splicing acceptor sites (SA1 to SA7) in its genome (
Fig. 1A
) (
7–10
).
Modifications in splicing efficiency cause changes in the gene
ex-pression patterns of HIV-1 and have profound effects on viral
replication. Splicing regulation relies not only on the recognition
of splicing sites by the cellular splicing machinery but also on a
number of
cis
-regulatory elements located around the splicing
sites (
11
,
12
). Among various viral mRNAs,
vif
mRNA is known to
result from the splicing of HIV-1 full-length RNA between SD1
and SA1 (
Fig. 1B
and
C
). Previous studies reported that several
splicing regulatory elements are located around SA1 and that
mu-tations to modify splicing efficiency within these elements
influ-enced
vif
mRNA production and/or the expression pattern of
HIV-1 mRNA species (
13–15
). However, the regulation of
vif
mRNA production and splicing at SA1 is complex, and the
nucle-otide sequence/mutations that control
vif
mRNA expression levels
remain elusive.
HIV Vif (virion infectivity factor) is essential for viral
replica-tion in target cells, including CD4
⫹T cells and macrophages. Vif
counteracts the host restriction factor APOBEC3G (A3G) (
1–4
,
16
,
17
). In the absence of Vif, A3G is encapsidated into progeny
virions in producer cells. A3G exhibits cytidine deaminase activity
and induces a G-to-A hypermutation in the viral genome during
the reverse transcription process in target cells (
18–20
).
Deami-nase-independent inhibition of HIV-1 replication by A3G has also
been reported (
21–24
). The primary mechanism for Vif
antago-nism against A3G restriction is to induce the proteasomal
degra-dation of A3G. Vif works as an adaptor molecule that recruits A3G
to an E3 ligase complex and mediates A3G polyubiquitination and
subsequent proteasomal degradation (
25–29
). Therefore, evasion
of A3G restriction by Vif is critical for HIV-1 replication. The
power balance between Vif and A3G may be influenced by
changes in their functions and/or expression levels and thus affect
viral growth properties. Previous studies reported that elevated
A3G mRNA levels and A3G-induced hypermutation rates were
associated with the downregulation of plasma viral loads and
dis-ease progression in HIV-1-infected individuals (
30–34
).
How-ever, there have been debates on this issue (
35–38
). Moreover,
natural variations in Vif and A3G have been reported to affect
their functions (
39–42
). It remains unclear whether there are
nat-ural variations that alter
vif
mRNA levels in the HIV-1 genome.
In the present study, we focused on our previous finding that
natural variations in SA1prox altered viral replication potential by
affecting viral gene expression, especially
vif
mRNA expression
levels. In order to clarify the role of SA1prox in viral replication,
we attempted to identify new natural variations around SA1prox
(HIV-1
NL4-3nucleotides 4899 to 4943) in the HIV Sequence
Com-pendium and analyzed the effects of previously and newly found
variations on
vif
mRNA and Vif protein levels and virus growth
ability in cell lines expressing different levels of A3G. Our results
showed that nucleotide sequence variations in SA1prox affected
viral replication potential by regulating Vif expression levels
through altering overall gene expression. The frequent existence
of these natural variations in SA1prox within the HIV population
suggests that this region is linked to viral adaptation and/or
evo-lution.
MATERIALS AND METHODS
Proviral clones.The proviral clones pNL4-3 (43) and pGL-AN (44) were used as parental clones in the present study. Single-nucleotide variations in HIV-1 and HIV-2 strains were searched for by using HIV-1/simian immunodeficiency virus SIVcpz complete genomes and HIV-2/SIVsmm complete genomes, respectively, in the 2014 HIV Sequence Compendium (Los Alamos National Laboratory [see http://www.hiv.lanl.gov/]). Proviral clones carrying each natural single-nucleotide mutation were generated by using the QuikChange site-directed mutagenesis kit (Agilent Technologies Inc., Santa Clara, CA).
Cells.A reporter cell line, TZM-bl, carrying a luciferase gene driven by the viral long terminal repeat (LTR) (45,46) and a human embryonic kidney cell line, HEK 293T (47), were cultured in minimal essential me-dium (MEM) supplemented with 10% heat-inactivated fetal bovine se-rum (hiFBS). The human lymphocyte cell lines H9, CEM-SS, CEM, and M8166 were cultured in RPMI 1640 supplemented with 10% hiFBS. The human lymphocyte cell line MT4/CCR5 (MT4 stably expressing CCR5) was maintained in RPMI 1640 containing 10% hiFBS and 200g/ml of hygromycin B (Sigma-Aldrich Co., St. Louis, MO).
Analysis of viral growth kinetics.Virus stocks were prepared from HEK 293T cells transfected with proviral clones by the calcium phosphate coprecipitation method (43,48) or by using Lipofectamine 2000 (Life
FIG 1Schematic representation of the HIV-1 genome and various mRNAs. (A) Organization of the HIV-1NL4-3genome. Conserved splice donor sites (D1
to D5) and splice acceptor sites (A1 to A7) located within the HIV-1NL4-3
genome (43) (GenBank accession no.AF324493) are indicated (7–10). A6 and D5 have been reported not to be functional in the HIV-1NL4-3genome used in
[image:2.585.40.285.66.339.2]this study (14). The black area in the HIV-1 genome represents SA1prox (HIV-1 NL4-3 nucleotides 4899 to 4943), as indicated. (B) Exons that form spliced HIV-1 mRNAs. Exons forvprandtatmRNAs are indicated by boxes (exons 1, 2, 3, 4, 7, 3a, and 3E). Green, orange, and blue boxes represent noncoding exons 1, 2, and 3, respectively. (C) HIV-1 mRNAs. Unspliced (9-kb), incompletely spliced (4-(9-kb), and completely spliced (2-kb) forms of HIV-1 mRNAs are shown. Gray boxes represent avifprobe (6) used for the Northern blot analysis. The amplified regions of thegag/poltranscript (NL-9 kb), theviftranscript (NL-vif), 2-kb transcripts (NL-2 kb), and all HIV-1 transcripts (NL-U) analyzed by qRT-PCR are indicated. The positions of primers used for the semiquantitative RT-PCR analysis ofvprmRNA species,
vpu-envmRNA species, 2-kb mRNA species, and all HIV-1 mRNAs (exon 7) are shown by light blue, green, purple, and red letters/arrows/bars, respec-tively. Orange and blue boxes indicate noncoding exons 2 and 3, respecrespec-tively. Numbers in brackets represent exon contents ofvprandtatmRNA species.
on November 7, 2019 by guest
http://jvi.asm.org/
Technologies Corporation, Carlsbad, CA). Virion-associated reverse transcriptase (RT) activity was measured as previously described (49,50). Equal RT units were inoculated into H9, CEM-SS, and CEM cells for the analysis of HIV-1NL4-3, HIV-2GL-AN, and their variant clones. Virus
rep-lication was monitored by the activity of RT released into the culture supernatants.
Western blot analysis.The expression levels of viral and cellular A3G proteins were determined as described previously (6). Briefly, HEK 293T cells were cotransfected with proviral clones (3.5g) and the pGL3 lucif-erase reporter vector (0.5g) (Promega Corporation, Madison, WI) by using Lipofectamine 2000 (Life Technologies Corporation). On day 1 posttransfection, cells were lysed in 1⫻TNE buffer (50 mM Tris-HCl [pH 8.0], 1% Nonidet P-40, 150 mM NaCl, 1 mM EDTA [pH 8.0], and 1% protease inhibitor cocktail [Sigma-Aldrich Co.]), and equal amounts of protein in cell lysates were subjected to sodium dodecyl sulfate-polyacryl-amide gel electrophoresis. Immunoblot analysis was performed by using anti-HIV-1 HXB2 Vif (catalog no. 2221; NIH Research and References Reagent Program), anti-HIV-1 Gag-p24 (183-H12-5C) (catalog no. 3537; NIH Research and References Reagent Program), anti-HIV-1 gp160 (ADP409; Immuno Ltd./MRC AIDS Directed Programme Reagent Proj-ect), anti-Rev (ab25871; Abcam, Cambridge, England), anti-HIV-1 Nef (Advanced Biotechnologies Inc., Columbia, MD), anti-HIV-1 Vpr (cata-log no. 3951; NIH Research and References Reagent Program), and
anti--actin clone AC-15 (Sigma-Aldrich Co.) antibodies. In order to deter-mine the expression levels of A3G in cell lines, equal protein amounts (5
g) of cell lysates prepared in 1⫻TNE buffer were analyzed as described above, using anti-APOBEC3G antibody (catalog no. 9968; NIH Research and References Reagent Program) and anti-␣-tubulin polyclonal anti-body (pAb) (code no. PM054; Medical & Biological Laboratories Co. Ltd., Nagoya, Japan).
qRT-PCR analysis of viral transcripts.For construction of plasmid DNAs as standards for quantitative real-time reverse transcription-PCR (qRT-PCR) analysis, HIV-1NL4-3 vif and nef and HIV-2GL-AN vif
se-quences were amplified by PCR using cDNAs from HEK 293T cells trans-fected with pNL4-3 and pGL-AN, respectively. Amplified products were cloned into the pGEM-T Easy vector (Promega Corporation) to generate pNL-vif⫹T, pNL-2kb⫹T carrying the nefgene, and pGL-vif⫹T. The glyceraldehyde-3-phosphate dehydrogenase (GAPDH) sequence ampli-fied by PCR using cDNA from HEK 293T cells was cloned into the pGEM-T Easy vector (Promega Corporation) to obtain pGAPDH⫹T. For qRT-PCR analysis, HEK 293T cells were transfected with proviral clones (2.5g for pNL4-3 and its variants and 3.5g for pGL-AN and its vari-ants), and total RNA was extracted at 20 h posttransfection by using the RNeasy Plus minikit (Qiagen GmbH, Hilden, Germany). RNA samples were then treated with DNase I and subjected to qRT-PCR analysis by using the QuantiTect Probe RT-PCR kit (Qiagen GmbH), using the Ap-plied Biosystems 7500 real-time PCR system (Life Technologies Corpo-ration). The primer pairs and dually labeled probes carrying 5= 6-carboxy-fluorescein (FAM) and 3= 6-carboxytetramethylrhodamine (TAMRA) used for qRT-PCR analysis were as follows: P1 (forward primer), P2 (re-verse primer) (51), and NL-9kb-P (probe) (ACAACAACTCCCTCTCAG AAGCA) (NL-9kb inFig. 1C) for the HIV-1NL4-3 gag/poltranscript;
D1-A1 (forward primer), Vif body (reverse primer) (13), andvifmRNA specific-P (probe) (CCCTTCACCTTTCCAGAGGAGCTTTGCT) (NL-vif inFig. 1C) for the HIV-1NL4-3viftranscript; NL-D4A7-5 (forward
primer) (CTCTATCAAAGCAACCCACCTCCC), NL8496-3 (reverse primer) (CGCAGATCGTCCCAGATAAGTG), and NL-2k-P (probe) (T CTGTCTCTGTCTCTCTCTCCACCT) (NL-2kb in Fig. 1C) for 2-kb transcripts; NL-U-F (forward primer) (CATGGAGCAATCACAAGTA GCAA), NL-U-R (reverse primer) (CTGGAAAACCCACCTCTTCC TC), and NL-U-P (probe) (AGCTAACAATGCTGCTTGTGCCTGGCT) (NL-U inFig. 1C) for all HIV-1NL4-3transcripts; GL-vif D1A1-re (forward
primer) (CTCCGGGTGAAGGTCTATTACAGAG), GL-vif body (reverse primer) (CCAGGTGGGAACTACTATCCAG), and GL-vifmRNA-P (probe) (TCTTGCCTTCCTCCATAGTCT) for the HIV-2GL-ANvif
tran-script; and Hs_GAPDH-F (forward primer) (TCCTCTGACTTCAACAG CGAC), Hs_GAPDH-R (reverse primer) (CCAAATTCGTTGTCATACC AGGA), and Hs_GAPDH-P (probe) (TCCTCCACCTTTGACGCTGG GGC) for the GAPDH transcript. As standards, 103to 107copies of
linearized pNL4-3, pNL-vif⫹T, pNL-2kb⫹T, pGL-vif⫹T, and pGAPDH⫹T were amplified in parallel with experimental samples for the HIV-1NL4-3gag/poltranscript and all viral transcripts, including the
HIV-1NL4-3vif transcript, HIV-1NL4-3 2-kb transcripts, the HIV-2GL-ANvif
transcript, and the GAPDH transcript, respectively. The expression levels of total viral transcripts in transfected HEK 293T cells were found to be similar among the viral clones tested here and were used for normaliza-tion of the transfecnormaliza-tion efficiency.
Northern blot analysis.Northern blot analysis was performed to de-terminevifmRNA expression levels as previously described (6). Briefly, HEK 293T cells were transfected with proviral clones (2.5g), and total RNA was extracted at 20 h posttransfection by using the RNeasy Plus minikit (Qiagen GmbH). Poly(A)⫹RNA was isolated with the Oligotex-dT30 Super mRNA purification kit (TaKaRa Bio Inc., Otsu, Japan) and then treated with DNase I. Samples were subjected to glyoxal-denatured 1% agarose gel electrophoresis and blotted onto a positively charged ny-lon membrane.vifandGAPDHmRNAs were detected by probes labeled with the PCR digoxigenin (DIG) probe synthesis kit (Fig. 1C) (Roche Diagnostics GmbH, Mannheim, Germany) and visualized with DIG High Prime DNA labeling and detection starter kit II (Roche Diagnostics GmbH).
Analysis of single-cycle infectivity.Viruses were prepared from HEK 293T cells transfected with proviral clones by the calcium phosphate co-precipitation method (43,48) or by using Lipofectamine 2000 (Life Tech-nologies Corporation). The virus amount was measured by RT assays as described above, and equal numbers of RT units (2⫻103or 1⫻104RT units) were inoculated into TZM-bl cells (4⫻103cells). On day 1
postin-fection, cell lysates were prepared with 1⫻cell culture lysis reagent (Pro-mega Corporation) for luciferase assays (Pro(Pro-mega Corporation).
Analysis of virion production.H9 cells (106) were cotransfected with
proviral clones (2g) and the pGL3 luciferase reporter vector (Promega Corporation) (2g) by using Amaxa Cell Line Nucleofector kit V (Lonza Ltd., Basel, Switzerland), using Nucleofector II (Lonza Ltd.). The CXCR4 antagonist AMD3100 (0.5M) was added to the cultures throughout the experiment. Culture supernatants and cells collected on day 2 posttrans-fection were examined for virion production and luciferase activity, re-spectively. Virion production was monitored by using the HIV-1 p24 antigen enzyme-linked immunosorbent assay (ELISA) kit (ZeptoMetrix Corporation, Buffalo, NY). Cell lysates were prepared with 1⫻cell culture lysis reagent (Promega Corporation) for luciferase assays (Promega Cor-poration). Luciferase activity in cell lysates was used to normalize trans-fection efficiency.
Analysis of HIV-1 gene expression.For semiquantitative RT-PCR analysis, total RNA was prepared from HEK 293T cells transfected with proviral clones as described above. After DNase I treatment, samples were reverse transcribed by using the SuperScript III first-strand synthesis sys-tem (Life Technologies Corporation). To gain PCR products amplified within a linear range, conditions for semiquantitative RT-PCR were de-termined similarly as described previously (51). The primer pairs used for semiquantitative RT-PCR analysis were as follows (Fig. 1C): NL639-5 (forward) (GCGCCCGAACAGGGACTTGAA) and NL8496-3 (reverse) for the 2-kb mRNA species, NL639-5 (forward) and P6 (reverse) (51) for thevpu-envmRNAs, NL639-5 (forward) and NL5622-3 (reverse) (GCTC TAGTGTCCATTCATTG) for thevprmRNAs, NL8686-5 (forward) (AG GGGACAGATAGGGTTATAG) and NL8878-3 (reverse) (TAGGTCTCG AGATACTGCTC) for all HIV-1NL4-3mRNAs (exon 7 inFig. 1C), and
GAPDH-S (forward) (CGAGATCCCTCCAAAATCAA) and GAPDH-AS (reverse) (GTCTTCTGGGTGGCAGTGAT) for the GAPDH mRNA. PCR amplicons were separated on a 2% Metaphor agarose (Lonza Ltd.) gel in 0.5⫻Tris-borate-EDTA buffer by using the Mupid exU submarine electrophoresis system (Advance Co. Ltd., Tokyo, Japan) and stained with
on November 7, 2019 by guest
http://jvi.asm.org/
ethidium bromide. The Amersham Imager 600 instrument (GE Health-care UK Ltd., Buckinghamshire, England) was used to visualize PCR products and to quantify signal intensities of the products. For qRT-PCR analysis, samples used for semiquantitative RT-PCR analysis were sub-jected to qRT-PCR analysis by using the QuantiTect Probe PCR kit (Qiagen GmbH), using the primer pairs for qRT-PCR analysis of viral transcripts described above. Tattrans-activation assays were performed as described previously (6). Briefly, Proviral clones and an LTR-driven lu-ciferase reporter clone, 5RLTR-Luc (6), were cotransfected into HEK 293T cells with Lipofectamine 2000 (Life Technologies Corporation). Cells were lysed on day 1 posttransfection and subjected to luciferase assays (Promega Corporation).
RNA secondary structure prediction.The mfold program, version 4.6 (52), was used to predict secondary RNA structure formed by the 46-nucle-otide sequence (at HIV-1 NL4-3 nucle46-nucle-otides 4899 to 4943) of HIV-1NL4-3and
its variants. When multiple structures were predicted from each sequence, the structure with the lowest energy (⌬G) was selected.
RESULTS
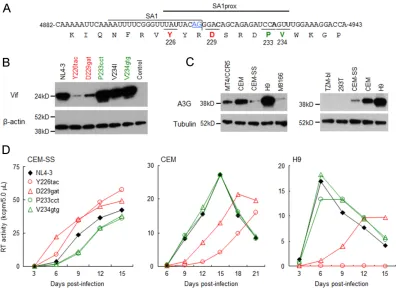
Natural single-nucleotide variations in SA1prox (Y226tac,
D229gat, P233cct, and V234gtg) alter viral replication ability in an
A3G-dependent manner by changing Vif expression levels.
Our
previously reported adaptation experiments using prototype
ma-caque cell-tropic HIV-1s and mama-caque cell lines revealed that
vi-ruses frequently and reproducibly acquired growth-enhancing
mutations in the C-terminal domain of Pol-IN (
5
). Subsequent
virological studies of these mutations showed that in human
lym-phocyte cell lines, growth phenotypes of not only prototype
ma-caque cell-tropic HIV-1s but also human cell-tropic HIV-1
(NL4-3 clone) were markedly altered by the introduction of
nat-urally occurring single-nucleotide variations (Y226tac, D229gat,
P233cct, and V234gtg) into SA1prox (
Fig. 2A
) (
6
). Since the
com-mon and unique characteristics of these variants relative to the
parental clones were their altered
vif
mRNA levels (
6
), we
deter-mined the expression levels of the Vif protein for each NL4-3
derivative. The parental NL4-3 clone and its variants carrying
Y226tac, D229gat, P233cct, V234I, or V234gtg were transfected
into HEK 293T cells, and cell lysates were prepared on day 1
post-transfection for Western blot analysis. Clone V234I, carrying a
slightly growth-enhancing mutation (
6
), was used as a control. As
clearly observed in
Fig. 2B
, Vif expression levels for Y226tac and
D229gat were remarkably reduced, whereas those for P233cct and
V234gtg were higher than the NL4-3 Vif level.
We then investigated the effects of different Vif expression
lev-FIG 2Effects of natural single-nucleotide variations within SA1prox on Vif protein expression levels and viral replication ability in various cell lines. Red and green letters/symbols/lines represent low and high expressers of the Vif protein, respectively. (A) Nucleotide and amino acid sequences in the region around SA1. NL4-3 sequences (nucleotides 4882 to 4943 and Pol-IN amino acids 219 to 238) are shown. SA1 (7–10) and SA1prox (6) are indicated. The AG dinucleotide of the Vif splice site is highlighted by blue letters/underlining. Letters in boldface type in the sequences represent the sites at which natural variations that alter virus replication ability (6) are located. (B) Vif expression levels in transfected cells. The proviral clones indicated were transfected into HEK 293T cells, and cell lysates were prepared on day 1 posttransfection for Western blot analysis using anti-Vif and anti--actin antibodies. The migration positions of mass standards are on the left. Representative data from three independent experiments are shown. Control, pUC19. (C) A3G expression levels in various cell lines. Cell lysates were prepared from the indicated cell lines and subjected to the Western blot analysis using anti-A3G and anti-tubulin antibodies. The migration positions of mass standards are on the left. Representative data from two independent experiments are shown. (D) Viral replication kinetics in various cell lines. Viruses were prepared from HEK 293T cells transfected with the proviral clones indicated and inoculated into CEM-SS, CEM, and H9 cells. Infection conditions were as follows: 104RT units/105CEM-SS cells and H9 cells and 103RT units/105CEM cells. Virus replication was monitored by the activity of RT released into the
culture supernatants. Representative data from at least two independent experiments are shown.
on November 7, 2019 by guest
http://jvi.asm.org/
[image:4.585.94.490.65.353.2]els for these variants on antagonistic activity against A3G in
mul-ticycle viral replication. We first determined A3G expression levels
in permissive (Vif-independent) and nonpermissive
(Vif-depen-dent) cell lines (
Fig. 2C
). Consistent with previously reported
findings (
13–15
,
20
), the expression levels of A3G were low in
permissive T-cell lines (CEM-SS, M8166, and MT4/CCR5) but
high in nonpermissive T-cell lines (CEM and H9). H9 cells, which
have been reported to express A3G at levels similar to those of
peripheral blood mononuclear cells (
53
), showed the highest
lev-els among these cell lines. We also confirmed that A3G expression
was undetectable in HEK 293T and HeLa-derived TZM-bl cell
lines (
Fig. 2C
) (
20
).
We then monitored the viral replication abilities of NL4-3 and
its variant clones (Y226tac, D229gat, P233cct, and V234gtg) in cell
lines expressing different levels of A3G (
Fig. 2D
). While the
low-Vif producers Y226tac and D229gat grew better than NL4-3 in
permissive CEM-SS cells, the replication abilities of P233cct and
V234gtg with high expression levels of Vif were lower than that of
NL4-3. In contrast, Y226tac and D229gat replicated very poorly in
nonpermissive CEM and H9 cells, whereas P233cct and V234gtg
exhibited growth potentials similar to that of NL4-3. These results
show that the four natural variations in SA1prox increase or
de-crease Vif expression levels, thereby altering viral replication
ki-netics in an A3G-dependent manner.
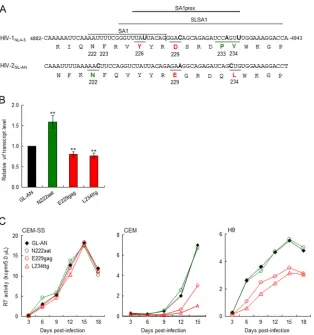
Natural variations in HIV-2 SA1prox also affect viral
growth potential by modulating
vif
transcript levels.
A
previ-ous study reported that the nucleotide sequence around SA1
within the HIV-1 genome forms a stem-loop structure,
desig-nated SLSA1, and also that the SLSA1 structure is conserved
between HIV-1
NL4-3and SIVmac239 (
54
). Natural variations in
SA1prox that change Vif expression levels and viral growth
poten-tial were clustered within SLSA1 (
Fig. 3A
) (
6
). Since nucleotide
sequences around SA1 and the genome organization of HIV-2 are
similar to those of SIVmac239, we assumed that natural variations
in HIV-2 SA1prox, like those in HIV-1 SA1prox, can affect
vif
expression levels/viral replication ability due to the conserved
fea-tures of nucleotide sequences and SLSA1 strucfea-tures. Using the
HIV-2/SIVsmm complete genomes in the 2014 HIV Sequence
FIG 3Effects of natural single-nucleotide variations in HIV-2 SA1prox onviftranscript levels and viral replication ability. Red and green represent low and high expressers of theviftranscript, respectively. (A) Sequences of HIV-1NL4-3(nucleotides 4882 to 4943 and Pol-IN amino acids 219 to 238) and of the corresponding
region of HIV-2GL-AN. SA1 (7–10), SLSA1 (54), and SA1prox (6) in the NL4-3 sequences are shown. Letters in boldface type in the sequences represent the sites
at which natural variations that alter virus replication ability (NL4-3 [6] and GL-AN [this study]) are located. (B)viftranscript levels for GL-AN and its natural variants. The proviral clones indicated were transfected into HEK 293T cells, and at 20 h posttransfection, total RNAs were prepared for qRT-PCR analysis using a primer pair specific for the GL-ANviftranscript.viftranscript levels relative to those of GL-AN are presented. Mean values⫾standard deviations from three independent experiments are shown. Significance relative to GL-AN was determined by the Studentttest (**,P⬍0.05). (C) Viral growth kinetics of GL-AN and its natural variants in CEM-SS, CEM, and H9 cells. Viruses were prepared from transfected HEK 293T cells, and 105cells were infected with viruses (2⫻105RT
units for CEM-SS and CEM cells and 5⫻104RT units for H9 cells). Virus replication was monitored by the activity of RT released into the culture supernatants.
Representative data from at least two independent experiments are shown.
on November 7, 2019 by guest
http://jvi.asm.org/
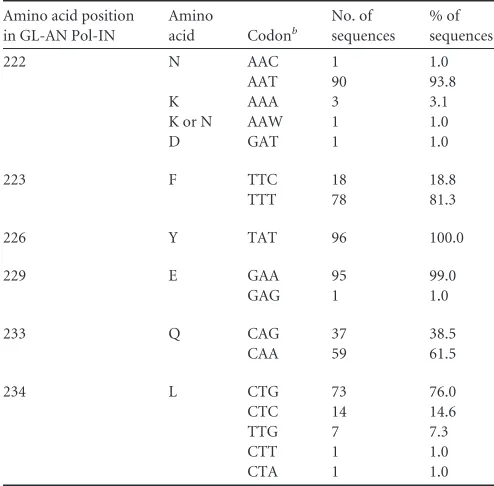
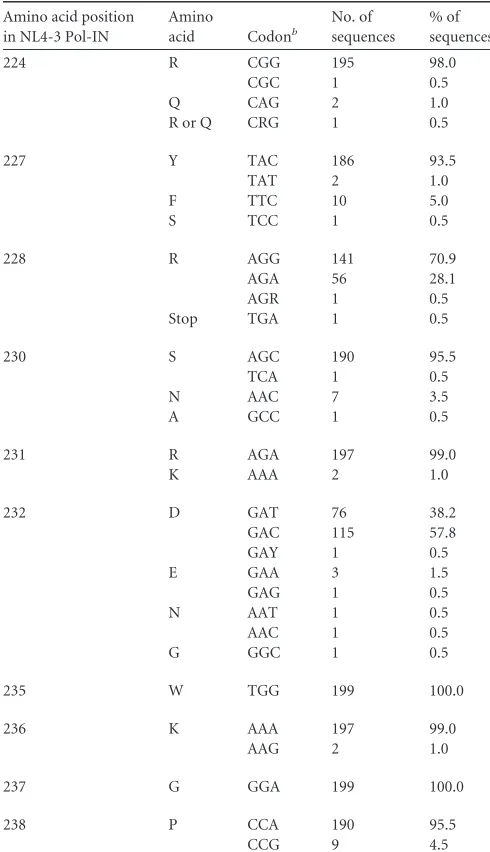
[image:5.585.137.451.63.398.2]Compendium (96 strains), we searched for natural variations in
the HIV-2 genome (amino acid positions N222, F223, Y226, E229,
Q233, and L234 in HIV-2
GL-ANPol-IN) (
Fig. 3A
), corresponding
to the HIV-1 genomic region in which growth-altering natural
variations were identified (
6
). As shown in
Table 1
, natural
varia-tions within HIV-2
GL-ANSA1prox were readily found in these
sites, except for the Y226 site in HIV-2
GL-ANPol-IN. Based on
codon frequency differences in GL-AN and natural variants
within the HIV-2/SIVsmm population, we selected N222aat,
E229gag, and L234ttg for further analyses and constructed
provi-ral clones carrying each variation. In order to evaluate the effects
of these variations on
vif
transcript levels, parental GL-AN and its
variant (N222aat, E229gag, and L234ttg) clones were transfected
into HEK 293T cells, and DNase I-treated total RNA samples
pre-pared at 20 h posttransfection were examined by qRT-PCR
anal-ysis. As shown in
Fig. 3B
, the
vif
transcript level for N222aat was
higher than that for GL-AN (1.58-fold on average), but E229gag
and L234ttg had lower
vif
transcript levels than did GL-AN
(0.80-and 0.76-fold on average, respectively). Expression of the
HIV-2
GL-ANVif protein could not be examined due to the unavailability
of the antibody. We next compared the viral replication abilities of
GL-AN and its variants in permissive CEM-SS cells and
nonper-missive CEM and H9 cells (
Fig. 3C
). While all viral clones grew
comparably well in CEM-SS cells, E229gag and L234ttg showed
reduced growth potentials compared to that of GL-AN in CEM
and H9 cells, despite a slight difference in
vif
transcript levels
be-tween GL-AN and E229gag/L234ttg. For HIV-2
GL-AN, the
thresh-old of the Vif expression level required for optimal viral
replica-tion under A3G restricreplica-tion may be in a narrow range. These results
show that natural variations in HIV-2 SA1prox as well as those in
HIV-1 SA1prox affect the
vif
transcript level and viral replication
ability.
vif
transcript levels are highly divergent among natural
vari-ants found in the extended SA1prox.
Natural variations
(Y226tac, D229gat, P233cct, and V234gtg) that alter the Vif
ex-pression level and viral replication ability were scattered within
the SLSA1 region (
Fig. 2
and
4A
). Furthermore, the introduction
of artificial mutations into the known splicing regulatory elements
close to SA1 (
Fig. 4A
) affected the expression pattern of
vif
mRNAs (
13–15
). Thus, we predicted that more natural variations
around SA1prox (extended SA1prox in
Fig. 4A
) may alter Vif
expression levels and viral replication potentials and searched for
such mutations in the HIV-1/SIVcpz complete genomes in the
2014 HIV Sequence Compendium (199 strains). Of the 10 new
sites examined (R224, Y227, R228, S230, R231, D232, W235,
K236, G237, and P238) (
Fig. 4A
and
Table 2
), 8 (R224, Y227,
R228, S230, R231, D232, K236, and P238) (
Table 2
) were found to
have nucleotide variations. Based on higher codon frequencies
at each site, seven variations (Y227Fttc, R228aga, S230Naac,
R231Kaaa, D232gac, K236aag, and P238ccg) (
Table 2
) were
se-lected for further analyses. The synonymous variation R224cgc
was chosen for the R224 site, and D232Egag was chosen as a
sec-ond variation for the D232 site (
Table 2
). In total, nine natural
variations were selected from the extended SA1prox for functional
studies. In addition, two single-nucleotide natural variations
found in the G
I2-1 element (
55
) (R269Kaag and R269aga) were
selected for further study.
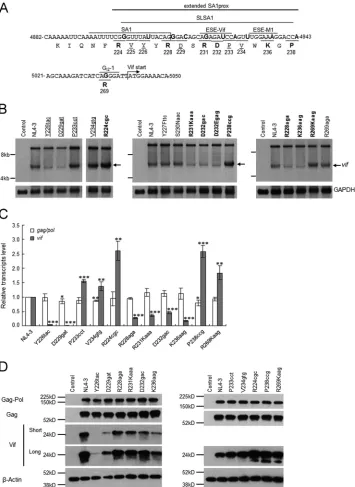
In order to identify new natural variations that alter
vif
mRNA
production in SA1prox and the G
I2-1 element, we first carried out
Northern blot analysis. Although this analysis is rather qualitative,
it is suitable for the initial screening of variations that have a
rela-tively large effect on
vif
mRNA production. Eleven proviral clones
carrying each new variation described above were constructed and
transfected into HEK 293T cells in parallel with parental pNL4-3
and the other natural variants (Y226tac, D229gat, P233cct, and
V234gtg) (
Fig. 2
) (
6
). Poly(A)-selected total RNA was prepared at
20 h posttransfection and examined by Northern blotting using
the
vif
probe (
Fig. 1C
). As shown in
Fig. 4B
, consistent with the
expression of Vif (
Fig. 2B
), Y226tac/D229gat and P233cct/
V234gtg generated decreased and increased
vif
mRNA levels,
re-spectively, relative to NL4-3. Of the new natural variants, while
Y227Fttc, S230Naac, and R269aga produced levels of
vif
mRNA
similar to that of NL4-3, clones that expressed higher (R224cgc,
P238ccg, and R269Kaag) or lower (R228aga, R231Kaaa, D232gac,
D232Egag, and K236aag,)
vif
mRNA levels than that of NL4-3
were readily identified. Notably, R224cgc and P238ccg appeared
to express a markedly higher level of
vif
mRNA than NL4-3. These
results show that natural variations within the extended SA1prox
and in the G
I2-1 element frequently affect
vif
mRNA levels.
To confirm the results of Northern blot analysis, we
quantita-tively compared the effects of natural variations in the SA1prox
and G
I2-1 element on
vif
transcript expression. Since splicing
ef-ficiency at SA1 has been shown to influence
gag/pol
(9 kb) mRNA
production (
Fig. 1
) (
13
,
15
), its expression level was also
quanti-tatively analyzed. NL4-3 and its variants (R224cgc, Y226tac,
R228aga, D229gat, R231Kaaa, D232gac, P233cct, V234gtg,
K236aag, P238ccg, and R269Kaag) were transfected into HEK
293T cells, and DNase I-treated total RNA preparations at 20 h
posttransfection were subjected to qRT-PCR analysis. As shown in
[image:6.585.39.286.77.320.2]Fig. 4C
, the
gag/pol
transcript level for most natural variants tested
TABLE 1Codon frequencies in SA1prox of HIV-2/SIVsmma
Amino acid position in GL-AN Pol-IN
Amino
acid Codonb
No. of sequences
% of sequences
222 N AAC 1 1.0
AAT 90 93.8
K AAA 3 3.1
K or N AAW 1 1.0
D GAT 1 1.0
223 F TTC 18 18.8
TTT 78 81.3
226 Y TAT 96 100.0
229 E GAA 95 99.0
GAG 1 1.0
233 Q CAG 37 38.5
CAA 59 61.5
234 L CTG 73 76.0
CTC 14 14.6 TTG 7 7.3 CTT 1 1.0 CTA 1 1.0
a
Data are from 96 sequences of HIV-2/SIVsmm complete genomes in the 2014 HIV Sequence Compendium (Los Alamos National Laboratory [seehttp://www.hiv.lanl .gov/]). The amino acid and codon of GL-AN are shown at the top line for each amino acid position.
b
W is A or T.
on November 7, 2019 by guest
http://jvi.asm.org/
FIG 4Identification of new single-nucleotide variations in the extended SA1prox that affectvifmRNA and Vif expression levels. (A) Nucleotide and amino acid sequences in the regions around the SA1 and Vif start sites. NL4-3 sequences (nucleotides 4882 to 4943 and 5021 to 5050 and Pol-IN amino acids 219 to 238 and 269) are shown. The extended SA1prox (NL4-3 nucleotides 4899 to 4943), SA1 (7–10); SLSA1 (54); and three known splicing regulatory elements, ESE-Vif (13, 15), ESE-M1 (14), and GI2-1 (55), are indicated. Letters in boldface type in the sequences represent the sites at which natural variations that affectvifmRNA levels
are located. The sites analyzed inFig. 2and previously (6) are indicated by underlined amino acids. (B) Identification of natural variations that affectvifmRNA levels. The proviral clones indicated were transfected into HEK 293T cells, and at 20 h posttransfection, poly(A)-selected total RNAs were prepared. After the DNase I treatment, samples were subjected to Northern blot analysis using avifprobe (Fig. 1). GAPDH was used as an internal control. RNA size markers are on the left. The position of thevifmRNA is indicated by arrows. Proviral clones that were analyzed for Vif protein expression levels inFig. 2are underlined. Letters in boldface type indicate newly identified natural variants expressingvifmRNA at a lower or higher level than that of NL4-3. Control, pUC19. The left panel was separated to remove an unnecessary lane. (C) Expression levels ofgag/polandviftranscripts. Total RNA was prepared from HEK 293T cells transfected with the proviral clones indicated and treated with DNase I. Samples were then subjected to qRT-PCR analysis using primer pairs specific forgag/pol(NL-9kb inFig. 1) andvif(NL-vif inFig. 1) transcripts. The expression levels of all HIV-1 transcripts (NL-U inFig. 1) and GAPDH were analyzed by qRT-PCR in parallel for transfection and internal controls, respectively. The expression levels ofgag/polandviftranscripts in each sample were normalized by those of all HIV-1 transcripts and GAPDH.gag/polandviftranscript levels relative to those of NL4-3 are presented. Mean values⫾standard deviations from three independent experiments are shown. Significance relative to NL4-3 was determined by the Studentttest (***,P⬍0.01; **,P⬍0.05; *,P⬍0.1). (D) Expression levels of viral proteins. The proviral clones indicated were transfected into HEK 293T cells, and cell lysates were prepared on day 1 posttransfection for Western blot analysis using anti-p24, anti-Vif, and anti--actin antibodies. The migration positions of mass standards are on the left. Representative data from three independent experiments are shown. Control, pUC19; Short, short exposure; Long, long exposure.
on November 7, 2019 by guest
http://jvi.asm.org/
[image:7.585.115.470.66.553.2]was similar to that for NL4-3. In contrast, the
vif
transcript level
was always markedly different from that of NL4-3. Moreover,
vif
transcript levels remarkably varied among natural variants: with
reduced levels for R228aga, R231Kaaa, D232gag, and K236aag;
markedly reduced levels for Y226tac and D229gat; increased levels
for R224cgc, P233cct, V234gtg, P238ccg, and R269Kaag; and
markedly increased levels for R224cgc and P238ccg. Consistent
with the
vif
and
gag/pol
transcript levels, these variants expressed
their Vif proteins at different levels in transfected HEK 293T cells
but exhibited similar expression levels of Gag and Gag-Pol
pro-teins (
Fig. 4D
). On the basis of these results, natural variants were
categorized into low-
vif
(Y226tac, R228aga, D229gat, R231Kaaa,
D232gac, and K236aag), high-
vif
(P233cct, V234gtg, and
R269Kaag), and excessive-
vif
(R224cgc and P238ccg) types. All of
the natural variations tested here had more profound effects on
vif
transcript levels than on
gag/pol
transcript levels, and each
varia-tion had different impacts on
vif
transcript expression.
Naturally occurring combinations of some variations appear
to exhibit an additive effect on
vif
transcript production.
In the
comparative investigation of HIV-1/SIVcpz sequences described
above, we noted several HIV-1 strains carrying two or three variations
(in combinations of R228aga, P233cct/ccc, R269Kaag, and/or
P238ccg), which have different effects on
vif
transcript production
(
Fig. 4C
and
Table 3
). We previously reported that P233cct and
P233ccc exhibited similar growth phenotypes in permissive
MT4/CCR5 cells (
6
). In order to examine how naturally
occur-ring double or triple variations in the genome influence
vif
transcript levels, we constructed proviral clones carrying
multiple variations (R228aga
⫹
P233cct, P233ccc
⫹
R269Kaag,
R228aga
⫹
P233cct
⫹
R269Kaag, and R228aga
⫹
P233cct
⫹
P238ccg)
found in the HIV-1/SIVcpz sequences. NL4-3 and proviral clones
carrying natural combinations of the variations were transfected
into HEK 293T cells, and DNase I-treated total RNA samples
pre-pared at 20 h posttransfection were subjected to qRT-PCR
analy-sis. As shown in
Fig. 5A
, the
gag/pol
transcript levels of NL4-3 and
its natural combination variants were similar but slightly reduced
for P233ccc
⫹
R269Kaag, R228aga
⫹
P233cct
⫹
R269Kaag, and
R228aga
⫹
P233cct
⫹
P238ccg. While R228aga
⫹
P233cct
⫹
R269Kaag
expressed a level of the
vif
transcript similar to that expressed
by NL4-3,
vif
transcript levels for R228aga
⫹
P233cct and for
P233ccc
⫹
R269Kaag/R228aga
⫹
P233cct
⫹
P238ccg were lower
and higher, respectively, than that for NL4-3. As summarized in
Fig. 5B
, the results obtained by qRT-PCR analysis in
Fig. 4C
and
5A
revealed that the effects of these natural variations on
vif
tran-script levels appeared to be additive. A previous study suggested
that several splicing regulatory elements around SA1 act
compet-itively on the regulation of the
vif
mRNA expression level (
13
).
Thus, the
vif
production level determined by combinations of
variations may be complicatedly regulated by the relative strength
of splicing regulatory sites around SA1.
There are some natural variations and their combinatorial
variants that alter the
vif
transcript level in specific HIV-1
sub-types. For example, P238ccg, R228aga, P233ccc, P233cct, and/or
their combinations are found mainly in some specific groups or
subtypes. Since Vif proteins of different HIV-1 subtypes were
pre-viously shown to display different anti-A3G activities (
56
), it will
be interesting to determine whether there is a relationship
be-tween Vif expression levels determined by the SA1prox nucleotide
sequence and Vif function.
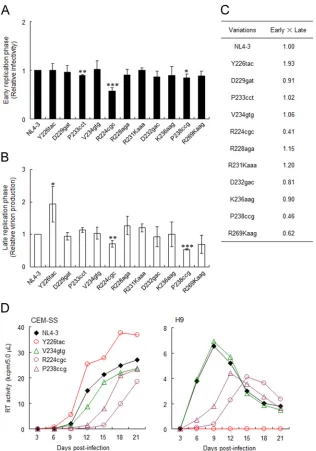
Excessive
vif
type variants (R224cgc and P238ccg) exhibit
A3G-independent and decreased replication ability due to
re-duced virion infectivity/production.
Increases in
vif
mRNA/pro-tein expression levels were previously shown to adversely affect
viral infectivity and virion production (
13
,
57
,
58
). Therefore, we
examined the effects of natural variations in the extended SA1prox
on early and late viral replication phases. Viral infectivity at the
early phase was monitored by using TZM-bl cells with
undetect-able A3G expression (
Fig. 2C
). TZM-bl is frequently and widely
used as a standard reporter cell line to determine viral infectivity
by measuring Tat-driven luciferase expression from an LTR
re-porter gene. Luciferase activity in TZM-bl cells has been shown to
correlate well with infectious virion units (
45
,
46
,
59–61
).
Vi-TABLE 2Codon frequencies in the extended SA1prox of HIV-1/SIVcpza
Amino acid position in NL4-3 Pol-IN
Amino
acid Codonb
No. of sequences
% of sequences
224 R CGG 195 98.0
CGC 1 0.5
Q CAG 2 1.0
R or Q CRG 1 0.5
227 Y TAC 186 93.5
TAT 2 1.0 F TTC 10 5.0
S TCC 1 0.5
228 R AGG 141 70.9
AGA 56 28.1 AGR 1 0.5 Stop TGA 1 0.5
230 S AGC 190 95.5
TCA 1 0.5
N AAC 7 3.5
A GCC 1 0.5
231 R AGA 197 99.0
K AAA 2 1.0
232 D GAT 76 38.2
GAC 115 57.8 GAY 1 0.5
E GAA 3 1.5
GAG 1 0.5
N AAT 1 0.5
AAC 1 0.5
G GGC 1 0.5
235 W TGG 199 100.0
236 K AAA 197 99.0
AAG 2 1.0
237 G GGA 199 100.0
238 P CCA 190 95.5
CCG 9 4.5
aData are from 199 sequences of HIV-1/SIVcpz complete genomes in the 2014 HIV
Sequence Compendium (Los Alamos National Laboratory ([seehttp://www.hiv.lanl .gov/]). The amino acid and codon of NL4-3 are shown at the top line for each amino acid position. Regarding codon frequencies for amino acids at positions 225, 226, 229, 233, and 234, see reference6.
b
R is A or G, and Y is C or T.
on November 7, 2019 by guest
http://jvi.asm.org/
[image:8.585.39.284.86.512.2]ruses were prepared from HEK 293T cells transfected with NL4-3
or its natural variants (R224cgc, Y226tac, R228aga, D229gat,
R231Kaaa, D232gac, P233cct, V234gtg, K236aag, P238ccg, and
R269Kaag) and were then inoculated into TZM-bl cells. On day 1
postinfection, cell lysates were prepared for luciferase assays. The
infectivity of most natural variants was similar to that of NL4-3,
but P233cct (high
vif
) and R224cgc (excessive
vif
), especially
R224cgc, exhibited significantly decreased viral infectivity (
Fig.
6A
). In order to monitor virion production, H9 cells were
trans-fected with NL4-3 or its natural variants in the presence of the
CXCR4 antagonist AMD3100, and on day 2 posttransfection,
cul-ture supernatants were prepared for Gag-p24 ELISAs. As shown in
Fig. 6B
, while the virion production levels of most variants were
similar to that of NL4-3, Y226tac (low
vif
) and R224cgc/P238ccg
(excessive
vif
) produced progeny virions at higher and lower
lev-els, respectively. These results indicated that R224cgc impaired
both early and late replication phases and that some variations
(Y226tac and P238ccg) strongly influenced virion production.
When replication ability indices were calculated (
Fig. 6C
),
R224cgc, Y226tac, and P238ccg were clearly distinct from NL4-3.
In
Fig. 2
, we show that four natural variations in SA1prox
al-tered viral growth kinetics in an A3G-dependent manner. In order
to determine how this result is applicable to the excessive-
vif
-type
variations, we compared the viral growth kinetics of R224cgc and
P238ccg with those of the low (Y226tac)- and high (V234gtg)-
vif
-type variants in low-A3G CEM-SS and high-A3G H9 cells
(
Fig. 6D
). In permissive CEM-SS cells, Y226tac grew better than
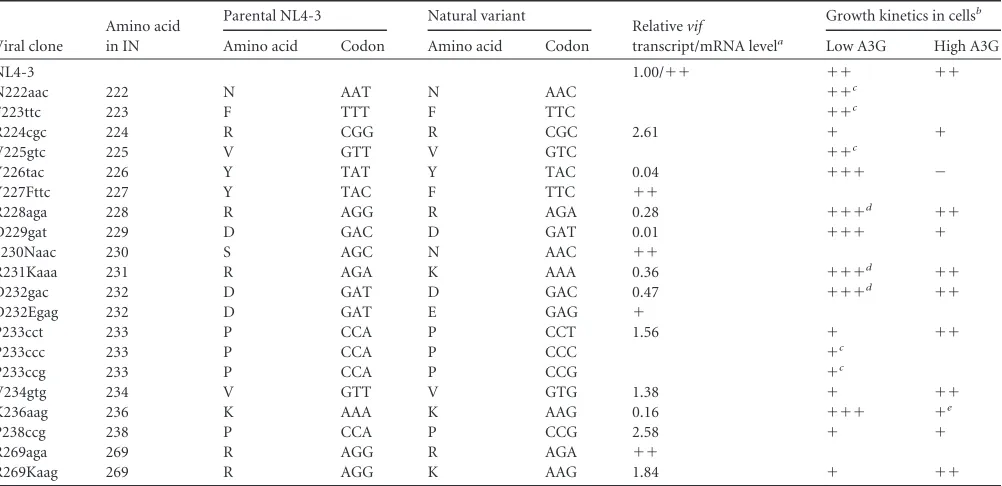
TABLE 3Effects of natural single-nucleotide variations around SA1prox onvifmRNA levels and viral replication potentials
Viral clone
Amino acid in IN
Parental NL4-3 Natural variant
Relativevif
transcript/mRNA levela
Growth kinetics in cellsb
Amino acid Codon Amino acid Codon Low A3G High A3G
NL4-3 1.00/⫹⫹ ⫹⫹ ⫹⫹
N222aac 222 N AAT N AAC ⫹⫹c
F223ttc 223 F TTT F TTC ⫹⫹c
R224cgc 224 R CGG R CGC 2.61 ⫹ ⫹
V225gtc 225 V GTT V GTC ⫹⫹c
Y226tac 226 Y TAT Y TAC 0.04 ⫹⫹⫹ ⫺
Y227Fttc 227 Y TAC F TTC ⫹⫹
R228aga 228 R AGG R AGA 0.28 ⫹⫹⫹d ⫹⫹
D229gat 229 D GAC D GAT 0.01 ⫹⫹⫹ ⫹
S230Naac 230 S AGC N AAC ⫹⫹
R231Kaaa 231 R AGA K AAA 0.36 ⫹⫹⫹d ⫹⫹
D232gac 232 D GAT D GAC 0.47 ⫹⫹⫹d ⫹⫹
D232Egag 232 D GAT E GAG ⫹
P233cct 233 P CCA P CCT 1.56 ⫹ ⫹⫹
P233ccc 233 P CCA P CCC ⫹c
P233ccg 233 P CCA P CCG ⫹c
V234gtg 234 V GTT V GTG 1.38 ⫹ ⫹⫹
K236aag 236 K AAA K AAG 0.16 ⫹⫹⫹ ⫹e
P238ccg 238 P CCA P CCG 2.58 ⫹ ⫹
R269aga 269 R AGG R AGA ⫹⫹
R269Kaag 269 R AGG K AAG 1.84 ⫹ ⫹⫹
aThe relativevifmRNA levels are indicated by the average values obtained from the qRT-PCR analysis shown inFig. 4. The relative levels of some variants (Y227Fttc, S230Naac,
D232Egag, and R269aga) are shown semiquantitatively as⫹⫹(NL4-3 level) and⫹(lower level than that of NL4-3) (seeFig. 4for actual results). Blank spaces indicate that the experiments were not performed.
b
CEM-SS and/or MT4/CCR5 cells were used as low-A3G expressers. H9 and/or CEM cells were used as high-A3G expressers.⫹⫹⫹, virus grew better than NL4-3;⫹⫹, virus grew similarly to NL4-3;⫹, virus grew more poorly than NL4-3;⫺, virus growth was undetectable during the observation period (15 or 21 days). Blank spaces indicate that the experiments were not performed.
cThe growth characteristics of these clones were previously described (6) but not tested in this study. d
Data from multiple experiments showed that the variants appeared to grow slightly better than NL4-3.
eData from multiple experiments showed that the variant appeared to grow slightly more poorly than NL4-3.
FIG 5Effects of naturally occurring combinations of variations in SA1prox on
viftranscript levels. (A)viftranscript levels. RNA samples were prepared from HEK 293T cells transfected with the proviral clones indicated, as described in the legend ofFig. 4, and subjected to qRT-PCR analysis using primer pairs specific forgag/pol(NL-9kb inFig. 1) andvif(NL-vif inFig. 1) transcripts. The expression levels of all HIV-1 transcripts (NL-U inFig. 1) and GAPDH were analyzed by qRT-PCR in parallel for transfection and internal controls, respec-tively. The expression levels ofgag/polandviftranscripts in each sample were normalized by those of all HIV-1 transcripts and GAPDH.gag/polandvif
transcript levels relative to those of NL4-3 are presented. Mean values⫾ stan-dard deviations from three independent experiments are shown. Significance relative to NL4-3 was determined by the Studentttest (***,P⬍0.01; **,P⬍
0.05). (B) Quantification ofviftranscripts.viftranscript levels relative to that of NL4-3 for single (Fig. 4C) and combination (see above) variants determined by qRT-PCR are shown. 228, R228aga; 233, P233cct; 269, R269Kaag; 238, P238ccg; 228⫹233, R228aga⫹P233cct; 233⫹269, P233ccc⫹R269Kaag; 228 ⫹ 233 ⫹ 269, R228aga⫹P233cct⫹R269Kaag; 228 ⫹ 233 ⫹ 238, R228aga⫹P233cct⫹P238ccg.
on November 7, 2019 by guest
http://jvi.asm.org/
[image:9.585.40.287.428.557.2]NL4-3, but V234gtg grew slightly worse than NL4-3, as shown in
Fig. 2
. The growth kinetics of the excessive-
vif
variants R224cgc
and P238ccg were significantly more retarded than those of
NL4-3. In contrast to CEM-SS cells, Y226tac did not grow at all in
nonpermissive H9 cells, whereas V234gtg grew similarly to NL4-3,
as shown in
Fig. 2
. R224cgc and P238ccg again grew more poorly
in H9 cells than did NL4-3. These results indicate that the viral
replication potentials of variant clones are influenced by both
Vif and A3G expression levels. The low (Y226tac)- and high
(V234gtg)-
vif
types grew in a manner that was dependent on their
anti-A3G activity under strong A3G pressure; however, in the
ab-sence of A3G restriction, their replication ability was reversed.
FIG 6Effects of natural variations in SA1prox on viral replication. (A) Single-cycle infectivity. Viruses were prepared from HEK 293T cells transfected with the proviral clones indicated, and equal numbers of RT units were inoculated into TZM-bl cells. Cell lysates were prepared on day 1 postinfection for luciferase assays. Infectivity is presented as luciferase activity relative to that exhibited by NL4-3. Mean values⫾standard deviations from three independent experiments are shown. Significance relative to NL4-3 was determined by the Studentttest (***,P⬍0.01; **,P⬍0.05; *,P⬍0.1). (B) Virion production. H9 cells were cotransfected with the proviral clones indicated and a luciferase reporter vector (pGL3) by using a Nucleofector kit. Virion production on day 2 posttransfection was measured by the amount of Gag-p24 in the culture supernatants. The CXCR4 antagonist AMD3100 (0.5M) was added to cultures throughout the experiment. The amount of p24 was normalized to the luciferase activity in cell lysates. The amount of p24 relative to that produced by NL4-3 is presented. Mean values⫾standard deviations from three independent experiments are shown. Significance relative to NL4-3 was determined by the Studentttest (***,P⬍0.01; **,P⬍0.05; *,P⬍0.1). (C) Replication ability index. Indices for viral single-cycle infectivity were calculated by the multiplication of early (relative TZM-bl infectivity) and late (relative virion production) replication efficiencies. (D) Viral replication kinetics. Viruses were prepared from HEK 293T cells transfected with the proviral clones indicated, and equal numbers of RT units (103units) were inoculated into 105CEM-SS (low-A3G expresser) and H9 (high-A3G
expresser) cells. Virus replication was monitored by the activity of RT released into the culture supernatants. Representative data from at least two independent experiments are shown. Red, green, and purple symbols/lines represent viral clones of low-, high-, and excessive-viftypes, respectively.
on November 7, 2019 by guest
http://jvi.asm.org/
[image:10.585.135.451.64.515.2]Consistent with the replication ability indices (
Fig. 6C
), Y226tac
grew the best among the viral clones tested in the absence of A3G.
Although we did not observe any significant changes in
single-cycle replication assays for V234gtg (
Fig. 6A
to
C
), multicycle
in-fection experiments allowed us to detect the effect of high Vif
levels on growth ability (
Fig. 2
and
6D
). Notably, regardless of the
A3G levels in cells, an excessive-
vif
type (R224cgc and P238ccg)
always grew more poorly than did NL4-3, which was consistent
with the replication ability indices (
Fig. 6C
). However, the
exces-sive-
vif
type that can counteract A3G grew considerably, but the
markedly low-
vif
type Y226tac did not do so under high-A3G
conditions. Collectively, the viral replication potentials of
SA1prox natural variants are determined by their Vif
expres-sion levels and antagonizing ability against A3G.
Reduction in replication potential of excessive-
vif
-type
vari-ants occurs independently of early protein expression (Tat, Rev,
or Nef).
Unlike low- and high-
vif
-type variants, excessive-
vif
-type
variants displayed an impeded replication ability relative to that of
wild-type NL4-3 regardless of the A3G expression level (
Fig. 6D
).
It has been shown that alternative splicing of HIV-1 RNA often
occurs in a mutually exclusive manner and that the change in
splicing efficiency at SA1, which produces
vif
mRNA, influences
the splicing at the other site(s) (
13
,
15
,
54
,
55
,
58
,
62
,
63
). To
investigate the possibility that the alteration of splicing efficiency
at SA1 and the other sites in excessive-
vif
-type variants could have
a negative effect on replication potential, we comparatively
exam-ined the expression patterns and levels of viral mRNA species for
NL4-3, Y226tac (low-
vif
type), V234gtg (high-
vif
type), and
R224cgc and P238ccg (excessive-
vif
types). Total RNA samples
were prepared from HEK 293T cells transfected with proviral
clones and subjected to semiquantitative RT-PCR analysis using
the primer pairs for 2-kb (
tat
,
rev
, and
nef
),
vpu-env
, and
vpr
mRNA species (
Fig. 1C
). In the semiquantitative RT-PCR
analy-sis,
vif
and
vpr
mRNA species of 2 kb were undetectable (data not
shown). As shown in
Fig. 7A
, although the total HIV-1 mRNA
levels of each sample (exon 7) were similar, the expression
pat-terns and levels of 2-kb,
vpu-env
, and
vpr
mRNA species were
different among NL4-3 and its variants. Y226tac variation
in-creased
tat
1 (exon content 1.4.7),
tat
3 (1.3.4.7), and
vpr
3 (1.3E)
mRNA levels but decreased
tat
2 (1.2.4.7),
tat
4 (1.2.3.4.7), and
vpr
4 (1.2.3E) mRNA levels relative to those of NL4-3 (
Fig. 1B
and
C
and
7A
). In contrast, high- and excessive-
vif
-type variants
(V234gtg, R224cgc, and P238ccg) exhibited increased levels in
tat
2 (1.2.4.7) and
tat
4 (1.2.3.4.7) mRNAs and decreased levels in
tat
3 (1.3.4.7) and
vpr
3 (1.3E) mRNAs relative to those of NL4-3. The
results here imply an increase of exon 2 inclusion into viral
mRNAs (e.g.,
tat
2 and
tat
4) in high- and excessive-
vif
-type
vari-ants, suggesting increases in the activities of SD2 as well as of SA1
(
Fig. 1
and
7A
). This is consistent with previous reports that
ele-vated production of
vif
mRNA promotes exon 2 inclusion into the
other viral mRNAs (
13
,
58
).
Quantification of signal intensities of semiquantitative
RT-PCR products revealed that the total expression levels of
tat
mRNAs (
tat
1 to
tat
4) and 2-kb mRNAs (
tat
,
rev
, and
nef
) were
not significantly different among NL4-3 and its variants (
Fig. 7B
).
In contrast,
vpu-env
and
vpr
mRNA levels varied significantly
among various
vif
type variants (
Fig. 7B
). V234gtg and R224cgc
showed a decreased tendency to express the
vpu-env
mRNA.
No-tably, the expression level of
vpr
mRNAs was higher for Y226tac
but lower for V234gtg, R224cgc, and P238ccg than for NL4-3. In
agreement with data from a previous report (
63
), this result
sug-gests that
vif
and
vpr
mRNAs appear to be produced in a mutually
exclusive manner. In order to ascertain the expression levels of
9-kb,
vif
, and 2-kb mRNAs in samples used for semiquantitative
RT-PCR analysis, we performed qRT-PCR analysis using the
primer pairs specific for these mRNAs (
Fig. 1C
). Consistent with
the results described so far (
Fig. 4C
and
7B
), expression levels of
2-kb and 9-kb mRNAs of various
vif
type variants (Y226tac,
V234gtg, R224cgc, and P238ccg) were similar to those of NL4-3,
whereas these variants expressed distinct levels of
vif
mRNAs
(
Fig. 7C
).
Since HIV-1 mRNA expression was changed significantly by
the variations tested here, we checked their effects on viral protein
expression (Tat/Rev/Nef from 2-kb mRNAs and Env/Vpr from
4-kb mRNAs). Because an appropriate anti-Tat antibody is not
available to us,
trans
-activation assays were carried out instead.
Proviral clones and an LTR-driven luciferase reporter clone were
cotransfected into HEK 293T cells, and cell lysates were subjected
to luciferase assays. As shown in
Fig. 7D
, Tat activity of the variant
clones was not lower than that of NL4-3. Western blot analysis of
cell lysates from transfected HEK 293T cells showed that various
vif
type variants expressed Rev and Nef proteins at similar levels
(
Fig. 7E
). On the other hand, the expression levels of Env and Vpr
proteins were slightly different among the variants. R224cgc
ex-pressed Env and Vpr at a modestly low level (
Fig. 7E
). This feature
of R224cgc may explain the decrease in its replication ability (
Fig.
6
). These results suggest that while the expression patterns and
levels of viral mRNAs were distinctly altered by the variations,
there were only small differences in the total expression levels of
2-kb/9-kb mRNAs and the encoded proteins among NL4-3 and
the variants. Taken together, we concluded that the decline in viral
replication potential in excessive-
vif
-type variants is not primarily
due to inadequate expression of the regulatory protein Tat or Rev.
DISCUSSION
In the present study, we defined the extended SA1prox (
Fig. 4
and
Table 2
) and clarified the biological significance of natural
nucle-otide variations there (NL4-3 nuclenucle-otides 4899 to 4943) for viral
replication (
Table 3
). Most natural variations present within
SA1prox of HIV-1 and HIV-2 were found to alter
vif
transcript
expression levels (
Fig. 3
and
4
), suggesting the biological
impor-tance of SA1prox. Natural SA1prox variants of HIV-1 displayed
different expression levels of Vif (low-, high-, and excessive-
vif
types) (
Fig. 2
and
4
). Viral replication potentials of the SA1prox
variants were found to be determined by the expression levels of
both Vif and A3G (
Fig. 2
and
6
). In cells with a low A3G expression
level, Y226tac (low-
vif
type) replicated better than NL4-3, whereas
V234gtg (high-
vif
type) exhibited a slightly slower growth
pheno-type than did NL4-3. Importantly, under various A3G-restrictive
conditions, an adequate expression level of Vif was required to
maintain a certain extent of viral replication (
Fig. 2D
and
6D
).
This implies that the outcome of antagonism between Vif and
A3G has an essential effect on viral replication. We conclude that
SA1prox is a key region that determines Vif expression levels
through its nucleotide variations, thereby modulating the viral
antagonistic ability against A3G and viral replication potential.
The excessive expression of Vif negatively acted on single-cycle
infectivity and/or virion production for R224cgc and P238ccg,
and thus, regardless of the A3G level, these variants were impeded
in their replication ability (
Fig. 4
and
6
). This
on November 7, 2019 by guest
http://jvi.asm.org/
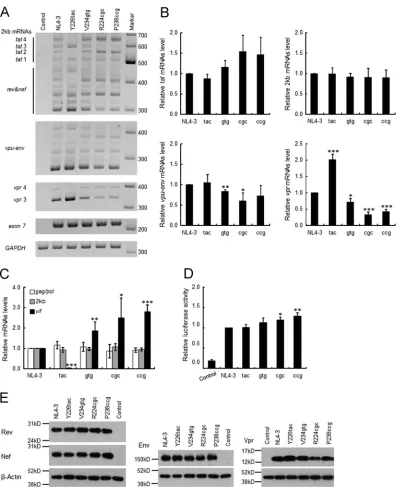
FIG 7Effect of natural variations in SA1prox on viral gene expression. (A) Semiquantitative RT-PCR analysis of spliced mRNAs. Total RNA samples were prepared from HEK 293T cells transfected with the indicated proviral clones and subjected to semiquantitative RT-PCR analysis using the primer pairs for 2-kb mRNA species,vpu-envmRNAs, andvprmRNAs (Fig. 1C). The PCR products of all viral mRNAs (exon 7 inFig. 1) and GAPDH were analyzed in parallel for transfection and internal controls, respectively. Representative data from three independent experiments are shown.vprandtatmRNA species are indicated (see alsoFig. 1). DNA size markers are on the right. Control, pUC19. (B) Quantitation of semiquantitative RT-PCR products. Signal intensities of semiquantitative RT-PCR products were quantitated. The intensities oftat, 2-kb (tat,rev, andnef),vpu-env, andvprmRNAs in each sample were normalized to those of all viral mRNAs (exon 7) and GAPDH. The normalized mRNA intensities in each sample relative to those of NL4-3 are presented. (C) Expression levels of viral mRNAs. Samples used for semiquantitative RT-PCR analysis were subjected to qRT-PCR analysis using primer pairs specific forgag/pol(NL-9kb inFig. 1),vif(NL-vif in Fig. 1), and 2-kb (NL-2kb inFig. 1) mRNAs. The expression levels of HIV-1 mRNAs were calculated and are presented as described in the legend ofFig. 4C. (D) Tattrans-activation assay. The indicated proviral clones and 5RLTR-Luc (6) were cotransfected into HEK 293T cells, and on day 1 posttransfection, cells were lysed for luciferase assays. Luciferase activity relative to that exhibited by NL4-3 is presented. (E) Expression levels of viral proteins. The proviral clones indicated were transfected into HEK 293T cells, and cell lysates were prepared on day 1 posttransfection for Western blot analysis using anti-Rev, anti-Nef, anti-Env, anti-Vpr, and anti--actin antibodies. The migration positions of mass standards are on the left. Representative data from three independent experiments are shown. Control, pUC19. For experiments in panels B to D, mean values⫾standard deviations from three independent experiments are shown. Significance relative to NL4-3 was determined by the Studentttest (***,P⬍0.01; **,P⬍0.05; *,P⬍0.1). Control, pUC19; tac, Y226tac; gtg, V234gtg; cgc, R224cgc; ccg, P238ccg.
on November 7, 2019 by guest
http://jvi.asm.org/
[image:12.585.94.492.62.549.2]tive phenotype was not associated with a lower expression level of
Tat or Rev (
Fig. 7
). Regarding the effect of excessive
vif
expression
on viral replication ability, there are currently four possible
expla-nations. First, the impairment of the early replication phase for
R224cgc may be caused by the high expression level of Vif, a
detrimental effect of Vif, as previously reported (
57
). Second, the
decrease in the virion production level (
⬃
10-fold reduction) has
been shown to result from the elevated expression of
vif
mRNA
(
⬃
20-fold increase) and concomitantly the reduced
accumula-tion of
gag/pol
mRNA (
13
,
58
). This scenario can explain the
de-crease in the replication ability of excessive-
vif
types in late and
early phases; i.e., a lower level of production of
gag/pol
mRNA
results in lower Gag/Gag-Pol expression levels and possibly lower
levels of viral genome RNA packaging. Although we did not
ob-serve such a remarkable alteration in
gag/pol
transcript levels for
our natural variants (
Fig. 4
and
7
), this may have been due to the
smaller effects of our natural variations on
vif
expression levels
than those of previously reported artificial mutations (
13
,
58
). On
one hand, we used different cell types for qRT-PCR and virion
production analyses (HEK 293T and H9 cells, respectively). It is
possible that the expression patterns of viral mRNAs may differ in
both cell types. Third, the modest decrease in both
env
and
vpr
mRNA/protein levels in the excessive-
vif
-type variant could have a
negative effect on viral replication (
Fig. 7
). Fourth, it can be
spec-ulated that an alteration(s) in overall viral mRNA expression of
excessive-
vif
-type variants may perturb the balanced viral mRNA
expression, e.g., the ratio of 4-kb mRNAs to 9-kb mRNAs, and
consequently impair viral replication. Further studies are
neces-sary to elucidate the relationship between the change in HIV-1
mRNA expression by SA1prox variations and the alteration in
replication potential.
Several splicing regulatory elements associated with
vif
mRNA
splicing are located around SA1 and the downstream region of
SD2. HIV-1
vif
mRNA production is complexly regulated by
ex-onic splicing enhancer (ESE)-Vif, ESE-M1 and -M2, the GGGG
silencer, and the G
I2-1 element (
13–15
,
55
). Here we
demon-strated that natural variations were also present within these
ele-ments and that these variations altered Vif expression levels and
viral replication ability (
Fig. 4
and
6
). Moreover, natural
varia-tions within HIV-2 SA1prox also exhibited similar effects (
Table 1
and
Fig. 3
). These results emphasized the importance of
nucleo-tide variations in SA1prox for the determination of Vif expression
levels and viral replication ability.
Table 3
summarizes the effects
of natural nucleotide variations on
vif
expression levels and viral
replication ability. Fluctuations in viral replication ability were
clearly observed for natural variants of markedly low (Y226tac and
D229gat)-, high (P233cct, V234gtg, and R269Kaag)-, and
exces-sive (R224cgc and P238ccg)-
vif
types. However, the other low-
vif
types (R228aga, R231Kaaa, D232gac, and K236aag [
vif
levels
rel-ative to NL4-3 are 0.16 to 0.47]) (
Table 3
) exhibited mild
pheno-typic changes in growth properties in permissive and
nonpermis-sive cells (
Table 3
). Furthermore, high- and excessive-
vif
types did
not replicate better than NL4-3 in cells expressing a high level of
A3G (
Table 3
). A certain range of
vif
expression levels may be
required for efficient viral replication, being associated with A3G
antagonism and the optimal ratio of
vif
and
gag/pol
mRNAs.
As discussed above, splicing to produce various HIV-1 mRNA
species is tightly controlled, and splicing regulation is conducted
by both nucleotide sequences and RNA structures (
13–15
,
54
,
55
,
58
,
64–66
). Since most meaningful natural variations identified in
the present study were clustered within the SLSA1 structure
(
Fig. 4A
), variations may affect splicing at the sequence and/or
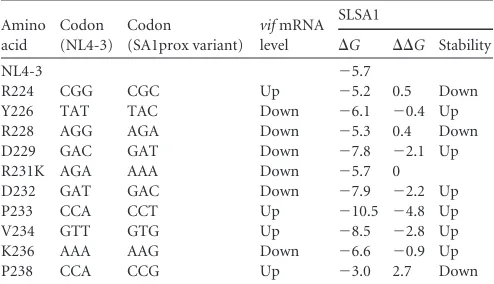
structure level. Thus, we examined whether stabilities of the
SLSA1 structure are correlated with the
vif
mRNA levels (
Table 4
).
The stem-loop RNA structures of SA1prox variants were
pre-dicted
in silico
, and their structural stabilities were evaluated based
on their energies (
⌬
G
). The results showed that the
⌬
G
values of
predicted structures were not always correlated with
vif
mRNA
levels among NL4-3 and SA1prox variants, suggesting that
stabil-ities of secondary RNA structure at the SLSA1 region may not be a
<