This is a repository copy of DRACULA Microscopic Traffic Simulator.
White Rose Research Online URL for this paper: http://eprints.whiterose.ac.uk/2149/
Monograph:
Liu, R. (1994) DRACULA Microscopic Traffic Simulator. Working Paper. Institute of Transport Studies, University of Leeds , Leeds, UK.
Working Paper 431
[email protected] https://eprints.whiterose.ac.uk/ Reuse
See Attached
Takedown
If you consider content in White Rose Research Online to be in breach of UK law, please notify us by
White Rose Research Online
http://eprints.whiterose.ac.uk/Institute of Transport Studies University of Leeds
This is an ITS Working Paper produced and published by the University of Leeds. ITS Working Papers are intended to provide information and encourage discussion on a topic in advance of formal publication. They represent only the views of the authors, and do not necessarily reflect the views or approval of the sponsors.
White Rose Repository URL for this paper: http://eprints.whiterose.ac.uk/2149/
Published paper
Liu, R. (1994) DRACULA Microscopic Traffic Simulator. Institute of Transport Studies, University of Leeds. Working Paper 431
Working Paper 431
December
1994
DRACULA MICROSCOPIC TRAFFIC SIMULATOR
R
Liu
UNIVERSITY OF LEEDS
Institute for Transport Studies
ITS Working Paper 431 ISSN
0142-8942December 1994
DRACULA MICROSCOPIC TRAFFIC SIMULATOR
R Liu
ITS Working Papers are intended to provide information and encourage discussion on a topic in advance of formal publication. They represent only the views of the authors, and do not
CONTENTS
Page
1.INTRODUCTION 1
2.NETWORK REPRESENTATION 1
3.TRAFFIC GENERATION 1
4.VEHICLE MOVEMENT WITHIN THE NETWORK 2
4.1The car-following models 2
4.2Lane-changing (gap-acceptance) rules 3
4.3Vehicle state 5
5.JUNCTION PROCESS 5
5.1Signalised junctions 6
5.2Priority junctions 6
6.RUNNING THE SIMULATION 6
ABSTRACT
LIU, R (1994). DRACULA microscopic traffic simulator. ITS Working Paper 431, Institute for
Transport Studies, University of Leeds, Leeds.
KEY-WORDS:
DRACULA MICROSCOPIC TRAFFIC SIMULATOR
1.INTRODUCTION
The DRACULA traffic simulator is a microscopic model in that the vehicles are individually represented. The movement of vehicles in the network are represented continuously and updated every one second.
The network is modelled as a set of nodes and links which represent junctions and streets respectively. Vehicles are generated at their origins with a random headway distribution and are assigned a set of driver/vehicle characteristics (according to user-specified probabilities) and a fixed route. The movement of the vehicles on a network is governed by a car-following law, the gap acceptance rules and the traffic regulations at intersections. They can join a queue, change lane, discharge to another link or exit from the system. The traffic regulation at an intersection is actuated by traffic lights or right-of-way rules.
The inputs to the simulation are network data, trip matrix, fixed-time signal plans, gap-acceptance and car-following parameters. Outputs are in forms of animated graphics and statistical measures of network performance.
The program is written in C-language. All types of vehicle attributes are represented as one entity using the structure data type which provides a flexibility in storing and modifying various types of data. Attributes of nodes, links and lanes are also represented as structures. The large number of variables associated with vehicles and the network imply that the performance of the simulation depends on the size of the network and the total number of vehicles within the network at one time.
The simulator can be applied in many areas of urban traffic control and management, such as detailed evaluation of traffic signal control strategies, environmental issues such as air pollution due to emission from vehicles in idling, accelerating, decelerating or cruising, and analyses of the effects of variable demand and supply upon the performance of a network.
2.NETWORK REPRESENTATION
The main components of a network are nodes and links. A link is a one-way road between two nodes and consists of one or more lanes. A node can be either internal (an intersection) or external (a source or sink node for traffic coming in or leaving the network). An intersection is presently modelled by at most four bidirectional arms; and may be a traffic signal controlled or priority junction. On a more detailed level, an intersection can also be described by a set of 'inter-lanes' which connect the stop line of an incoming lane with the entry point of a lane leaving the junction. Vehicles travel through the junction along these inter-lanes.
A shifted-negative exponential time-headway distribution is used to describe the arrivals of vehicles into the system. Each origin lane has its own distribution, with the average arrival rate equal to the demand flow rate for that lane. A minimum headway of one second ensures that no more than one vehicle would arrive at the same entry point at the same time interval. If, however, when the next arrival time is due but there is no space in the entry lane, the vehicle would wait at the entry point. Vehicles waiting to enter the system are in a verticle queue at the entry point.
When a vehicle enters the network, associated with it are a set of characteristics describing the driver's behaviour and the vehicle's parameters. These include:
•vehicle's identification number, type and length;
•maximum acceleration and deceleration rates of the vehicle; •driver's desired speed and his normal acceleration rate;
•minimum clearance distance the driver would keep away from the vehicle in front when in stationary;
•driver's reaction time (one second for all drivers is assumed); •pointers to the vehicles ahead and at the back.
These values (except the driver's reaction time) are randomly chosen out of normal (or user-defined) distributions with means varying according to vehicle type and the level of variation specified by the user.
Also assigned to each vehicle are its origin and destination and a fixed route through the network, provided by the demand sub-model of DRACULA.
Parameters describing a vehicle's state during the simulation period are listed in Section IV.3.
4.VEHICLE MOVEMENT WITHIN THE NETWORK
A vehicle's movement within a network is determined by the vehicle parameters, the rules of the road, the state of the traffic lights and the neighbouring vehicles via a car-following model and the lane-changing rules.
4.1THE CAR-FOLLOWING MODELS
A car-following model is one that tries to model the response of a driver in a stream of traffic to the behaviour of the vehicle(s) ahead. There have been several car-following models in the literature (eg. Gipps 1981, Leutzbach and Wiedmann 1986). In general they can be classified as:
(1)a stimulus based model where the acceleration of a vehicle is determined by the driver's reaction to the speed and position difference between him and the vehicle in front; or
(2)a stopping-distance based model where a driver always keeps a certain distance from the vehicle in front so that there would be no collision even if the front driver suddenly applies maximum braking.
The car-following rules employed in the current model combines the two and the driver's desired movements, and can be divided into three according to circumstances.
3
(2)following-move: when the distance between a driver following another becomes shorter (less than 60 meters, an arbitary boundary set between the free-flow and the following moves), he would apply a controlled acceleration which is derived from the relative speed and distance between him and the vehicle in front, in a fashion similar to that used in NEMIS (1990): s) -(t) X -dt) + (t X ( c + ]xdt dt) + (t bV + (t) aV [ = dt) + (t
Vn n n-1 n-1 n
whereV, Xare the speed and position of the vehicle, nthe subject vehicle,
(n-1)the preceding vehicle, tthe current time step, dtthe time increment,
sminimum separation (distance between the front bumpers) of the two vehicles,
a, b, cthe car-following parameters which can be set by the user; default values are 0.56, 0.5 and 0.045 respectively.
(3)close-following: when the two vehicles get very close to each other (separation less than 15 meters, again a boundary set arbitarily), the following vehicle will be prepared to stop in case the one in front brakes suddenly. A Gipps' constrained acceleration (or deceleration) rate is derived as following:
] b / ) (t V -(t)T V -s) -(t) X -(t) X [2( b -T b + T b = T) + (t
V n-1
2 1 -n n n 1 -n n 2 2 n n n ′
where T is the reaction time of vehicle n, bn is the maximum deceleration rate of vehicle n, and b'n-1
the deceleration rate of vehicle (n1) perceived by vehicle n and is assumed to be the minimum of -3.0 and (bn-1 - 3.0)/2 m/sec2.
A minimum speed between Gipps' and that derived as in case 2) is adopted.
In all cases, a driver will not want to move at a speed exceeding his desired speed, accelerate at a rate exceeding his maximum acceleration capacity, or decelerate exceeding his maximum deceleration rate. When a vehicle moves very slowly (speed less than, say, 2 m/s), it is regarded as stationary. This model ensures that the driver maintains his desired speed while keeping a safe distance from the vehicle ahead.
4.2LANE-CHANGING (GAP-ACCEPTANCE) RULES
4
The conditions for a driver to change lane depends on his motive. For a driver who wants to overtake a slow moving vehicle in front by considering changing lanes, he can only do so to his rightside lane and where he can gain in speed. He will not force the vehicle behind to brake or run too close to the vehicle in front. He would normally not change lane in the last section of the link (see Section IV.3 for definition).
When the objective is to move to the correct lane for the next turning movement at the junction, a driver would prepare to slow down either before or after the manoeuvre. His desire for changing lane depends on his position relative to the `end of the queue' in his target lane (the position of the last vehicle in the queue, or in the absence of a queue, the stopline of the link); the closer he is to the end of the queue, the more urgent his desire is to change lane. This is reflected by his accepting smaller gaps and sometimes having to force the vehicle behind to brake or moving close to the vehicle in front. In approaching the end of the queue still without success in changing to his target lane, he would slow down and eventually stop by the end of the queue and wait for an opportunity to change lane. Depending on the traffic situation, the opportunity may arise from a driver in the target lane who slows himself down and lets the subject vehicle join in. (A 20% is given here arbitarily as the percentage of the drivers in the target who are prepared to giveway to let one vehicle join in.)
In cases where there is more than one lane that allows his next turn, the driver would try to move to the lane that has the shortest queue and provides the greatest gain in speed.
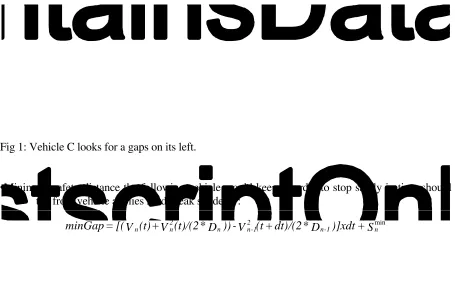
The programming logic varies slightly depending on the lane- changing objectives. Take an example where a vehicle (C in Fig.1) needs to change to its left lane in order to turn left at the next junction, it would need to be aware of vehicles LF and LB in the left lane as well as vehicles F and B in its current lane (Fig. 1). The following parameters are introduced:
[image:10.595.72.527.471.753.2]•Risk factor (f) is a function of vehicle's position relative to the end of the queue.
Fig 1: Vehicle C looks for a gaps on its left.
•Minimum safety distance the following vehicle would keep in order to stop safely in time should the front vehicle applies hard break suddenly:
S + )]xdt D * /(2 dt) + (t V -)) D * (t)/(2 V + (t) V [( =
minGap n-1 n
5
Where D and Smin are the maximum deceleration rate and the minimum clearance distance of the
vehicle respectively. •Gap between two vehicles:
s -(t) X -dt) + (t X =
Gap n-1 n
Assume gapB and gapF the Gaps between vehicles LB and C, and vehicles C and LF respectively, and minB and minF their minGaps. When traffic moves quickly, check the following conditions:
(1.a) dt) V 2 (minB, x f
gapBgapFff f xmaxmax(minF,SCminLB) (2.a)
When traffic moves slowly and vehicle C is close to the end of queue of its target lane, and vehicle LB is willing to let vehicle C in, check
(1.b) S x f gapB LB min f (2.b) S x f gapF C min f
Only when both conditions (1) and (2) hold, would vehicle C be able to change lane.
Vehicles can only change one lane at a time. After making one such manoeuvre, a driver has to wait for a while (a 2 seconds limit is set here arbitarily) before attempting another one.
4.3VEHICLE STATE
Vehicles are processed from downstream to upstream; the one closest to the stopline of the link is processed first. For each vehicle, the following parameters describing the vehicle state are recorded and updated:
•arrival and exit time to and from the network; •travel time in each link;
•total travel time and distance through the network;
•speed and location relative to the entry line of the link at the current and previous time interval; •next link and turn of the vehicle.
When discharged to another link, the vehicles are kept in the same relative positions in the link as they were in their last links. Upon entering a link, the next link of a vehicle is derived from its route and the next turn from the relative position of the current and the next links.
A link is divided into three sections. In the first part of the link (minimum of 50 metres and one-third of the link length), drivers will keep in the lanes they just entered. In the middle section a driver may change lane in order to achieve his desired speed or to get to the lane for his next turn. In the last section of the link (last 60 metres of the link, a limit set arbitarily), the driver will not change lane if this manoeuvre leads him to a lane that forbids his next turn.
5.JUNCTION PROCESS
6
vehicles of the link react to junction control. When the leading vehicle has passed the stopline (for the right turners, the centre of the junction), the succeding vehicle will be treated as the lead. The following vehicles react only to their preceding ones. When the leading vehicle approaches a junction and decides to stop, the stimulus comes from a dummy vehicle with zero length and speed at the stopline. Traffic moves through an intersection along the inter-lanes; the cross between two inter-lanes is a conflict point.
5.1SIGNALISED JUNCTIONS
The time that it takes for the head of a queue to react to the signal changing (from red) to green varies; a range between 1 and 3 seconds is set here randomly. Before moving off, the head of the queue will also check whether his path is clear. During the remaining green period, vehicles move across the junction at a speed determined from the car-following model; the leading vehicle follows the last vehicle in the lane it turns into.
At the instance the signal turns to amber, the driver nearest to the stopline will prepare to stop. If he is too close to the stopline, however, he will either go ahead when he can pass the stopline by the end of the amber period with his current speed, or make a decision randomly whether to carry on moving or to stop. If the decision is to stop, he would apply his maximum deceleration rate if necessary; similarly if he decides to go ahead, he may accelerate with his maximum acceleration rate in order to pass the junction quickly. This decision is then maintained throughout the remaining amber period.
Traffic lights are based on lane/phase operation, which caters for filtered signals.
5.2PRIORITY JUNCTIONS
The links coming into a priority junction are given (in the network data file) a priority mark, giveway or not. Flows in the minor road give way to those on the major road, and share opportunities with other giveway flows. Another giveway situation occurs where the right-turning (major) flow gives way to the opposite straight-moving (major) flow. This happens at signalised junctions as well.
Vehicles travelling on a giveway link will aim to stop by the stopline of the link. Only when they are a few metres away from the stopline where they can see the situation on the major road would they start to look for gaps in the major flows.
Depending on the geometry of the junction and so on whether the two inter-lanes cross each other or not, the two opposite right-turning movements are termed as hooked or un-hooked. In the latter case both vehicles move as though there is no conflict in their movements. In the hooked situation and when both vehicles have the gaps, the one that arriving at the junction first has the higher priority to move, otherwise a random decision is made between the two as to who goes first.
7
Before running the actual simulation, a 'prep-run' is carried out which creates a data base as inputs to the actual simulation. The required inputs are network topology, a description of traffic light phases and the trips through the fixed routes.
The origin/destination trip matrix and the assignment of the vehicles on the different routes of a network are generated out externally (in the demand sub-model of DRACULA). From which, a list of the fixed routes (represented by a list of links) and the demand flow along each route are derived for each type of vehicles and/or during a section of the simulation period. This demand flow is then divided equally among the lanes leaving each origin link for vehicle generation.
The input network data includes for each node: the geometry, type and number of arms; and for each link: the link length, up- and down-stream nodes, number of lanes, permitted turns, a priority mark and the first and the last lanes allowed for each turn. The program derives more detailed information for the simulation which includes: the pointers to the links entering and leaving each (internal) node; and for each link, pointers to its neighbouring links going and leaving its downstream node. Also produced are data describing the lanes (pointer to the link a lane is in and permitted turns) and the inter-lanes (their coordinates) of the network.
The main simulation program puts the vehicles into the network, and represents the movement of every vehicle at each simulation step.
The outputs from the simulation are in the forms of animated graphics and of measures of system performance. The graphical representation of the simulated traffic helps to check the input data and the performance of the model, and can either be run in parallel with the simulation or be recorded for display later on.
The simulator offers a range of numerical outputs. Depending on the applications, it can output the link travel times of each individual driver for re-assignment in the demand analysis; the total travel hours and distances as measures of system performance; and the average speeds, delays, number of stops and/or queue lengths for queueing analysis.
REFERENCES
GIPPS, P.G. (1981). A behavioural car-following model for computer simulation. Transpn. Res. B 15, pp 105-111.
GIPPS, P.G. (1986). A model for the structure of lane-changing decisions. Transpn. Res. B 20, No.5, pp 403-414.
LEUTZBACH, W. AND WIEDMANN, R. (1986). Development and applications of traffic simulation models at the Karlsruhe Institut für Verkehrwesen. Traffic Engng. Control, 27(6), pp 270-278.
8