Oxide Ion Conductors DOI: 10.1002/anie.200((will be filled in by the editorial staff))
Interstitial Oxide Ion Order and Conductivity in La
1.64Ca
0.36Ga
3O
7.32Melilite
Man-Rong Li, Xiaojun Kuang, Samantha Y. Chong, Zhongling Xu, Christopher I. Thomas, Hongjun Niu, John B. Claridge* and Matthew J. Rosseinsky*
Solid oxide fuel cells (SOFCs) are a major candidate technology for clean energy conversion because of their high efficiency and fuel flexibility.[1] The development of intermediate temperature (500-750C) SOFCs requires electrolytes with high oxide ion conductivity (exceeding 10-2 S∙cm-1 assuming an electrolyte thickness of 15m[1]). This in turn needs enhanced understanding of the mechanisms of oxide ion charge carrier creation and mobility at an atomic level. The charge carriers are most commonly oxygen vacancies in fluorites[2,3] and perovskites[3,4] – there are fewer examples of oxygen interstitial-based conductors such as the apatites[5-6] and La2Mo2O9
[7-9]
based materials, so information on how these excess anion defects are accommodated and the factors controlling their mobility is important.
The A2B3O7 melilite structure consists of anionic layers of
five-membered rings of two totally condensed (four neighbouring tetrahedra linked by B-O-B bonds) and three partially condensed (three neighbouring tetrahedra) BO4 tetrahedra, separated by sheets
of A cations located above the five-ring centres (Figures 1a, S1.1). Previously,[10] we demonstrated that A site substitution in melilite LaSrGa3O7 (A2 = LaSr, B = Ga) affords La1.54Sr0.46Ga3O7.27, where
oxygen interstitials (Oint) are located in the five-rings of the
two-dimensional tetrahedral network, gives pure oxide ion conductivity of 0.02-0.1 S∙cm-1 over the 600-900C temperature range.[11] LaCaGa3O7 also adopts the tetragonal melilite structure (space
group P–421m) found for the Sr-doped phases.[12-13] When doped to
introduce oxide charge carriers in the La1+xCa1-xGa3O7+0.5x series, the
tetragonal structure is retained to x = 0.5. This paper addresses the impact on the physical properties of a new lower symmetry phase formed to accomodate the higher interstitial doping levels 0.55 ≤ x ≤ 0.64 .
X-ray powder diffraction from La1.64Ca0.36Ga3O7.32 (Section 2, SI )
indicates the lowering of symmetry at high doping levels occurs by formation of an orthorhombic cell with expansion of the ab plane containing the B3O7 network, consistent with the Cmm2 subgroup of
P–421m (a ~11.416 Å, b ~ 11.226 Å, c ~ 5.248 Å, where a ≈ b
~ 2atetra, c = ctetra). Selected area electron diffraction and HRTEM
imaging requires further doubling of c to give a body-centered supercell with no other systematic absences (Figures S3.2-3), consistent with space groups Imm2, Imm1 and I1.
Variable temperature neutron powder diffraction (NPD) (Figures 1b (top-right inset) and S4.1) shows a transition between the
low-temperature orthorhombic and the small cell tetragonal structure between 600-700 oC, corresponding to a strong anomaly in the
Figure 1 (a) View of the average structure of the Ga3O7+x/2 network
along the [110] direction for La1.64Ca0.36Ga3O7.32. Four of the eight
possible oxygen interstitial sites (Cn, n = 1-8) in the 5-rings are
occupied (C1-O14a, 58.1(1)%; C3-O14b, 23.9(1)%; C5-O13a,28.0(1)%,
C7-O13b, 17.9(1)%). The local ordering involves coupled occupancy
of the C1/C7 (green) and C5/C3 (red) sites, which differ in the polarity
of the interstitial displacement along the [101] direction towards the single 3-connected GaO4 within each ring indicated with broken lines
of different colours. The two orientations of the three-connected Ga2O7 dimers within the five-rings are shown with black Ga-O-Ga
bonds (unoccupied ring centroids) and by representing the bridging oxygens (O3a/O3b, O4a/O4b) of the centroid-occupied rings in pink. (b) Arrhenius plot of total conductivity for La1.64Ca0.36Ga3O7.32
compared with that for La1.54Sr0.46Ga3O7.27. The dash line marks the
phase transition shown by variable temperature NPD (top-right inset) from O (orthorhombic ) to T (tetragonal), the bottom-left insert shows the stacking of La1+xCa1-x (blue) and Ga3O7 layers in melilite.
[] Dr. M. R. Li, Dr. X. Kuang, Dr. S. Y. Chong, Dr. Z. Xu, Mr. C. I. Thomas, Dr. H. J. Niu, Dr. J. B. Claridge,
Prof. Dr. M. J. Rosseinsky
Department of Chemistry, University of Liverpool Liverpool, L69 7ZD (UK)
Fax: (+44) 151-794-3598
E-mail: [email protected]; [email protected] [] Financial Support was provided by EPSRC (C511794)
[image:1.595.312.547.200.567.2]temperature dependence of the conductivity around 650 C (Figure 1b).Here the activation energy changes from 0.95(1) eV at low temperature to 0.45(2) eV at high temperature. The ionic conductivity of the distorted phase is lower than the less doped La1.54Sr0.46Ga3O7.27 which retains the small cell T structure at all
temperatures, suggesting that the structural phase transition is produced by static ordering of the interstitial oxide charge carriers.
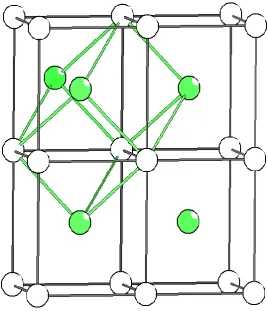
Figure 2 The projection along [110] of (a) bulk and (b) defect structure around the most highly occupied five-ring centroid C1. To
accomodate the interstitial oxide O14a, O12a and O12b displace to O12aL and O12bL toward neighbouring C6 and C8 rings (marked with
arrows in (a)). The occupancy of O3a when O14a is present locally makes C3 the most distorted of all the five rings sharing edges with C1.
Distances from the bridge oxides defining the five-ring around C1/O14a to the centroids of neighbouring channels are marked in (b).
Rietveld analysis of the NPD data showed the best fits were obtained in P1 (a = 9.5736 (1) Å, b = 9.5748(1) Å, c = 9.5692(1) Å,
Figure S3.1 shows the relationship to the I1 cell). There are 8 inequivalent pentagonal channel candidate interstitial sites in the P1 cell, rather than the single site in the disordered tetragonal structure. Conventional least-squares refinements and simulated annealing analysis reveal the ordering of the interstitial oxide charge carriers over these sites which produces the conductivity reduction. The interstitial content was constrained as O7.32 per formula unit, with all
eight sites equally occupied and random La/Ca site occupancy in the starting model. Refinement converged to Rwp/Rp = 3.21/4.60%, χ2 =
4.28 (Figure S5.6; Table S5.4-5). The oxygen interstitials occupy four of the eight pentagonal channels (Cn, n = 1-8 in Figure 1a).
Random occupancy of the interstitial sites gives a poorer fit (χ2
= 5.27). There is partial cation ordering on the A sites: half are fully occupied by La (La1a, La2a, La2b, and La3a), the others are La/Ca mixed sites (La/Ca1b, La/Ca3b, La/Ca4a, and La/Ca4b) of which only La/Ca3b and La/Ca4a have significantly more than statistical amounts of calcium (Figure S5.7, Table S5.4). The simulated annealing analysis, which is less susceptible to false minima,[14] gives a qualitatively identical and quantitatively similar description of the A site and oxygen interstitial ordering (Section 6, SI). Although the refined average structure defines the O interstitial and La dopant occupancies relative to the symmetry-distinct centres of the five-rings of the Ga3O7 layer, a more chemically acceptable
locally relaxed model is needed to give quantitatively reasonable bond valence sums (BVS) [15,16] at the under-bonded interstitial oxide sites and at the isolated three-connected GaO4 tetrahedra
which are closest to the interstitials (BVS ~3.30, Table S5.5). A split model for relaxation around the defects was refined (2 = 4.81; Figures 2, S7.1, Table S7.1-3), with two sets of positions representing the resulting bulk (no interstitial present, tetrahedral Ga) and defect (five coordinate Ga) structural environment around the interstitial oxides. The gallium and oxygen displacements from the bulk to the defect structure are shown in Figures 2, 3, and Figure S7.2-4. We use the most highly occupied interstitial site O14a (average structure BVS = 1.28) to show how synergic bonding geometry changes at the isolated three-connected Ga3b1 site and A counterion displacement towards O14a accommodate the excess oxides.
The two A sites above and below the C1 five-ring displace towards
O14a, with the pure La site closer than the mixed site (La/Ca4aL
-O14a = 2.51(1) Å, La3aL-O14a = 2.46(1) Å) to electrostatically
stabilize the interstitial (Figure S7.2). The displacement of the defect model position Ga3b1L (0.17(1) Å) from the tetrahedron centre
Ga3b1 in the bulk model towards O14a into a triangular face of the original tetrahedron (Figure 3a) shortens this gallium-oxygen bond from 2.177(6) Å to 2.035(6) Å. O14a thus enters the coordination environment of Ga3b1L at one of the axialpositions of the resulting
trigonal bipyramidal Ga3b1LO5 unit (Figure 3b). It should be
emphasized that when the other four Ga centres defining this five-ring are allowed to relax by a similar site-splitting, they move slightly away from O14a rather than towards it, thus demonstrating that only the isolated three-connected Ga centre binds to the interstitial. The interstitial O14a makes close contacts (~1.9-2.5 Å) to three other oxygens (O3b, O12a, and O12b) in the five-membered ring compared to its distances to O9c and O9d (2.70(1) and 2.77(1) Å, Figure 2(b)). The resulting displacement of 0.56(1) Å to O12aL
and of 0.49(1) Å to O12bL bound to Ga3b1L increases the mean
O-Ga3b1L-O angles in the equatorial plane to 119.4(2)o (from
105.2(2)o in the average structure) and makes the mean Oapical
-Ga3b1L-Oequatorial angle 89.7(2) o
(Table S7.2-3), while the mean O-Ga3b1-O angle in the bulk GaO4 tetrahedron is 108.9(1)o. These two
bridging oxygens, and also O3a, which bridges the GaO dimer of
three-connected centres forming the pentagon edge opposite Ga3b1, are now 2.40(1)-2.70(1) Å from O14a and as a result are displaced towards neighbouring pentagonal channel centres (C3, C6, and C8 in
Figure 2a). This expansion of C1 around O14a results in much
shorter distances from its edge-bridging oxygens to the centroids of the five neighbouring edge-sharing channels than to O14a as shown in Figure 2b. This model decreases the BVS of Ga3b1 to 2.91 (Ga3b1O4 tetrahedron) and 2.97 (Ga3b1LO5 trigonal bipyramid),
and increases the O14a BVS to 1.91, providing a satisfactory description of the bonding around the defect.
Figure 3 Structural relaxation around the most highly occupied interstitial oxide O14a. Ga3b1L, O12aL, O12bL, O3a are involved in
the local structural relaxation. (a) Tetrahedral GaO4 in the absence of
O14a. (b) GaO5 trigonal bipyramid formed by O14a. O7a is the
non-bridging terminal oxygen.
This relaxation around O14a prevents interstitial occupancy of any of the five nearest neighbor ring centres to C1 (C2, C3, C4, C6, and C8)
(Figure 2a). The doping dependence of the structure can be rationalized by consideration of the longer-range interaction of these distortions. Each interstitial site is surrounded by seven nearest-neighbour interstitial sites (Figure 4), five sharing a common edge and the more distant two a fully condensed tetrahedral GaO4 vertex.
The closest of the five edge-sharing neighbours (C3 in the case of
the C1 occupancy discussed above – this is the ring that is most
distorted by the presence of the interstitial in the defect model) shares a Ga2O7 unit of two bridged three-connected GaO4 tetrahedra,
the four next nearest share edges linking three- and four-connected tetrahedra.
The observed supercell has eight crystallographically distinct centroids as candidate oxygen interstitial sites, and sole occupancy of one of these sets at 1/8 (12.5%) coverage (x = 0.5) would leave all seven of the rings neighbouring the occupied interstitial empty with none of the nearest neighbours of these rings occupied (Figure 4). This would allow the relaxations in the five nearest-neighbour edge-sharing rings around an interstitial (Figure 2) to take place without interference from similar distortions enforced by the nearest interstitials – only the more distant corner-sharing empty nearest-neigbours are shared by the occupied sites.
In fact, the situation is more complex as the interstitials remain disordered positionally in the tetragonal structure (where all five-ring centroid sites are equivalent) to beyond 12.5% coverage to 13.75% (x = 0.55). Sharing of the most distorted five edge-sharing neighbours can be avoided in disordered interstitial occupancies within the tetragonal structure up to x > 0.5 (Figure 5). The observation of long-range order of the displacements between x = 0.5 and 0.6 suggests that the sharing of the empty corner-shared neighbours by the occupied interstitials does have some energetic significance.
Figure 4 The seven five-ring centroids surrounding an occupied interstitial site (black sphere) - red spheres represent rings sharing an edge of 3- and 4-connected GaO4 units; green spheres, a
3-connected Ga2O7 edge (this ring is the most heavily distorted by the
presence of the interstitial); yellow spheres, rings linked by corner-sharing; 4-connected GaO4 units are coloured cyan. The two
orientations of the Ga2O7 dimers of 3-connected tetrahedra are shown
in green (black bonds in Figure 1a) and and orange (pink bridging oxygens in Figure 1a) and represent the two displacement directions of the interstitial oxide in the disordered tetragonal structure. The green arrow shows the single displacement direction in the ordered orthorhombic structure. The five nearest neighbour interstitial sites are represented as a grey pentagon centred on the occupied ring. The grey spheres represent a second set of sites whose occupancy does not share the most distorted near-neighbour ring (green spheres) of the first set. The highlighted black line connects two ring centroids (marked as black spheres in Figure 6) which can only have two of the three neighbour black and grey sites occupied at the observed composition..
At x = 0.55, interstitial ordering occurs to minimize the overlap of the strain fields produced by the displacements into neighbouring rings. This can be discussed in terms of the direction of the displacement of the interstitial oxide towards the isolated 3 connected GaO4 unit within each ring, away from the edge defined
by the Ga2O7 unit formed by the bridged 3-connecting GaO4 units.
In the disordered tetragonal structure, there are two equivalent orientations of this edge (Figure 4 and 5), so both displacement directions occur. In order to ensure that the most distorted neighbouring ring to an occupied interstitial (sharing the Ga2O7
-bridged edge away from which Oint displaces to bond with the
isolated 3 connected Ga) is not shared, it is necessary to order the occupancy of the interstitial sites at x > 0.6 by selecting one of these two displacement directions that are degenerate in the tetragonal structure. This requires four of the eight interstitial sites corresponding to the other displacement direction to be empty. It is then possible to select a second site from within the remaining four which has the same polarity of displacement along the unique direction as the first and will leave empty all seven nearest neighbours of both occupied sites (Figure 6). This leaves empty all four of the remaining edge-sharing rings around the most distorted ring produced by the both sets of interstitials (C3 into which O3a
(a) O2 (b)
O12bL
1.903 1.840
Ga3b1L
2.035 O12aL
displaces in the case of the O14a interstitial – represented as white spheres in Figure 6). This avoids sharing the major distortions produced by the two occupied interstitial sites. The other four edge-sharing rings around the first interstitial share one of their four less distorted edges with the second occupied sublattice (Figure 6).
Figure 5 Disordered interstitial occupancy > 1/8 in the tetragonal structure, represented using the pentagon of five neighbours (Figure S8.1) to an occupied sphere from Figure 4. The pentagon edges highlighted in black connect the two five ring centroids neighbouring the occupied interstitial which share a common three-connected Ga2O7 dimer and indicate the two orientations of interstitial
displacement possible in the T structure, in contrast to the distorted structure (Figure 1) where only one orientation/displacement direction is present.
Full occupancy of these two sites sharing the same direction and sense of displacement would give 25% coverage (x = 1). The real situation is more complex, as all four of the sites corresponding to one displacement direction (and thus to both senses of this displacement shown in Figure 1) are partly occupied. The observed composition can be rationalized in terms of minimizing the strain in two next most distorted rings neighbouring an interstitial (C6 and C8
in the case of C1), which are bridged by a common Ga2O7 dimer
(Figures 4, 6) either randomly or in an ordered manner. The C1
(58%) and C7 (18%) sites correspond to two arrays with the same
direction and sense of displacement (green dotted lines in Fig 1), with the O14a C1 occupancy locally allowing only 1/3 of the C7
sites to be occupied rather than all of them to minimize the strain associated with this empty near-neighbour ring sharing and give a total 2/3 occupancy of the possible sites. This is an “ordered” model where one of the eight sites is fully occupied and the second site which shares the same sense and direction of the displacement is 1/3 occupied. The occupancy of the C3/C5 pair at 24/28% corresponds to
the remaining pair of the four centroids sharing the same displacement direction but with the sense of the displacement along that direction being opposed to the ordered pair (pink dotted lines in Figure 1) – as the occupancy of both sites is approximately equal this corresponds to disordered 2/3 occupancy of both sites. As less than 40% of sites in total are occupied this can occur in regions not neighbouring the ordered regions referred to above. Simultaneous
interstitials as nearest neighbours and would thus be disfavored as relaxation into the rings neighbouring an interstitial would be suppressed.
Figure 6 The maximally doped ordered interstitial structure (pentagon centroids represent occupied sites, vertices are empty ones) where the two of the eight sites which share a common interstitial displacement sense and direction are occupied. This avoids two interstitials sharing the most distorted unoccupied ring (white spheres) as a near neighbour. Dark spheres represent two ring centroids sharing a common three-connected Ga2O7 edge, equivalent to the
highlighted spheres connected by a black line in Figure 4.
The refined structure of the interstitial-ordered orthorhombic phase reveals how the distortions required to stabilise the interstitials at both the tetrahedral and the larger A sites become coupled at high interstitial densities to prevent unfavorable local interactions between carriers. Although the refined cell would need to be doubled again to allow for total carrier order, explaining the rather high residual ionic conductivities, the effect on interstitial mobility through the need to rearrange the complex relaxation around a mobile carrier without adversely affecting potential neighbours in the surrounding five rings can be gauged by the extent of the displacements required between the interstitial-containing and interstitial-free parts of the superstructure, and the requirement to order the La dopants on the A site around the interstitials.
Experimental Section
See Supporting Information. Further details on the crystal structure investigation may be obtained from the Frachinformationszentrum Karlsruhe, 76344 Eggenstein-Leopoldsharen, Germany (fax: (+49)7427-806-666; e-mail: [email protected]), on quoting the depository numbers CSD-421081 and 421082.
Received: ((will be filled in by the editorial staff))
Published online on ((will be filled in by the editorial staff))
[2] J. B. Goodenough, Ann. Rev. Mater. Res. 2003, 33, 91. [3] J. C. Boivin, G. Mairesse, Chem. Mater. 1998, 10, 2870.
[4] T. Ishihara; H. Matsuda, Y. Takita, J. Am. Chem. Soc. 1994, 116, 3801. [5] S. Nakayama, T. Kageyama, H. Aono, Y. Sadaoka, J. Mater. Chem. 1995, 5, 1801.
[6] E. Kendrick, M. S. Islam, P. R. Slater, J. Mater. Chem. 2007, 17, 3104. [7] F. Goutenoire, O. Isnard, R. Retoux, P. Lacorre, Chem. Mater.2000, 12,
2575.
[8] P. Lacorre, F. Goutenoire, O. Bohnke, R. Retoux, Y. Laligant, Nature,
2000, 404, 856.
[9] I. R. Evans, J. A. K. Howard, J. S. O. Evans, Chem. Mater.2005, 17, 4074.
[10] X. Kuang, M. A. Green, H. Niu, P. Zajdel, C. Dickinson, J. B. Claridge,
L. Jantsky, M. J. Rosseinsky, Nature Mater. 2008,7, 498. [11] M. Rozumek, P. Majewski, H. Schluckwerder, F. Aldinger, J. Am.
Ceram. Soc. 2004, 87(9), 1795.
[12] J. M. S. Skakle, R. Herd, Powder Diffr. 1999,14, 195.
[13] a) K. Hagiya, M. Ohmasa, K. Iishi, Acta Cryst.1993, B49, 172. b) K. Hagiya, K. Kusaka, M. Ohmasa, K. Iishi, Acta Cryst.2001, B57, 271. c) M. Ohmasa, K. Hagiya, K. Kusaka, J. Mineral. Petrol. Sci. 2002, 97, 199.
Entry for the Table of Contents (Please choose one layout) Layout 1:
Oxide Ion Conductors The spatial ordering of the oxide
interstitial charge carriers in La1.64Ca0.36Ga3O7.32 melilite reduces the
ionic conductivity. The complex ordering pattern is produced by the cooperative accommodation of the local structural relaxation around the interstitials which extends well beyond the simple formation of GaO5 trigonal bipyramids
from GaO4 tetrahedra apparent in
disordered structures at lower interstitial concentrations.
M. R. Li, X. Kuang, S. Y. Chong, Z. Xu, C. I. Thomas, H. J. Niu, J. B. Claridge*, M. J. Rosseinsky*
__________ Page – Page
Interstitial Oxide Ion Order and Conductivity in La1.64Ca0.36Ga3O7.32
Melilite
Supporting Information
Interstitial Oxide Ion Order and Conductivity in La
1.64Ca
0.36Ga
3O
7.32Melilite
Man-Rong Li, Xiaojun Kuang, Samantha Y. Chong, Zhongling Xu, Christopher I. Thomas, Hongjun Niu, John B. Claridge* and Matthew J. Rosseinsky*
Department of Chemistry, University of Liverpool, Liverpool, UK, L69 7ZD
The supporting information is organised as follows:
1. Experimental Section
2. XRD data for La1+xCa1-xGa3O7+0.5x
3. SAED and HRTEM analysis
4.Phase transition (VT NPD)
5. Structure refinement for La1.64Ca0.36Ga3O7.32 in average models
6. Simulated annealing approach
7. Structure refinement for La1.64Ca0.36Ga3O7.32 in split model
1. Experimental Section
The A2B3O7 melilite structure, where A is a large eight-coordinated cation (A = Ca, Sr, Na, Ba, La)
and B is small cation (B = Mg, Zn, Al, Ga, Si, Ge, …) in tetrahedral coordination, consists of anionic
layers of five-membered rings of totally (four neighbouring tetrahedra) and partially condensed (three
neighbouring tetrahedral with a terminal oxygen) BO4 tetrahedra, separated by parallel sheets of A
cations located over the five-ring centres along [001] (Figure S1.1).
La1+xCa1-xGa3O7+ (0 x 0.7) (A = La/Ca, B = Ga) were prepared by solid state reaction using
La2O3 (99.999%, Alfa Aesar), CaCO3 (99.997%, Alfa Aesar) and Ga2O3 (99.999%, Alfa Aesar) as
starting materials, which were mixed in ethanol and calcined at 1200 C for 12 h in alumina crucibles.
After regrinding, the powders were uniaxially pressed into pellets and fired at 1400 C for samples with
x < 0.5 and 1350 C for samples with x > 0.5 for 12 h at 5 C/min heating and cooling rates. To
compensate the Ga volatilization during the reaction which results in the form of the second phase
Ca-doped LaGaO3, a slight excess of Ga2O3 (~0-1.7 mol% for x ≤ 0.6; ~2-3.3mol% for 0.6 < x ≤ 0.65;
~5mol% for x > 0.65) was added into the initial starting mixture. Attempts to obtain single phase
materials at x = 0.65 by adding excess Ga2O3 (e.g. ~ 2 mol% and ~ 3.3 mol%) failed to remove the
second phase Ca-doped LaGaO3. Slightly reducing the La/Ca ratio to x = 0.64 with ~ 2.3 mol% extra
Ga2O3 (i.e. initial composition La1.64Ca0.36Ga3.07) produced a nearly single phase material
La1.64Ca0.36Ga3O7.32 with a very small Ga2O3 impurity. To avoid reacting with the alumina, the pellets
were put on platinum foil during the preparation. The phase purity was checked by powder X-ray
diffraction data with a Panalytical X‟pert Pro Multi-Purpose X-ray diffractometer (Co K1 radiation
= 1.78901Å). Silicon was added as an internal standard during the laboratory XRD experiments in
order to refine the variation of the cell parameter with composition. Time-of-flight (TOF) neutron
powder diffraction (NPD) data of La1.64Ca0.36Ga3O7.32 sample were collected from ambient temperature
was offline cooled to ambient temperature and another ambient temperature TOF data was collected
from comparison with that for the as-made sample. Rietveld refinement was carried out using the
GSAS package1. Compositional analysis was carried out by using the EDAX analyzer on a JEOL
2000FX transmission electron microscope operated at 200 KV. Ac Impedance Spectroscopy (IS)
measurements in air from 200 C to 850 C were performed with a Solartron 1255B Frequency
Figure S1.1. Slab view of A2B3O7 melilite structure along (a) [001] and (b) [010] direction, showing
the five membered BO4 rings and location of A cations. Four connected BO4 tetrahedron, yellow; three
connected BO4, purple; A cation, blue; bridging oxygen, red; terminal oxygen, green.
Response Analyzer, a Solartron 1296 dielectric interface and a Solartron 1287 electrochemical
interface over the 10-2-106 Hz frequency range. Prior to the measurement, platinum paste was painted
on the opposite faces of the pellets and fired at 800 C for 30 minutes in air.
2. XRD data for La1+xCa1-xGa3O7+0.5x
The parent material LaCaGa3O7 crystallizes in a tetragonal melilite structure in P421m
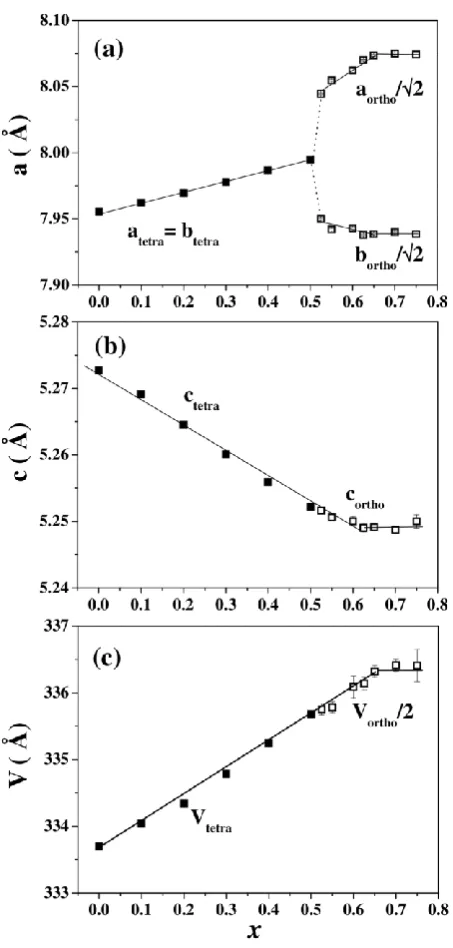
(a = 7.9553(2) Å, c = 5.2727(2) Å). With the substitution of Ca2+ by La3+, the tetragonal phase extends to La1.5Ca0.5Ga3O7.25. The cell parameters of La1+xCa1-xGa3O7+0.5x obey Vegard‟s law for 0 x 0.5. The La3+ substitution expanded the a-axis and shortened the c-axis. The volume increased with increasing
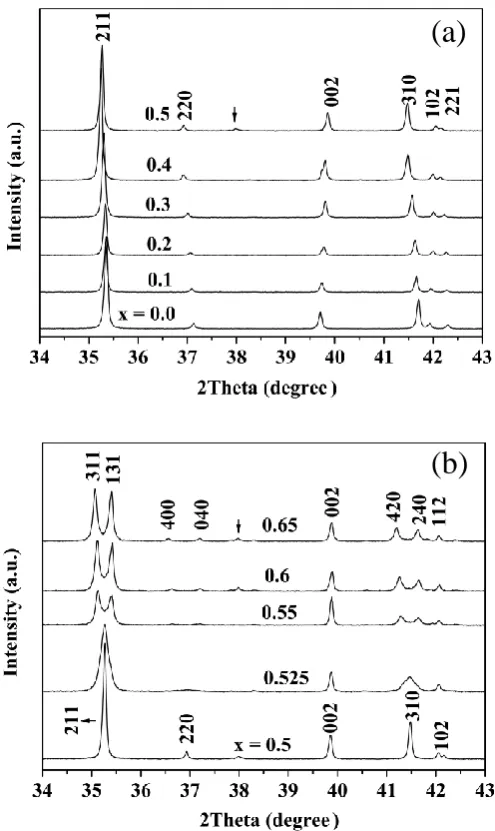
La3+ content. Each (hkl) (h and k 0) reflection is broadened at x = 0.525 and splits into two distinct peaks at x > 0.525, which could be explained by a lower symmetry with inequivalent a-axis and b-axis, i.e. an orthorhombic cell (a and b ~ 2atetra, c = ctetra) with a sub-group Cmm2 ofP m
1
2
4 . The XRD
patterns (Figure S2.1) suggested that the as-made samples x > 0.5 actually contained both tetragonal and orthorhombic phases and the orthorhombic phase dominates in the samples x 0.55. The cell parameters for orthorhombic and tetragonal La1+xCa1-xGa3O7+0.5x, shown in Figure S2.2, become
constant after x = 0.65 which suggests that the solid solution terminates at x = 0.65. The XRD pattern of the as-made La1.64Ca0.36Ga3O7.32 showed a pure orthorhombic phase with no apparent residual
tetragonal phase in the sample. EDS (energy-dispersive spectroscopy) elemental analysis in the TEM
investigation showed a homogenous cation ratio La1.62Ca0.36Ga3 for La1.64Ca0.36Ga3O7.32 against
Figure S2.1. XRD patterns of as-made La1+xCa1-xGa3O7+0.5x. (a) x 0.5 adopting the tetragonal cell and (b) x 0.55 indexed with the orthorhombic cell. The arrows mark reflections from the second phase Ca-doped LaGaO3.
(a)
Figure S2.2. Cell parameters versus compositions for the La1+xCa1-xGa3O7+0.5x solid solution. The
orthorhombic cell parameters aortho and bortho were divided by 2 and volume by 2 for comparison with
tetragonal cell. The tetragonal and orthorhombic cells are represented by using filled and open squares,
3. SAED and HRTEM analysis
SAED results showed that, although the main diffraction features were consistent with the crystal
structure proposed by XRD (space group Cmm2, a =11.42Å, b = 11.23 Å and c = 5.25 Å), extra weak reflections were observed in the diffraction patterns along certain crystal axes. These extra spots can be
indexed simply by doubling the c axis of the proposed unit cell. The reciprocal lattice reconstruction
indicates a c-axis doubled body-centered supercell based on the above Cmm2 cell with no other systematic absences observable, suggesting possible space groups Imm2, Im11, and even in triclinic cell I1. Figure S3.2 shows the simulated SAED patterns for La1.64Ca0.36Ga3O7.32 according the the
[image:13.612.173.442.335.647.2]triclinic cell (Space group of P1, a = 9.5735 Å, b = 9.5754 Å, c = 9.5691 Å, α = 106.78o, β = 108.17o, γ = 113.51o, its relationship to the I1 cell is shown in Figure S3.1)
Figure S3.2 SAED patterns for La1.64Ca0.36Ga3O7.32 along the (a) [001] axis where no extra reflections
are observed, and the (b) [1
12] (c) [1
16] and (d) [106] axes where superlattice reflections (as marked
by white arrows), which can be indexed as ) 2
1 2
(hk n , indicate the c-doubling. The axes and
reflections are indexed according to theP1 cell.
HRTEM was applied to check possible microstructural crystal defects, such as twinning, in order to
investigate any relationship with the weak diffraction features. Figure S3.3 is the HRTEM image along
[112] (left) and [121] (right) simulated in the triclinic c-doubled supercell in P1 with the final refined structural model. The images simulated from different directions are quite similar, and it is thus clear
that the extra weak reflections in SAED are intrinsic features, instead of arising from microscopic
Figure S3.3 HRTEM of La1.64Ca0.36Ga3O7.32 along [112](left) and [121](right) in P1 cell. Inset is the
4. Phase transition (Variable temperature NPD)
Figure S4.1 Variable temperature (VT) time-of-flight neutron diffraction (TOF ND) patterns for
La1.64Ca0.36Ga3O7.32 upon heating show a phase transition between 600 and 700 oC. The phases present
at each temperature are marked as orthorhombic (O) and tetragonal (T) phases. The O and T phases
coexist as shown in the ambient temperature (AT) data after VT experiment, compared with the AT
5. Structure refinement for La1.64Ca0.36Ga3O7.32 in average models
High resolution neutron HRPD (TOF) data from both backscattering (NPD168) and 90 degree
(NPD90) detectors were used for crystal structure refinement in GSAS. Refinements were carried out
in the following sequence (Figure S5.1), in order to explore the possible space groups suggested by
SAED.
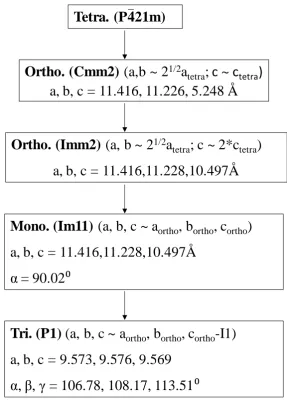
Ortho. (Imm2)
(a, b ~ 2
1/2a
tetra
; c ~ 2*c
tetra)
a, b, c = 11.416,11.228,10.497Å
Mono. (Im11)
(a, b, c ~ a
ortho, b
ortho, c
ortho)
a, b, c = 11.416,11.228,10.497Å
α = 90.02
⁰
Tri. (P1)
(a, b, c ~ a
ortho, b
ortho, c
ortho-I1)
a, b, c = 9.573, 9.576, 9.569
α, β, γ = 106.78, 108.17, 113.51
⁰
Tetra. (P421m)
Ortho. (Cmm2)
(a,b ~ 2
1/2a
tetra
;
c
~
c
tetra)
[image:17.612.161.449.192.595.2]a, b, c = 11.416, 11.226, 5.248 Å
Figure S5.1Schematic diagram for structure refinement
The general parameters, including histogram scale factors, background coefficients, unit cell
parameters, zero error and peak shape coefficients, were varied for all refinements. Framework atoms
established using Fourier synthesis techniques and refined in accordance with nominal composition and
charge balance. The atomic positional and displacement parameters of mixed site atoms were
constrained to be the same. In the split-site model, the atomic displacement parameters (ADPs) for split
sites were refined isotropically for convergence, and the related values for bulk and defect structure
were simultaneously refined to be the same value. The final refined results were shown in Table S5.1.
Table S5.1 The cell parameters, refined variables (RV), and fitted parameters from the final refinement
in S.G. Cmm2, Imm2, Im11, P1 (average model (P1-average) and split model (P1-split) for comparing.
S.G. Cmm2 Imm2 Im11 P1-average P1-split
a (Å) b (Å) c (Å) α (°) β (°) γ (°) V (Å3) RV
Rwp/Rp%
2
11.41253(6) 11.22407(6) 5.24802(9) 90
90 90
672.24(2) 122 4.81/5.47 9.31
11.41582(3) 11.22801(3) 10.49733(3) 90
90 90
1345.516(6) 201
4.12/5.37 6.84
11.41608(3) 11.22797(3) 10.49736(2) 90.023(1) 90
90
1345.547(5) 320
3.37/4.96 4.69
9.57355(3) 9.57482(3) 9.56915(3) 106.781(1) 108.173(1) 113.510(1) 672.846(4) 536
3.21/4.60 4.28
9.57230(4) 9.57283(4) 9.56967(4) 106.779(1) 108.176(1) 113.501(1) 672.726(4) 507
3.30/4.42 4.81
5.1 Orthorhombic cell, Cmm2 space group
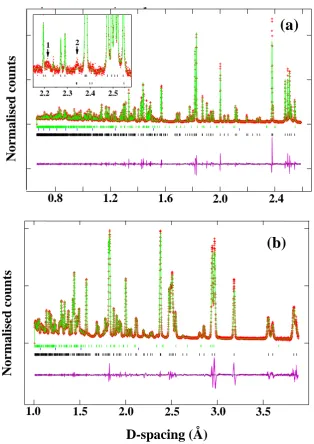
The Rietveld refinement plots of data in the Cmm2 cell (see Section 3 and Figure S5.1) are shown in Figure S5.2 (Rwp/Rp = 4.81/5.47%, 2= 9.31). As can be seen in Figure S5.2, the fit is poor, especially
in the high d-spacing range (~ 2.4 Å). No significant improvement on the fitting was achieved by
adding a tetragonal phase in the refinement, indicating that there is no minor quenched tetragonal phase.
Excess weak reflections could be examined as shown in the inset of Figure S5.2a, which requires a
larger supercell. Thus, the following refinements were carried out considering the c-axis doubled
0.8 1.2 1.6 2.0 2.4 2.2 2.3 2.4 2.5
1 2
[image:19.612.141.456.50.495.2]1.0 1.5 2.0 2.5 3.0 3.5
Figure S5.2 Rietveld refinement of RT HRPD ND data in S.G. Cmm2 from (a) backscattering (b) 90 degree banks. Three rows of vertical tick mark the reflections from La1.64Ca0.36Ga3O7.32, the vanadium
container, and Ga2O3 from bottom to top, respectively. The enlarged inset of (a) between 2.15-2.56Å of
to show two set of weak reflections, which cannot be accounted for by the Cmm2 cell, requiring a I c-doubling cell. The impurity Ga2O3 has contribution to the weak reflections around 2.35 Å marked as 2.
(a)
(b)
D-spacing (Å)
Nor
malised
coun
ts
Nor
malised
coun
5.2 Orthorhombic cell, Imm2 space group
The followed Rietveld refinement in the c-doubled supercell in Imm2 still gave poor fitting (Figure S5.3; Rwp/Rp = 4.12/5.37%, 2 = 6.84). The fit cannot be improved by switching to the Stephen‟s
anisotropic broadening function2 or by adding the tetragonal phase into the refinement, which
suggested the investigation of lower symmetry for La1.64Ca0.36Ga3O7.32.
0.8 1.2 1.6 2.0 2.4
[image:20.612.153.444.192.612.2]1.0 1.5 2.0 2.5 3.0 3.5
Figure S5.3 Rietveld refinement of RT HRPD ND data in S.G. Imm2 from (a) backscattering (b) 90 degree banks. Three rows of vertical tick mark the reflections from La1.64Ca0.36Ga3O7.32, the vanadium
container, and Ga2O3 from bottom to top, respectively
D-spacing (Å)
(a)
(b)
Nor
malised
coun
ts
Nor
malised
coun
5.3 Monoclinic cell, Im11 space group
0.8 1.0 1.2 1.4 1.6 1.8 2.0 2.2 2.0 2.2 0.8 1.0 1.2 1.4 1.6 1.8 2.0 2.2 2.0 2.2 0.8 1.0 1.2 1.4 1.6 1.8 2.0 2.2 2.0 2.2
1.0 1.5 2.0 2.5 3.0 3.5
1.0 1.5 2.0 2.5 3.0 3.5
[image:21.612.158.437.81.480.2]1.0 1.5 2.0 2.5 3.0 3.5
Figure S5.4Rietveld refinement of RT HRPD ND data based on the average model in S.G. Im11 from (a) backscattering (b) 90 degree banks. Three rows of vertical tick mark the reflections from
La1.64Ca0.36Ga3O7.32, the vanadium container, and Ga2O3 from bottom to top, respectively.
The Rietveld refinement in the lower symmetry monoclinic space group Im11 is significantly improved as shown in Figure S5.4 compared with Figure S5.3 and converged to Rwp/Rp = 3.37/4.96%,
and 2 = 4.69. Three distinct interstitial sites were revealed and the total population was constrained to
be 2.56 for charge balance as listed in Table S5.2 and Figure S5.5. However, a slight misfit in the high
d-spacing range (~2.0 Å) could be observed (Figure S5.4), implying lower symmetry and/or more
(b)
(a)
D-spacing (Å)
Nor
malised
coun
ts
Nor
malised
coun
ordered extra oxide distribution. Therefore, further refinement was performed in a triclinic cell (P1) by removing the mirror symmetry element in Figure S5.5.
Table S5.2 Refined structural parameters for La1.64Ca0.36Ga3O7.32 at room temperature for the average
structure in monoclinic Im11
Atom Site x y z Occupancy
La/Ca1 4b 0.3367(1) 0.4926(2) 0.7498(1) 0.780(1)/0.220(1)a La/Ca2 4b 0.3371(1) 0.4904 (3) 0.2496(1) 0.984(1)/0.016(1)a La/Ca3a 2a 0.5 0.8309(2) 0.7538(3) 0.915(1)/0.085(1)a La/Ca3b 2a 0.5 0.1529(2) 0.7589(2) 0.620(1)/0.380(1)a La/Ca4a 2a 0.5 0.8250(2) 0.2621(2) 0.651(1)/0.349(1)a La/Ca4b 2a 0.5 0.1534(2) 0.2464(2) 0.846(1)/0.154(1)a Ga1a 4b 0.2520(3) 0.7432(3) 0.4961(2) 1
Ga1b 4b 0.7491(3) 0.2423(3) 0.4969(2) 1 Ga2a 4b 0.1351(1) 0.4858(3) 0.5165(1) 1 Ga2b 4b 0.1371(1) 0.4851(2) 0.0170(1) 1
Ga3a1 2a 0.5 0.6368(2) 0.9818(2) 1
Ga3a2 2a 0.5 0.3360(2) 0.9805(2) 1
Ga3b1 2a 0.5 0.6378(2) 0.4867(2) 1
Ga3b2 2a 0.5 0.3438(2) 0.4823(2) 1
O1 2a 0.5 0.4871(4) 0.9088(2) 1
O2 2a 0.5 0.4926(4) 0.4044(2) 1
O3a 2a 0.5 0.0236(2) 0.5978(3) 0.704(8)b
O3b 2a 0.5 0.9884(11) 0.6074(6) 0.296(8)b
O4a 2a 0.5 -0.0047(11) 0.0952(5) 0.444(6)c
O4b 2a 0.5 0.9377(4) 0.0815(6) 0.556(6)c
O5 4b 0.1376(1) 0.4923(4) 0.8454(1) 1 O6 4b 0.1376(1) 0.4931(3) 0.3441(1) 1
O7a 2a 0.5 0.6286(2) 0.6580(3) 1
O7b 2a 0.5 0.3502(2) 0.6548(2) 1
O8a 2a 0.5 0.6238(3) 0.1540 (3) 1
O8b 2a 0.5 0.3538(2) 0.1501(2) 1
O9a 4b 0.2384(2) 0.5998(2) 0.0802(2) 1 O9b 4b 0.7897(2) 0.36108(2) 0.1053(2) 1 O10a 4b 0.2151(2) 0.6140(2) 0.6006(2) 1 O10b 4b 0.7895(2) 0.3630(2) 0.6020(2) 1 O11a 4b 0.8739(2) 0.2075(2) 0.3936(2) 1 O11b 4b 0.1383(2) 0.8017(2) 0.3938(2) 1 O12a 4b 0.8722(2) 0.1959(2) 0.8932(2) 1 O12b 4b 0.1235(1) 0.7790(1) 0.8923(2) 1
O13 4b 0.490(2) 0.1459(4) 0.0152(7) 0.155(2)d
O14a 2a 0.5 0.8271(3) 0.4961(4) 0.673(1)d
[image:22.612.93.502.177.704.2]Space group: Im11; Z = 8; a = 11.4161(1) Å, b = 11.2280(1) Å, c = 10.4974(1), α = 90.02(1)⁰, V = 1345.55(1) Å3; Rwp/Rp(NPD168) = 6.41/6.30%; Rwp/Rp(NPD90) = 2.90/3.60%; Rwp/Rp (Total) =
3.37/4.97%; and 2 = 4.72.
a
Occupancies of mixed La/Ca site were constrained to be unity and the total La/Ca = 6.56/1.44
b,c
Occupancy (Occ.) sum of O3a and O3b was constrained to be unity (Occ.O3a + Occ. O3b = 1), as
for O4a and O4b (Occ.O4a + Occ. O4b = 1).
d
The interstitial oxide content was constrained according to the charge-balanced nominal composition at 2.56 in
the unit cell.
Atom U11(Å2) U22(Å2) U33(Å2) U12(Å2) U13(Å2) U23(Å2) La/Ca1a 0.0055(5) 0.0058(4) 0.0060(4) 0.001(2) 0.0001(6) 0.0015(13) La/Ca2a 0.0207(5) 0.0295(5) 0.0369(6) -0.008(2) -0.0039(7) 0.001(2)
La/Ca3aa 0.053(2) 0.053(1) 0.056(1) 0 0 -0.002(2)
La/Ca3ba 0.0065(10) 0.0060(9) 0.0066(10) 0 0 0.001(1) La/Ca4aa 0.0134(11) 0.0132(10) 0.0205(11) 0 0 -0.004(1) La/Ca4ba 0.0256(11) 0.0122(10) 0.0348(10) 0 0 0.005(1) Ga1a 0.0092(5) 0.0093(5) 0.0103(4) -0.0004(5) 0.003(2) 0.004(2) Ga1b 0.0099(5) 0.0090(5) 0.0175(5) 0.0034(5) 0.007(2) -0.005(2) Ga2a 0.0237(6) 0.0361(7) 0.0260(7) 0.001(2) -0.002(1) -0.014(2) Ga2b 0.0056(5) 0.0136(5) 0.0079(3) 0.001(1) -0.0020(5) -0.007(1)
Ga3a1 0.0069(9) 0.0114(10) 0.0118(10) 0 0 0.0072(11)
Ga3a2 0.0084(10) 0.0027(9) 0.0059(9) 0 0 -0.0039(9)
Ga3b1 0.087(11) 0.0228(1) 0.0225(12) 0 0 -0.003 (1)
Ga3b2 0.0149(10) 0.0206(11) 0.0141(11) 0 0 -0.004(1)
O1 0.034(1) 0.034(1) 0.024(1) 0 0 -0.016(4)
O2 0.0113(10) 0.0146(10) 0.001(1) 0 0 0.001(3)
O3a/O3ba 0.0021(11) 0.026(2) 0.009(1) 0 0 0.009(2)
O4a/O4ba 0.048(2) 0.071(4) 0.037(2) 0 0 -0.010(3)
O5 0.0243(9) 0.0290(9) 0.0255(8) -0.006(3) -0.0030(9) 0.001(2) O6 0.0052(7) 0.0055(6) 0.0052(6) 0.001(1) 0.0003(7) 0.002(2)
O7a 0.019(1) 0.013(11) 0.0016(11) 0 0 0.001(1)
O7b 0.0018(11) 0.0019(1) 0.0018(1) 0 0 0.0002(5)
O8a 0.052(2) 0.034(2) 0.036(2) 0 0 -0.015(2)
O8b 0.0016(11) 0.0018(11) 0.0021(11) 0 0 0.0002(1)
O14a 0.018(2) 0.038(2) 0.018(2) 0 0 -0.003(3)
O14b 0.024(9) 0.47(4) 0.55(5) 0 0 -0.22(4)
a
ADPs of mixed La/Ca and disordered O3a/O3b, O4a/O4b pairs were constrained to be the same value.
Table S5.3 Selected inter-atomic distances and BVS calculations for La1.64Ca0.36Ga3O7.32 at room
temperature from the average model in monoclinic cell (S.G. Im11)
Bond Length(Å) Bond Length(Å)
La/Ca1 O5 2.485(2) (x1) Ga1a O11b 1.807(4) (x1)
O10a 2.498(3) (x1) O9b 1.803(3) (x1)
O1 2.507(2) (x1) O12a 1.825(4) (x1)
O10b 2.569(3) (x1) O10a 1.867(3) (x1)
O7a 2.595(3) (x1) BVS for Ga1a 3.10 O11b 2.639(3) (x1)
O7b 2.650(2) (x1) Ga1b O10b 1.808(4) (x1)
O11a 2.877(3) (x1) O9a 1.827(4) (x1)
BVS for La/Ca1 2.62/1.50 O11a 1.833(4) (x1)
O12b 1.853(4) (x1)
La/Ca2 O9a 2.437(3) (x1)
BVS for Ga1b
3.05
O2 2.470(2) (x1) Ga2a O4a 1.753(3) (x1)
O6 2.484(2) (x1) O4b 1.771(3) (x1)
O9b 2.550(3) (x1) O6 1.813(2) (x1)
O8a 2.590(3) (x1) O10b 1.857(3) (x1)
O8b 2.627(3) (x1) O10a 1.919(3) (x1)
O12a O12b
2.785(4) 2.842(3)
(x1) (x1)
BVS for Ga2a 3.02
BVS for La/Ca2 2.70/1.55 Ga2b O5 1.804(2) (x1) O3a 1.832(2) (x1)
La/Ca3a O3b 2.343(11) (x1) O3b 1.831(3) (x1)
O11a 2.479(3) (x2) O9b 1.870(3) (x1)
O7a 2.483(4) (x1) O9a 1.854(3) (x1)
O6 O14a
2.585(3) 2.705(5)
(x2) (x1)
BVS for Ga2b 2.98
O3a 2.714(4) (x1) Ga3a1 O8a 1.814(4) (x1)
O9b 2.882(2) (x2) O1 1.845(5) (x1)
BVS for La/Ca3a 2.84/1.63 O11a 1.8874(3) (x2)
BVS for Ga3a1 2.84
La/Ca3b O3a 2.228(4) (x1) Ga3a2 O8b 1.791(3) (x1)
O3b 2.437(10) (x1) O1 1.853(5) (x1)
O7b 2.471(3) (x1) O11b 1.863(2) (x2)
O6 2.547(3) (x2) O13 2.169(5) (x2)
O11b O13
2.701(3) 2.694(8)
(x2) (x2)
[image:24.612.82.485.186.740.2]BVS for La/Ca3b 3.03/1.74 O2 1.845(5) (x1) O12a 1.875(3) (x2)
La/Ca4a O4b 2.279(6) (x1) O14a 2.127(4) (x1)
O14a O12a 2.457(6) 2.475(3) (x1) (x2)
BVS for Ga3b1 3.25
O8a 2.528(4) (x1) Ga3b2 O7b 1.813(3) (x1)
O4a 2.594(10) (x1) O12b 1.846(2) (x2)
O5 2.600(4) (x2) O2 1.860(5) (x1)
O10b 2.963(2) (x2) O14b 2.120(7) (x1)
BVS for La/Ca4a 3.15/1.81 BVS for Ga3b2 3.31
La/Ca4b O4a 2.381(10) (x1) O3a O3b 0.408(12) (x1)
O13 2.431(8) (x2) O14b 1.90(2) (x1)
O14b 2.49(3) (x1) O14a 2.452(5) (x1)
O8b 2.468(3) (x1) O3b O14a 2.155(12) (x1)
O12b 2.515(3) (x2) O14b 2.28(2) (x1)
O5 2.611(4) (x2) O4a O4b 0.663(13) (x1)
O10a 2.927(2) (x2) O13 1.891(12) (x2)
O4b 2.976(6) (x1) O4b O13 2.442(7) (x2)
[image:25.612.86.477.71.455.2]BVS for La/Ca4b 3.35/1.92
Figure S5.5 Projection view of the crystal structure along the c-axis in Im11 symmetry. The dashed line shows the „mirror plane‟. The A-site cations and oxygens overlapped with galliums were omitted
for clarity.
Figure S5.5 shows a view of the crystal structure along the c-axis. In the crystal structure, Ga1aO4
and GalbO4 tetrahedra are 4-connected with no terminal oxygens, the other GaO4 polyhedra are
connected with one non-bridging oxygen. Two interstitial sites O14a and O14b are located on the
“mirror” plane, O13 is disordered on either side of this plane. As in to La1.54Sr0.46Ga3O7.25, all the
interstitial oxides are closest to tetrahedra with terminal oxygen, namely Ga3a2O4, Ga3b1O4, and
Ga3b2O4. Ga2a and Ga2b are also 3-connected with disordered bridging oxygen pairs of O4a/O4b and
O3a/O3b, respectively. There is no interstitial oxide connected to Ga2a and Ga2b, leaving the
candidate interstitial sites empty inside the channels neighbouring the occupied interstitials.
5.4 Triclinic cell with space group of P1
The optimized refinement in triclinic P1 (Rwp/Rp = 3.21/4.60%, and 2 = 4.28, Figure S5.6)
exhibited four distinct interstitial sites with total population of 1.28 as listed in Table S5.4. Compared
with the crystal structure in monoclinic symmetry Im11 (Section 5.2), all the interstitial oxides are incorporated into GaO4 tetrahedra with terminal oxygens. Four of the A-sites show cation ordering and
are occupied by La only - the occupancy of La was set to be one if it refined to be greater than 0.98.
The other four A-sites are disordered and the occupancies were refined to yield a total La/Ca ratio of
6.54/1.44 (Table S5.4). Refinement of a random A-site distribution (La/Ca = 0.82/0.18 for each site)
led to a poorer fit (Rwp/Rp = 3.49/4.84%, χ2 = 4.96), which recovered to the previous A-site cation order
Figure S5.6 Rietveld refinement of RT HRPD ND data for the average model in P1 from (a) backscattering (b) 90 degree bank. Three rows of vertical ticks mark the reflections from
La1.64Ca0.36Ga3O7.32, the vanadium container, and Ga2O3 from bottom to top, respectively
Table S5.4 Refined structural parameters for La1.64Ca0.36Ga3O7.32 at room temperature for the average
structure model in P1.
Atom Site x y z Occupancy
La1a 1a 0.2395(2) 0.0877(2) 0.8281(2) 1
La/Ca1b 1a 0.2390(2) 0.4077(3) 0.1503(2) 0.814(1)/0.186(1)a La2a 1a 0.7411(3) 0.5894(3) 0.8235(3) 1
La2b 1a 0.7325(2) 0.9107(3) 0.1506(2) 1
0.8
1.2
1.4
1.6
2.0
1.0
1.5
2.0
2.5
3.0
3.5
(b)
(a)
D-spacing (Å)
Nor
malised
coun
ts
Nor
malised
coun
[image:27.612.142.436.50.461.2]La3a 1a 0.5777(3) 0.2456(4) 0.3282(3) 1
La/Ca3b 1a 0.9118(3) 0.2640(3) 0.6550(3) 0.312(1)/0.688(1)a La/Ca4a 1a 0.0860(2) 0.7608(3) 0.3237(3) 0.623(1)/0.377(1)a La/Ca4b 1a 0.4022(3) 0.7509(2) 0.6536(2) 0.811(1)/0.189(1)a Ga1a 1a 0.2323(4) 0.7434(4) 0.9860(4) 1
Ga1b 1a 0.2346(4) 0.2472(5) 0.4888(5) 1 Ga1c 1a 0.7319(5) 0.2385(4) 0.9810(4) 1 Ga1d 1a 0.7409(4) 0.7462(4) 0.4935(4) 1 Ga2a 1a 0.0023(2) 0.6555(3) 0.6233(2) 1 Ga2b 1a 0.0086(3) 0.3778(3) 0.3556(3) 1 Ga2c 1a 0.5084(2) 0.1534(2) 0.6255(2) 1 Ga2d 1a 0.5042(2) 0.8835(3) 0.3487(2) 1 Ga3a1 1a 0.6189(2) 0.4804(2) 0.1354(2) 1 Ga3a2 1a 0.3202(2) 0.4781(3) 0.8359(3) 1 Ga3b1 1a 0.1240(3) 0.9855(3) 0.1354(3) 1 Ga3b2 1a 0.8247(2) 0.9825(3) 0.8407(3) 1
O1 1a 0.3942(4) 0.4074(4) 0.9853(4) 1
O2 1a 0.8924(3) 0.9002(3) 0.9812(3) 1
O3a 1a 0.6267(4) 0.0856(4) 0.5294(4) 0.618(5)b O3b 1a 0.5758(6) 0.0985(6) 0.4753(6) 0.382(5)b O4a 1a 0.0958(9) 0.5927(8) 0.5029(8) 0.272(12)c O4b 1a 0.0530(4) 0.5911(5) 0.4562(4) 0.728(12)c
O5a 1a 0.3367(3) 0.9809(3) 0.6249(3) 1
O5b 1a 0.3393(3) 0.7092(3) 0.3542(3) 1
O6a 1a 0.8382(3) 0.48417(29) 0.6314(3) 1
O6b 1a 0.8303(3) 0.2048(4) 0.3478(3) 1
O7a 1a 0.2877(3) 0.1566(3) 0.1268(3) 1
O7b 1a 0.0056(3) 0.1541(3) 0.8493(3) 1
O8a 1a 0.7779(3) 0.6501(3) 0.1216(3) 1
O8b 1a 0.5053(3) 0.6530(3) 0.8541(3) 1
O9a 1a 0.6767(4) 0.3178(5) 0.8344(5) 1
O9b 1a 0.6998(4) 0.8656(4) 0.3870(5) 1
O9c 1a 0.4697(4) 0.8887(4) 0.1435(4) 1
O9d 1a 0.4675(3) 0.3194(3) 0.5831(3) 1
O12b 1a 0.0763(4) 0.0306(5) 0.3111(4) 1 O12c 1a 0.6720(3) 0.0155(31 0.9100(3) 1 O12d 1a 0.6736(3) 0.7642(4) 0.6532(3) 1
O13a 1a 0.1577(9) 0.5008(8) 0.6453(8) 0.280(1)d O13b 1a 0.8211(6) 0.4903(10) 0.3172(10) 0.179(1)d O14a 1a 0.3346(6) 0.9991(5) 0.3248(5) 0.582(1)d O14b 1a 0.6181(15) 0.9872(12) 0.6746(11) 0.239(1)d
Space group: P1; Z = 4; a = 9.5735(1) Å, b = 9.5748(1) Å, c = 9.5691(1) Å, α = 106.78(1)°, β = 108.17(1)°, γ = 113.51(1)°, V = 672.85(1) Å3. Rwp/Rp%(ND168) = 6.08/5.84, Rwp/Rp%(ND90) =
2.77/3.33, Rwp/Rp%(Total)= 3.21/4.60, 2= 4.28. a
Occupancies of the mixed La/Ca site were constrained to be unity and the total La/Ca ratio 6.56/1.44
b,c
Occupancy sum of O3a and O3b was constrained to be unity (Occ.O3a + Occ. O3b = 1); the same to
O4a and O4b (Occ.O4a + Occ. O4b = 1).
d
The interstitial oxide content was fixed according to the charge-balanced nominal composition of 1.28 in the
unit cell.
O3a/3ba 0.0031(11) 0.0032(13) 0.0030(11) 0.0001(11) 0.0025(7) 0.0001(10) O4a/4ba 0.0493(15) 0.0486(18) 0.0525(17) 0.0093(14) 0.0316(11) 0.0203(14) O5a 0.0107(10) 0.0107(11) 0.0092(10) 0.0011(9) 0.0071(8) 0.0053(9) O5b 0.0262(12) 0.0304(13) 0.0338(14) 0.0192(10) 0.0183(9) 0.0164(11) O6a 0.0040(9) 0.0071(10) 0.0068(10) 0.0023(8) 0.0047(7) 0.0019(8) O6b 0.0245(12) 0.0283(14) 0.0211(12) 0.0084(11) 0.0111(9) 0.0164(11) O7a 0.0043(8) 0.0037(9) 0.0035(9) 0.0022(7) 0.0022(8) 0.0028(7) O7b 0.0203(12) 0.0195(11) 0.0222(11) 0.0065(10) 0.0071(10) 0.0145(8) O8a 0.0089(9) 0.0156(11) 0.0147(11) 0.0055(9) 0.0082(9) 0.0058(8) O8b 0.0209(11) 0.0210(12) 0.0331(14) 0.0136(9) 0.0097(11) 0.0101(10) O9a 0.0547(16) 0.0484(19) 0.0508(20) 0.0319(12) 0.0310(14) -0.006(2) O9b 0.0489(17) 0.059(2) 0.078(2) 0.0346(13) 0.0332(17) 0.016(2) O9c 0.0127(12) 0.0332(16) 0.0207(13) 0.0015(12) 0.0117(10) 0.0141(12) O9d 0.006(1) 0.0077(10) 0.0182(12) 0.0042(8) -0.0003(10) 0.0076(11) O10a 0.0533(17) 0.0207(13) 0.0267(14) 0.0184(12) 0.0116(14) 0.0213(10) O10b 0.0265(14) 0.0222(12) 0.0240(13) 0.0102(11) 0.0066(12) 0.0193(10) O10c 0.0156(11) 0.0398(17) 0.0193(12) 0.0071(12) 0.0148(10) 0.0140(13) O10d 0.0062(9) 0.0069(10) 0.0108(11) 0.0056(8) 0.0019(9) 0.0043(11) O11a 0.0456(16) 0.0501(18) 0.0596(19) 0.0254(13) 0.0262(15) 0.0391(15) O11b 0.0312(15) 0.0311(17) 0.0238(15) 0.0068(14) 0.0095(13) 0.0154(14) O11c 0.0057(9) 0.0053(10) 0.006(1) 0.0016(8) 0.0052(9) 0.0030(9) O11d 0.0164(12) 0.0159(14) 0.0270(13) 0.0009(11) 0.013(1) 0.0089(11) O12a 0.0252(11) 0.0200(12) 0.0321(13) 0.0167(9) 0.0222(11) 0.0209(12) O12b 0.0475(16) 0.0389(19) 0.0393(17) 0.0090(16) 0.0296(14) 0.0134(16) O12c 0.0046(9) 0.0032(10) 0.0063(10) 0.0016(8) 0.0046(9) 0.0025(9) O12d 0.0140(11) 0.0210(14) 0.0169(12) 0.0052(10) 0.0128(10) 0.0024(13) O13a/13ba 0.025(3) 0.025(3) 0.026(3) 0.013(2) 0.020(2) 0.008(2) O14a 0.035(2) 0.0115(18) 0.0145(19) 0.0155(14) 0.0122(17) 0.0114(12) O14b 0.37(2) 0.53(5) 0.35(3) 0.16(2) 0.257(15) -0.15(2)
a
ADPs for La/Ca on all sites and for O3a/O3b, O4a/O4b, O13a and O13b were constrained to be the
same value.
Table S5.5 Selected inter-atomic distances and BVS calculations for La1.64Ca0.36Ga3O7.32 at room
temperature from the average model in P1.
Bond Length (Å) Bond Length (Å)
La1a -O1 (x1) 2.482(4) Ga1a -O12a (x1) 1.810(6)
-O10d (x1) 2.505(2) -O10a (x1) 1.812(6)
-O10a (x1) 2.527(5) -O11c (x1) 1.815(5)
[image:30.612.95.509.632.730.2]-O7a (x1) 2.581(3)
-O7b (x1) 2.608(4) Ga1b -O10b (x1) 1.811(7)
BVS for La1a 2.58 -O11d (x1) 1.822(7)
-O12b (x1) 1.827(4)
La/Ca1b -O1 (x1) 2.483(5) -O9d (x1) 1.849(5)
-O10c (x1) 2.509(5) BVS for Ga1b 3.08
-O5b (x1) 2.536(4)
-O7a (x1) 2.587(4) Ga1c -O12c (x1) 1.814(5)
-O7b (x1) 2.608(3) -O9a (x1) 1.816(7)
-O10b (x1) 2.675(5) -O11a (x1) 1.841(7)
-O11c (x1) 2.704(4) -O10c (x1) 1.875(4)
-O11b (x1) 2.832(4) BVS for Ga1c 3.01
BVS for La/Ca1b 2.50/1.44
Ga1d -O9b (x1) 1.812(7) -O10d (x1) 1.814(5)
La2a -O2 (x1) 2.415(4) -O12d (x1) 1.826(6)
-O6a (x1) 2.450(5) -O11b (x1) 1.849(4)
-O9a (x1) 2.464(6) BVS for Ga1d 3.09
-O9d (x1) 2.498(3)
-O8a (x1) 2.618(4) Ga2a -O4a (x1) 1.778(10)
-O8b (x1) 2.638(5) -O10d (x1) 1.803(5)
-O12d (x1) 2.766(5) -O6a (x1) 1.805(4)
-O12a (x1) 2.924(4) -O4b (x1) 1.824(5)
BVS for La2a 2.77 -O10a (x1) 1.886(3)
BVS for Ga2a 3.10
La2b -O9c (x1) 2.417(5)
-O6b (x1) 2.468(4) Ga2b -O4a (x1) 1.772(7)
-O9b (x1) 2.510(6) -O4b (x1) 1.788(5)
-O2 (x1) 2.561(4) -O6b (x1) 1.805(4)
-O8b (x1) 2.588(3) -O10b (x1) 1.884(5)
-O8a (x1) 2.652(5) -O10c (x1) 1.907(5)
-O12b (x1) 2.706(4) BVS for Ga2b 2.96
-O12c (x1) 2.758(4)
BVS for La2b 2.76 Ga2c -O3b (x1) 1.781(7)
-O9a (x1) 1.794(3)
La/Ca3a -O3b (x1) 2.260(8) -O5a (x1) 1.803(3)
-O11a (x1) 2.433(6) -O3a (x1) 1.855(5)
-O7a (x1) 2.444(4) -O9d (x1) 1.902(5)
-O14a (x1) 2.552(6) BVS for Ga2c 3.06
-O6b (x1) 2.559(5)
-O11b (x1) 2.563(6) Ga2d -O3b (x1) 1.758(6)
-O13b (x1) 2.621(9) -O3a (x1) 1.761(3)
-O3a (x1) 2.826(6) -O9b (x1) 1.880(5)
-O9c (x1) 2.903(5) -O9c (x1) 1.906(5)
-O9d (x1) 2.960(5) BVS for Ga2d 3.01
BVS for La/Ca3a 2.88/1.66
Ga3a1 -O8a (x1) 1.803(4)
La/Ca3b -O3a (x1) 2.205(4) -O11a (x1) 1.841(6)
-O7b (x1) 2.492(5) -O1 (x1) 1.864(4)
-O6a (x1) 2.521(5) -O11b (x1) 1.870(5)
-O11c (x1) 2.570(3) -O13b (x1) 2.107(9)
-O13a (x1) 2.587(8) BVS for Ga3a1 3.30
-O3b (x1) 2.593(5)
-O6b (x1) 2.613(4) Ga3a2 -O8b (x1) 1.802(4)
-O11d (x1) 2.748(5) -O1 (x1) 1.820(5)
BVS for La/Ca3b 2.44/1.40 -O11d (x1) 1.868(3)
-O11c (x1) 1.888(4)
La/Ca4a -O4b (x1) 2.319(6) -O13a (x1) 2.127(9)
-O12a (x1) 2.403(5) BVS for Ga3a2 3.29
-O8a (x1) 2.516(3)
-O14a (x1) 2.551(5) Ga3b1 -O7a (x1) 1.805(4)
-O5a (x1) 2.579(3) -O12a (x1) 1.853(5)
-O5b (x1) 2.609(4) -O12b (x1) 1.855(5)
-O12b (x1) 2.657(6) -O2 (x1) 1.862(3)
-O4a (x1) 2.675(9) -O14a (x1) 2.177(6)
-O13b (x1) 2.777(8) BVS for Ga3b1 3.28
-O10d (x1) 3.032(4)
-O10c (x1) 3.059(4) Ga3b2 -O7b (x1) 1.809(4)
BVS for La/Ca4a 2.85/1.64 -O2 (x1) 1.823(4)
-O12d (x1) 1.866(3) La/Ca4b -O14b (x1) 2.276(11) -O12c (x1) 1.878(5)
-O4a (x1) 2.352(7) -O14b (x1) 2.143(13)
-O8b (x1) 2.476(4) BVS for Ga3b2 3.28
-O12c (x1) 2.519(2)
-O12d (x1) 2.551(5) O3a -O3b (x1) 0.670(7) -O13a (x1) 2.554(8) O4a -O4b (x1) 0.495(9) -O5a (x1) 2.581(4)
-O5b (x1) 2.608(4) O13a -O4a (x1) 1.894(12) -O4b (x1) 2.720(4) O13b -O4b (x1) 1.827(6) -O10b (x1) 2.746(4) O14a -O3b (x1) 1.922(7) -O10a (x1) 2.951(5) O14b -O3a (x1) 1.895(13)
La2a La1a
La3a
La/Ca4a La/Ca4b
La/Ca1b
La2a La3a La/Ca3b
La2b
La/Ca3b
La2b La1a
La/Ca4a La/Ca4b La/Ca1b
O13b
O13a
O14a
O14b
(a)
C1
C2
C3
C4
C5
C6
C7
C8
La2b
La2a
La/Ca4a
La/Ca4b
La/Ca1b La/Ca3b
La3a La/Ca4a
La/Ca4b
La1a
La2b
La2a
O14a O13b
O14b O13a
O13b
O13a
O14a
O14b
2.55 2.55 2.62 2.78
2.28 3.10 2.59 2.55
(c)
Figure S5.7 (a) Parallel polyhedral view and (b) projection view along the [110] direction of
La1.64Ca0.36Ga3O7.32 (P1, average model) to show the A site cation location and ordering. The A site
cations fill the Ga3O7 interlayer space and sandwich the interstitial sites in the 5-rings. (c) Parallel view
of the highlighted part in (b) to show ordered cations and their distances to interstitial oxide, where the
Ga and framework oxygens were omitted for clarity. Paired interstitials O13a/O14b and O13b/O14a are
shown as red and green spheres in (b) and (c), respectively. La-sites, yellow; La/Ca-sites, blue;
La/Ca1b = 0.814(1)/0.186(1), La/Ca3b = 0.312(1)/0.688(1), La/Ca4a = 0.623(1)/0.377(1), La/Ca4b =
[image:34.612.152.472.57.351.2](a)
O14a
Ga3b1 (2.18)
La/Ca4a (2.55)
(2.55) La3a
O9c (2.69)
O3b (1.92)
O5a (2.92) Ga2c (2.42) O5b (2.89)
Ga2d (2.30) Ga1a (3.00)
(2.44) O12a
O12b (2.57)
O9d (2.77) O7a (2.78)
O14a
Ga3b1 (2.18)
La/Ca4a (2.55)
(2.55) La3a
O9c (2.69)
O3b (1.92)
O5a (2.92) Ga2c (2.42) O5b (2.89)
Ga2d (2.30) Ga1a (3.00)
(2.44) O12a
O12b (2.57)
O9d (2.77) O7a (2.78)
[image:35.612.165.452.52.559.2](b)
Figure S5.8Projection view of La1.64Ca0.36Ga3O7.32 in P1 along [110] direction to show (a) the location
of interstitial oxides and atomic displacement parameters (ADPs, 80% probability shown) within the
rings and (b) the environment of O14a within 3Å in the average structure. The numbers denote the
distances from each atom to O14a. Local atomic displacements of La3a, La/Ca4a, O3b, O12a, and
O12b towards La3aL, La/Ca4aL, O3a, O12aL, and O12bL due to the O14a incorporation are marked by
arrows.
Ga3b2
Ga3b1 Ga3a1
Ga3b2
Ga3a2
Ga3a1
Ga3b2 Ga3a2
Ga3b1
C1 C2
C3
C4
C5
C6
C7
C8
O4a O4b
O13b
O13a
O14a
O14b O3a O3b
6. Simulated annealing (SA) approach
To validate the structure model (P1) from the least-squares Rietveld refinement, simulated annealing (SA) analysis was performed. Peak shape and background parameters were obtained by Le
Bail refinement of the NPD data from the 90º and backscattering banks of detectors of the HRPD
instrument using TOPAS3, with a single main melilite phase. The standard simulated annealing macro
implemented within TOPAS was run using a fixed framework model from the GSAS Rietveld
refinement, with eight possible interstitial oxygen sites specified. The occupancies of these sites were
allowed to vary during the minimization, along with the La and Ca occupancies of the split A sites.
Penalty functions were specified to bias the total interstitial oxygen and La/Ca occupancies towards
previously obtained values constrained by the chemical composition. The SA result (Rwp = 6.78 %, Rp
= 7.72 %, χ2 = 4.32, Figure S5.2) is in good agreement with refined structure (Figure S5.1 and Table S5.2) and confirmed the reliability of the proposed structural model regarding the interstitial
[image:36.612.88.471.421.678.2]occupancies and A site cation ordering.
Figure S6.1Interstitial oxide location and population from the simulated annealing analysis with
C1
C2
C3
C5
C6 C4
C7
C8
O13a
O14a
O14b O13b
0.571
0.213 0.031
0.256
0.031
Figure S6.2SA plots for neutron data from backscattering (left) and 90o bank (right), respectively.
Table S6.1A-site La/Ca cation ordering extracted from the crystal structure from different approaches
(1% error of occupancy), a) GSAS Rietveld refinement (La/Ca = 6.56/1.44); b) TOPAS simulated
annealing (La/Ca = 6.61/1.39).
La/Ca1a La/Ca1b La/Ca2a La/Ca2b La/Ca3a La/Ca3b La/Ca4a La/Ca4b
a 1.00/000 0.81/0.19 1.00/0.00 1.00/0.00 1.00/0.00 0.31/0.69 0.62/0.38 0.81/0.19
b 0.99/0.01 0.91/0.09 1.00/0.00 0.94/0.06 1.00/0.00 0.35/0.65 0.60/0.40 0.82/0.18
7. Structure refinement for La1.64Ca0.36Ga3O7.32 in split model (triclinic P1)
In this split-site model, the relaxations around interstitials were modelled by introducing atomic
displacements as shown in Table S7.1-3. Ga3a1, O11a, O11b, and La3a were displaced to Ga3a1L,
O11aL, O11bL, and La3aS around O13b, including O4a in the local defect structure. Similarly, Ga3a2L,
O11cL, O11dL, La/Ca3bL, La/Ca4bL, and O4b are involved in the local defect structure around O13a,
Ga3b1L, O12aL, O12bL, La/Ca3aL, La/Ca4aL, and O3a around O14a, Ga3b2L, O12cL, O12dL, La/Ca4bS,
and O3b around O14b, respectively. This models the cases where an interstitial defect is present and
[image:37.612.65.563.377.421.2]Figure S7.1Rietveld refinement of RT HRPD ND data for the split-site model for La1.64Ca0.36Ga3O7.32
in P1 from (a) backscattering bank and (b) 90 degree bank. Three rows of vertical tick mark the reflections from La1.64Ca0.36Ga3O7.32, the vanadium container, and Ga2O3 from bottom to top,
respectively.
Table S7.1 Refined structural parameters for La1.64Ca0.36Ga3O7.32 at room temperature for the split-site
model in the triclinic cell (P1)
Atom x y z Uiso (Å2) Occupancy
La1a 0.2389(3) 0.0887(2) 0.8285(3) - 1
La/Ca1b 0.2381(2) 0.4102(3) 0.1501(2) - 0.825(1)/0.175(1)a
La2a 0.7381(4) 0.5852(3) 0.8259(4) - 1
La2b 0.7343(2) 0.9124(3) 0.1514(2) - 1
La3a 0.5747(11) 0.2569(8) 0.3257(10) 0.0411(6) 0.241(1)b La3aL 0.5747(5) 0.2394(5) 0.3306(5) 0.0411(6) 0.582(1)b,3
La3aS 0.5896(13) 0.2644(14) 0.3227(14) 0.0411(6) 0.177(1)b,2
La/Ca3b 0.9059(4) 0.2661(4) 0.6588(4) 0.0027(5) 0.227(1)/0.501(1)b D-spacing (Å)
Normali
zed c
ount
s
1.0 1.5 2.0 2.5 3.0 3.5
1.0 1.5 2.0 2.5 3.0 3.5
0.8 1.2 1.6 2.0 2.4
D-spacing (Å)
Normali
zed c
ount
s
2.3 2.4 2.5 2.6
0.8 1.2 1.6 2.0 2.4
D-spacing (Å)
Normali
zed c
ount
s
2.3 2.4 2.5 2.6
![Figure 1 (a) View of the average structure of the Ga3O7+x/2 network along the [110] direction for La1.64Ca0.36Ga3O7.32](https://thumb-us.123doks.com/thumbv2/123dok_us/8059524.225610/1.595.312.547.200.567/figure-view-average-structure-ga-network-direction-la.webp)
![Figure S3.2 SAED patterns for La1.64Ca0.36Ga3O7.32 along the (a) [001] axis where no extra reflections](https://thumb-us.123doks.com/thumbv2/123dok_us/8059524.225610/14.612.150.463.52.371/figure-saed-patterns-la-ca-axis-extra-reflections.webp)
 and [121](right) in P1 cell](https://thumb-us.123doks.com/thumbv2/123dok_us/8059524.225610/15.612.96.516.87.298/figure-hrtem-la-ca-ga-left-right-cell.webp)