Optimization of Biochar Preparation from Acacia
Wood for Soil Amendment
Pinitpon Pituya1,2, Thavivongse Sriburi3, and Saowanee Wijitkosum4,*
1 Inter-department of Environmental Science, Graduate School, Chulalongkorn University, Bangkok 10330,
Thailand
2 Huaysai Royal Development Study Center, Petchaburi 76120, Thailand 3 Chula Unisearch Center, Chulalongkorn University, Bangkok 10330, Thailand
4 Environmental Research Institute, Chulalongkorn University, Bangkok 10330, Thailand
*E-mail: W.m.Saowanee@gmail.com (Corresponding author)
Abstract. Biochar was prepared from Acacia wood by slow pyrolysis process under different conditions in order to determine the optimum condition of the pyrolysis temperature and time. The temperature was varied from 300 - 500 OC meanwhile the time
was varied from 1-3 hours. The regression analysis was applied to investigate the relationship between surface area, APD, and pH of biochar (response variables) and the independent factors (temperature and time). The response surface methodology was used for determining the optimum condition of biochar preparation from Acacia wood. The relationship between all response variables and the pyrolysis temperature and time is fit to the first order linear regression model. The pyrolysis temperatures have the significant impact (at 95% confident interval) on the surface area and APD of biochar meanwhile the pyrolysis times do not. The optimum condition for preparing biochar from Acacia wood using the laboratory electrical furnace is at 434.8 OC, 1 hour of pyrolysis temperature and
time. In addition, the proposed range of the optimum pyrolysis temperature is 413 – 450
OC and the range of the optimum pyrolysis time is 1 – 2 hours.
Keywords: Biochar preparation, optimum condition, response surface methodology, Acacia wood.
ENGINEERING JOURNAL Volume 21 Issue 2 Received 26 May 2016
1.
Introduction
Biochar is the carbon-rich product obtained by heating the biomass in a zero or low oxygen environment called the pyrolysis process [1]-[3]. When biochar has been used for soil amendment, it can increase soil fertility and improve soil quality by raising soil pH, increasing moisture holding capacity, attracting more beneficial fungi and microbes, improving cation exchange capacity (CEC), and retaining nutrients in soil [4]-[5]. This characteristic depends on its properties which are affected by the pyrolysis condition and biomass characteristics. The application of biochar for the particular purpose is an important factor for specifying the properties of biochar. Applying biochar for the soil amendment at the sandy soil area requires the high surface area and average pore diameter (APD) of biochar in order to increase sorption ability of soil to retain soil nutrients and improve water holding capacity of soil.
Biochar preparation can be conducted via the pyrolysis process using the furnace which can control temperature and oxygen level such as the pyrolysis reactor or the laboratory electrical furnace. In practically, however, biochar used for agricultural purposes is prepared by the furnace invented according to the local wisdom concept such as the local furnace used at Huay Sai Royal Development Study Center located in Cha-am District, Petchaburi Province, Thailand that was invented by applying the controlled temperature retort for slow pyrolysis process [6]. The slow pyrolysis process is done under low-moderate temperature (450-650OC) with long residence time (2-3 hours) in the absence of oxygen [7]. The composition of product
from the slow pyrolysis process consists of 30% of bio-oil, 35% of biochar, and 35% of syngas [7]. By contrast, the fast pyrolysis process done under high temperature (700OC) with short residence time (in
second unit) in the absence of oxygen can produce 60% of bio-oil, 20% of biochar, and 20% of syngas [8] The properties of biochar; especially the surface area, are greatly impacted by the pyrolysis temperature. The surface area of biochar prepared from corn cob under different pyrolysis temperature (250-550OC)
varied from 1.86 to 30.57 m2/g [1]. In one study, surface area of biochar was shown to increase from 120
m2/g at 400OC to 460 m2/g at 900OC [9]. This effect of temperature has led to suggestion that biochar
prepared under slow pyrolysis (at low temperature) may be suitable for controlling the release of fertilizer nutrients [9].
In this article, the optimum pyrolysis conditions of biochar preparation have been studied. The prepared biochar will be used for soil amendment at Huay Sai Royal Development Study Center located in Cha-am District, Petchaburi Province, Thailand where they have faced sandy soil problems. Acacia wood; the tree growing sparsely at Huay Sai Royal Development Center area, was used as raw material of biochar preparation.
2.
Methodology
2.1. Raw Material and Biochar Preparation
The Acacia wood (Leucocephala glauca Benth.) was cut to 2 cm x 2 cm dimension in order to apply as the raw material for biochar preparation. The laboratory electrical furnace of Environmental Science Department, Faculty of Science, Chulalongkorn University was used for preparing the biochar by slow pyrolysis process at 300-500oC for 1-3 hours. The preparation of biochar was conducted by following the guideline provided
by International Biochar Initiative
2.2. Analysis of Properties of Biochar
The prepared biochar was investigated for the surface area, the average pore diameter (APD), and pH. The surface area of biochar was analyzed by using the scanning electron microscope (SEM). The APD was analyzed by multipoint Brunauer, Emmett and Teller (BET) method. The pH of biochar was measured by using pH meter.
2.3. Design of Experiment
The Response Surface Methodology with the 32 factorial experiment design was applied for determining
levels which are 300oC, 400OC, and 500oC. The pyrolysis time is also classified to three levels which are 1
hour, 2 hours, and 3 hours. Therefore, there are totally nine pyrolysis conditions. In addition, the considered response variables in this experiment are surface area (m2/g), APD (oA), and pH of biochar.
The determination of the relationship between the response variables and the considered factors was conducted by applying the regression analysis with the 95% confident interval. The results from the regression analysis were used for generating the response surface and calculating the optimum condition of biochar preparation from Acacia wood.
3.
Results and Discussion
3.1. Properties of Biochar Prepared from Acacia Wood
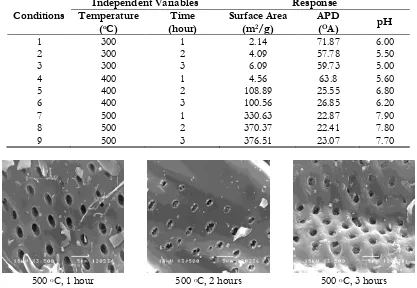
Table 1 presents the properties of biochar prepared from Acacia wood under nine different conditions. The surface area of biochar increased at the higher pyrolysis temperature. The highest surface area 376.51 m2/g
was produced at 500OC with 3 hours pyrolysis time. The surface area of biochar is the key indicator of
sorption ability of biochar [1]. By contrast, the APD of biochar decreased at the higher pyrolysis temperature. The higher APD benefits the adsorption of plant nutrient. The highest APD (71.87 oA) was
produced at 300oC with 1 hour pyrolysis time. Figure 1 presents the surface area and pore size of biochars
prepared from Acacia wood at 500OC with various time (1-3 hours) analyzed by SEM.
In addition, the pH of biochar prepared from Acacia wood trends to be weak acidic to weak basic (5.00 to 7.90). The weak acid to neutral pH of biochar is suitable for soil amendment at Huay Sai Royal Development Center area.
Table 1. Properties of biochar prepared from Acacia wood under nine different conditions.
Conditions
Independent Variables Response Temperature
(oC)
Time
(hour) Surface Area (m2/g)
APD
(OA) pH
1 300 1 2.14 71.87 6.00
2 300 2 4.09 57.78 5.50
3 300 3 6.09 59.73 5.00
4 400 1 4.56 63.8 5.60
5 400 2 108.89 25.55 6.80
6 400 3 100.56 26.85 6.20
7 500 1 330.63 22.87 7.90
8 500 2 370.37 22.41 7.80
9 500 3 376.51 23.07 7.70
500 oC, 1 hour 500 oC, 2 hours 500 oC, 3 hours
[image:3.595.92.503.391.681.2] [image:3.595.89.506.394.682.2]3.2. Regression Analysis
3.2.1. Surface area vs. temperature, time
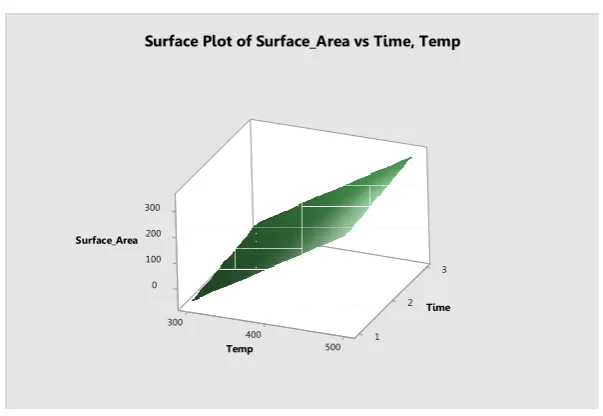
The results of regression analysis showed that the relationship between the surface area of biochar and temperature/time of pyrolysis fit to the first order linear regression model (R2 = 0.8268). In addition, the
pyrolysis temperature significantly affected the surface area of biochar at the 95% confident interval (P<0.05) meanwhile the pyrolysis time has no effect on surface area of biochar at the 95% confident interval (P>0.05). The regression equation of the relationship between surface area of biochar and temperature (X1), time (X2) is presented as Eq. (1). The surface plot of surface area vs. temperature/time is
shown in Fig. 2.
Surface area = 1.775X1 + 24.3X2 – 614 (1)
Fig. 2. Surface plot of surface area vs. temperature, time.
3.2.2. APD vs. temperature, time
The results of regression analysis showed that the relationship between APD of biochar and temperature/time of pyrolysis fit to the first order linear regression model (R2 = 0.7371). In addition, the
pyrolysis temperature significantly effects the APD of biochar at the 95% confident interval (P<0.05) meanwhile the pyrolysis time has no effect on APD of biochar at the 95% confident interval (P>0.05). The regression equation of the relationship between APD of biochar and temperature (X1), time (X2) is
presented as Eq. (2). The surface plot of APD vs. temperature/time is shown in Fig. 3.
APD = -0.2017X1 – 8.15X2 + 138.5 (2)
0 3 0
0 0 4 0
100 00 2
3 2 1 0 0 5 0
0 3
a e r A _ e c a f r u S
e m i T
p m e T u
[image:4.595.146.448.246.454.2]Fig. 3. Surface plot of APD vs. temperature, time.
3.2.3. pH vs. temperature, time
The results of regression analysis showed that the relationship between pH of biochar and temperature/time of pyrolysis fit to the first order linear regression model (R2 = 0.7794). In addition, the
pyrolysis temperature significantly effects the pH of biochar at the 95% confident interval (P<0.05) meanwhile the pyrolysis time has no effect on pH of biochar at the 95% confident interval (P>0.05). The regression equation of the relationship between pH of biochar and temperature (X1), time (X2) is presented
as Eq. (3). The surface plot of pH vs. temperature/time is shown in Fig. 4.
pH = 0.0115X1 – 0.1X2 + 2.100 (3)
Fig. 4. Surface plot of pH vs. temperature, time.
3.3. Response Surface Optimization
The results of regression analysis were applied to determine the optimum condition of biochar preparation from Acacia wood by using the response optimizer function in Minitab 17 software. The response variables; surface area, APD, and pH of biochar, were set the target value in order to determine the optimum condition. The goal of surface area and APD of biochar was set to the maximum value because the higher surface area and APD result in the higher sorption ability of biochar. Meanwhile, the target value
of pH of biochar was set to 7.00; the neutral condition that’s suitable for soil amendment at Huay Sai Royal Development Center area. The results from response optimizer indicated that the optimum condition for preparing biochar from Acacia wood using the laboratory electrical furnace is at 434.8 OC, 1 hour of
pyrolysis temperature and time. At this condition, the surface area of biochar is 182.3 m2/g (standard error
= 37.8), the APD of biochar is 42.68 (standard error = 5.88), and the pH of biochar is 7.00 (standard error = 0.281). The composite desirability of the optimum condition is 0.5821 (close to 1.0 is the best).
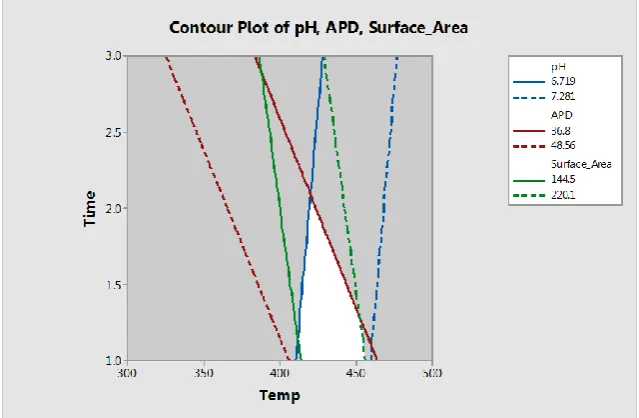
[image:6.595.137.457.217.426.2]In addition, the overlaid contour plot of the optimum surface area, APD, and pH of biochar was plotted in order to identify the range of the optimum condition within the standard error value as shown in Fig. 5. Figure 5 presents that the range of the optimum pyrolysis temperature is 413 – 450 OC and the range
of the optimum pyrolysis time is 1 – 2 hours.
Fig. 5. Overlaid contour plot of the optimum surface area, APD, and pH of biochar prepared from Acacia wood.
The optimum pyrolysis temperature obtained from this study conforms to the other research indicating that low-temperature biochars (<500oC), which have a less-condensed C structure, are expected to have a
greater reactivity in soils than higher temperature biochars and a better contribution to soil fertility [10]. In addition, high mineral-ash biochars produced at temperatures <500oC have, in some cases, have given
higher crop yields than more recalcitrant biochars produced at higher temperatures [11].
4.
Conclusion
The pyrolysis temperatures of biochar preparation have the significant impact on the surface area and APD of biochar meanwhile the pyrolysis times do not. The relationship between all response variables; surface area, APD, and pH, and the pyrolysis temperature and time is fit to the first order linear regression model. The optimum condition for preparing biochar from Acacia wood using the laboratory electrical furnace is at 434.8 OC, 1 hour of pyrolysis temperature and time. In addition, the proposed range of the optimum
pyrolysis temperature is 413 – 450 OC and the range of the optimum pyrolysis time is 1 – 2 hours.
However, the optimum condition studied in this research paper is for the preparation of biochar from Acacia wood using the laboratory electrical furnace which can control the impact of ambient condition such as the oxygen level. The pyrolysis condition applied for the on-site furnace such as the Metal Barrel Kiln furnace must be adjusted due to the impact of the oxygen level in the ambient air.
Acknowledgements
This research was funded by the 90th Anniversary of Chulalongkorn University fund (Ratchadaphiseksomphot
Chulalongkorn University, The Petroleum and Petrochemical College, Inter-department of Environmental Science and Department of Environmental Science, Faculty of Science, Chulalongkorn university. The raw materials were prepared at Huay Sai Royal Development Study Center.
References
[1] W. Zheng, B. K. Sharma, and N. Rajagopalan, “Using biochar as a soil amendment for sustainable agriculture,” Illinois Sustanable Technology Center, University of Illinois at Urbana-Champaign, 2010. [2] F. Verheijen, S. Jeffery, A.C. Bastos, M. van der Velde, and I. Diafas, “Biochar application to soils: A
critical scientific review of effects on soil properties, processes and functions,” JRC-IES, VA, Italy, 2010.
[3] J. Lehman and S. Josepth, “An introduction,” in Biochar for Environment Management. Sterling, VA: Earthscan, 2008, pp. 1-12.
[4] J. Lehman, J. Gaunt, and M. Rondon, “Bio-char sequestration in terrestrial ecosystems-a review,” Mit. Adapt. Strat. Global Chang., vol. 11, pp. 403-427, 2006.
[5] J. Lehman, “Bio-energy in the black,” Front Ecol. Environ., vol. 5, pp. 381-387, 2007.
[6] T. Sriburi, “Biochar researches for Soil Amendment at Pa-deng Biochar Research Center (PdBRC) (CC2941), Thailand,” in the 2011 International Symposium on Biochar for Climate Change Mitigation & Soil and Environment Management, Korea, 2011.
[7] S. Sohi, E. Lopez-Capel, E. Krull, and R. Bol, “Biochar, climate change and soil: A review to guide future research” CSIRO Land and Water Science Report Series, UK, 2009.
[8] East of England Development Agency (EEDA). (2009). Biochar and Carbon Sequestration: A Regional Perspective. [Online]. Available http://www.uea.ac.uk/polopoly_fs/1.118134!LCIC% 20EEDA%20BIOCHAR%20REVIEW%2020-04-09.pdf, Accessed on: March 16, 2012.
[9] D. Day, R. J. Evans, J. W. Lee, and D. Reicosky, “Economical CO2, SOx, and NPx capture from
fossil-fuel utilization with combined renewable hydrogen production and large-scale carbon sequestration,” Energy, vol. 30, pp. 2558-2579, 2005.
[10] S. Steinbeiss, G. Gleixner, and M. Antonietti, “Effect of biochar amendment on soil carbon balance and soil microbial activity,” Soil Biology & Biochemistry, vol. 41, pp. 1301-1310, 2009.