Article
Experimental Study for the Effect of Pre-Cooling the
Condenser Inlet Air of Split Type Air Conditioning
Unit
Safaa H. Faisal
1,a,*, Salman H. Hammadi
2,b, and Saif S. Mutlag
1,c1 Basra Engineering Technical College, Southern Technical University, Basra, Iraq 2 College of Engineering, University of Basra, Basra, Iraq
E-mail: a[email protected] (Corresponding author), b[email protected], c[email protected]
Abstract. Reducing electric power consumption is a critical issue, especially in areas with elevated temperatures such as Iraq. In Basra city, the electric power consumption, due to the air conditioning units (ACU), is extremely high. In this work, an evaporative cooling unit (ECU) is fabricated and tested, being retrofitted with the condenser part of a split-type air conditioner. The experimental procedure is done in Basra Engineering Technical College. The present work is categorized with two cases. In case one, the system runs without using the ECU, while in Case Two the system is tested with the ECU. Results show that decreasing the inlet air temperature to the condenser will reduce the condensation and evaporation temperatures. Furthermore, it decreases the compression pressure ratio and increases the refrigerant mass flow rate. With this modification, it is found that the consumption power is decreased by 26% and the COP increased by 90% compared with case one. The second law analysis of the modified system shows that using an ECU will decrease most of the exergy destruction and losses in the components. Only exergy destruction in the evaporator is increased. The second law system efficiency is improved by 69.5%.
Keywords: Energy and exergy analysis, air conditioning unit, evaporative cooler, air cooled condenser.
ENGINEERING JOURNAL Volume 22 Issue 5 Received 1 September 2017
Accepted 9 July 2018
1.
Introduction
Air conditioning units (ACU) based on the vapour compression cycle (VCC) have become one of the necessary requirements for a comfortable human life. Humankind may live in difficult environments that change with geographical locations and climates. Therefore, the use of ACU greatly facilitates the quality of people’s lives in difficult climatic conditions. However, such systems are considered one of the most power-consuming devices in current societies and they are the most common among the cooling cycles used in traditional buildings. The pure substance used as a working fluid in this cycle is Freon, which requires huge power to pressurize the gas in the compressor.
Increasing population growth and the dependence on ACU use in residential, commercial, and industrial sectors has led to tremendous energy consumption, especially in summer. A closer look at worldwide energy consumption shows vast ACU usage. For example, in Europe, ACU use represents 50% of the electrical energy consumption [1]. In the USA, it also represents about 50% of the power consumption [2]. In China, the power consumption in buildings has seen annual increases of about 10% in the last 20 years and in 2004, the constituted power was about 20.7% of the gross national energy consumption [3]. In the Middle East, the highest ratio of electricity consumption comes from ACU, which consume more than 70% of the total electrical energy [4]. Generally, the world’s power consumption was found to have risen by 58% between 2001 and 2005 [5].
In Iraq, since 2003, ACU use has frequently been based on the VCC in commercial and residential buildings. The split-type ACU is widely used in small and medium-sized buildings, e.g. houses, offices, universities and most governmental departments. Meanwhile, evaporative cooling method is considered as one of the oldest technique for air conditioning in Basra city. It is simple and need low electric power. However, its independently working is restricted for dry weather and the use in combination with other systems is not familiar yet.
The following are some literature related to this work. In (1993), Goswami et al [6] presented an experimental examination for the use of an indirect evaporative cooling method to enhance the VCC performance. The tested unit was a 2.5 T.R air conditioner system at the University of Florida. The data showed that an electric power saving of 20% can be achieved by using an evaporative condenser. Hu and Huang in (2005) [7] undertook experimental research of a split-type residential water-cooled air conditioner, which was coupled with a cellulose pad as a medium for the cooling tower. The experimental results showed that the coefficient of performance (COP) could be superior to that of the conventional ACU. Hajidavalloo and Eghtedari [8] in (2010) studied the performance of a split air conditioner experimentally and theoretically, in which the air-cooled condenser was equipped with an evaporator cooler. It was shown that by adopting such a modification, the COP system can be boosted by 50% and the electric power saving can be decreased by about 20%. In (2011), Jassim [9] experimentally investigated the improvement in consumption power and COP of a split-type ACU by adopting an ECU. The obtained experimental results demonstrated that the consumption power is decreased by about 18% and COP is increased by up to 73%. Mao-Yu Wen et al [10] in (2012) did an experimental investigation using six different materials in the evaporative cooler, coupled with an air-cooled condenser. They found natural wood pulp to be the best among the different types of materials selected. In (2014), Joseph and Thomas [11] presented the exergy analysis of the VCC supplied with an evaporative cooler. The dead state was fixed at a pressure of 1 atm and temperature of 308 K. Results showed that the modified system had around 36% improvement in the system’s exergy efficiency. Finally, Khalifa et al’s [12] experimental work, in (2017), on a small window-type air conditioner condenser used an unconventional refrigerant, R407C. The obtained experimental results revealed that raising the ambient air temperature has a harmful effect on the system’s COP.
From these reviewed papers, it can be seen that the indirect evaporative cooler is considered the most favourable choice to enhance the operation of ACU in hot seasons. However, it is believed that there is a need to apply and test this system in the real conditions of Basra city, since this should pave the way for future procedures to apply this modification, given Basra’s weather. Furthermore, it is found that there are few studies about the exergy analysis of the VCC coupled with the ECU. Many exergy analysis aspects need to be covered. For example, the effect of changing the ambient temperature on the duty of the individual components before and after the system modification. Additionally, the exergy losses for both the condenser and evaporator merit further investigation.
2.
Vapour Compression Cycle (VCC)
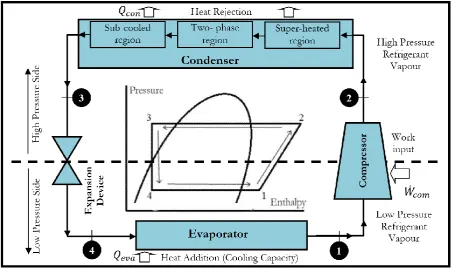
The basic components of VCC are shown in Fig. 1. The cycle consists of two pressure levels. The low-pressure side (or suction low-pressure) contains the evaporator, in which the refrigerant enters as a mixture of liquid and vapour and leaves as a saturated or superheated vapour. The refrigerant at this status enters the compressor. In the compressor, the pressure is raised to the highest level side (or discharge pressure). The high-pressure side contains the condenser, into which the refrigerant enters as a superheated vapour. The condenser coils are cooled; heat energy is removed, thereby converting the superheated vapour into a saturated or sub-cooled liquid. The sub-cooled liquid is transferred to a capillary tube, which balances the pressure ratio for the compressor. The refrigerant pressure and temperatures are dropped as they pass through the capillary tube. The resultant refrigerant is fed into the evaporator, then the cycle repeats [13].
Fig. 1. Schematic of vapour compression cycle (VCC) and its representation on P-h diagram.
3.
Evaporation Cooling Unit (ECU)
Principally, the ECU can be divided to direct, indirect or a compound of direct and indirect. The compound type is usually called a hybrid. The direct evaporative cooling is defined as the method of exchanging the sensible heat of air by the latent heat of water droplets’ evaporation. This could be done by spraying water droplets into the air or by using wetted surfaces. This technique can be used to cool buildings, especially in dry areas [8]. Ideally, the evaporative cooling process is adiabatic or a constant enthalpy process. This means that the sensible heat is extracted from the air for which the dry-bulb temperature is reduced while supplying an equal amount for the latent heat of water evaporation. As a result, the water is changed into a vapour phase.
4.
Energy and Exergy Analysis
[image:3.595.72.525.232.501.2]However, the current question is how far this COP is from the maximum COP that could be attained from the system. Furthermore, the components responsible for impeding the actual COP from reaching its maximum have to be determined. Such issues are answered by what is termed as exergy analysis, which introduces exergetic efficiency that takes into account all the losses that occur in a system. It has become a widely accepted useful tool for obtaining the improvement opportunities for the general performance of any thermal system, as well as its individual components [15]. Exergy analysis also helps in considering the important engineering conclusions regarding the design parameters of a thermal system. It has many advantages compared with the conventional energy balance method for the design and performance of any thermal system [16].
Concerning the VCC with the traditional energy balance analysis, it is not possible to show the true losses that prevent the system from reaching its top performance. The VCC expels a large amount of heat to the surroundings. The irreversibility is produced because of the difference in temperatures between the system and the surrounding air. This irreversibility reduces the performances of the system components. To improve the performance of the whole system, the location of these losses must be determined [15].
5.
Experimental Work
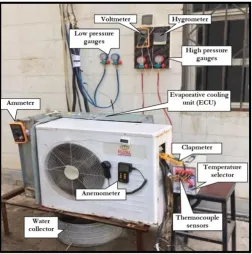
A photo for the experimental test rig is shown in Fig. 2. The experimental test is done in the Engineering Technical College of Basra, located in the west of Basra city (Latitude 30.536, longitude 47.815).
Fig. 2. Pictorial view of the test rig.
5.1. The Air-Condition Unit (ACU) Description
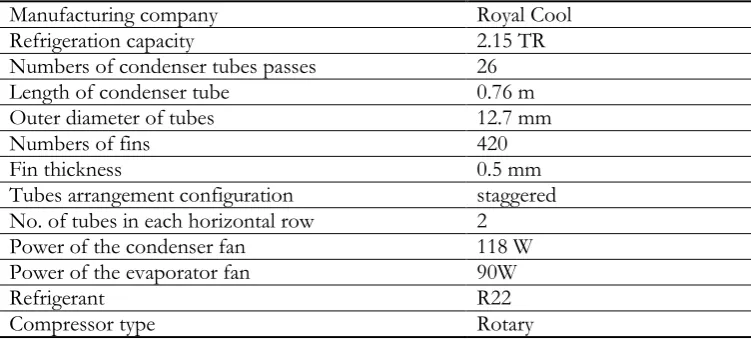
[image:4.595.172.425.328.583.2]Table 1. Specifications of the split-type ACU.
Manufacturing company Royal Cool
Refrigeration capacity 2.15 TR
Numbers of condenser tubes passes 26
Length of condenser tube 0.76 m
Outer diameter of tubes 12.7 mm
Numbers of fins 420
Fin thickness 0.5 mm
Tubes arrangement configuration staggered No. of tubes in each horizontal row 2
Power of the condenser fan 118 W
Power of the evaporator fan 90W
Refrigerant R22
Compressor type Rotary
5.2. The Evaporative Cooling Unit (ECU) Description
The ECU consists of the following parts:
I. The main truss: The ECU truss is fabricated from galvalume sheets. The truss design is done based on the geometry of the outdoor unit. Its dimensions are (80.5cm × 20cm× 72.5cm).
II. Media pad: The medium used is a cellulose pad, which is merely a small piece of wood. Cooling and humidification of air is done across this pad which is wetted by the water and it has a 4.2cm thickness. This thickness was also used by [17], which indicated 4.2cm as the optimum thickness.
III. Circulating water pump: This is used to pump the water from the basin located beneath the ECU to the top of the cellulose pad. This pump is specially selected to be remote controlled so that the operation of the (ECU) can be easily controlled. Its specifications are (220-Volts, 50 Hz, 20 W, and max head of 1.8m).
IV. Water pipe assembly: This system is made of plastic and its function is to spray water on the cellulose pad. The water pipe has a 1cm diameter and 1m length.
VI. The water collector: It is located at the bottom of the ECU and it collects the falling water from the top of the pad. The diameter of the water collector is 40cm and its capacity is 20 L.
VII. The basin: The basin is used to control and compensate the evaporative water. It is made from galvalume sheets.
5.3. Measuring Instruments
All the measurement instruments are explained below and their specifications are given in Table 2:
I. Thermocouple wires: In the present experimental study, K-type thermocouples are used to measure temperatures. The thermocouples are spot welded and inserted at nine different locations in the test rig. Special attention is given to inserting the thermocouple bulb so it will come into contact with the refrigerant. Seven of these thermocouples are installed inside the condenser tubes. The other two are installed at the inlet and outlet of the evaporator. A selector is used to choose among the various locations. A calibration process is done against a mercury thermometer.
II. Mercury thermometers: Three mercury thermometers are used to measure the air wet bulb temperature and dry bulb temperature for air at the inlet and outlet of the ECU and from the condenser.
III. Infrared thermometer: A digital infrared thermometer is used to measure the surface temperature of the condenser coil in regions that are difficult to measure via the thermocouple or mercury thermometer. IV. Hygrometer: A digital type Hygrometer (humidity meter) is used to measure the air humidity for the air at
the inlet and outlet of the ECU.
[image:5.595.107.483.104.274.2]VII. Anemometer: This is used to measure the velocity of the outlet air from the condenser. VIII. Electric Multi-meters: Three types of electric multi-meters are used for electrical measurement.
Table 2. Specifications of measuring instruments.
Type/Model Resolution Accuracy Range
Digital Thermometer K-type-
Model: Aswar G890 0.1°C ±1% -40 to +400°C
Mercury Thermometer Model: MF001 1°C 0.5℃ 0-100℃
Infrared Thermometer Digital Type
Model: Fluk 62 1°C 0.5°C -30℃-500℃
Hygrometer Digital type
Model: AR807. 0.01% ±2% 0-95%
Borden Pressure Gauges Low pressure side:
Model: Hong sen 457 0.068 bar 0.034 bar 0-17.5bar High pressure side:
Model: Hong sen 457 0.34 bar 0.17 bar 0-50 bar
Anemometer Digital Type
Model: GmbH AR826 0.1 m/s ±3%. 0- 45 m/s
Clamp Meter Digital Type
Model: MT87 0.01A ±1.0% 1-400A
Ammeter Digital Type
Model: BEVAV72 0.1 A ±0.5% 0-20 A
Voltmeter Digital Type
Model: DH-670 1 V ±5% 0-700 V
5.4. Experimental Procedure
In the experimental work, two states of operation are studied, these are:
Case 1: The test rig runs without using the ECU. Case 2: The test rig runs with the ECU.
For the two cases, all the measuring instruments are checked to ensure they are connected to their proper locations. Then, before employing the ECU, the following steps are followed:
1. Run the ACU without using the ECU. Wait until steady state condition is reached by viewing temperature measurement.
2. After reaching the steady state, the following readings are recorded: -Pressure readings at the inlet and outlet of the condenser and evaporator. -Temperature distribution in the condenser, tube wall, and fins surface.
-The dry and wet bulb temperature in addition to the relative humidity for the ambient air. -Voltage and current consumed by the ACU.
For the second case, when the ECU is employed, the following steps are followed:
1. At the beginning, the main tank of the ECU is checked to ensure it is filled with pure water. 2. Run the circulating water pump to spray the water on the media pad.
6.
Experimental Analysis
6.1. First Law Analysis (Energy Analysis)
Firstly, the thermodynamic properties of the refrigerant at points (1 to 4) can be valued by using the measured pressure and temperature.
The power input to the compressor is calculated using the measured voltage 𝑉 and current 𝐼 by:
𝑊̇𝑡𝑜𝑡= 𝑉 ∗ 𝐼 ∗ 0.85 (1)
Where the factor (0.85) represents the recommended power factor [18].
The power consumption of the compressor (𝑊̇𝑐𝑜𝑚) represents the major part of the total power consumed. The other power items are the evaporator and condenser fans (𝑊̇𝑓𝑎𝑛,𝑒𝑣𝑎, 𝑊̇𝑓𝑎𝑛,𝑐𝑜𝑛) as well as the power consumed by the water pump (𝑊̇𝑝𝑢𝑚), i.e.:
𝑊̇𝑡𝑜𝑡= 𝑊̇𝑐𝑜𝑚+ 𝑊̇𝑓𝑎𝑛,𝑒𝑣𝑎+ 𝑊̇𝑓𝑎𝑛,𝑐𝑜𝑛+ 𝑊̇𝑝𝑢𝑚 (2)
The total power saving for the ACU, as a result of using the ECU, may be calculated as follows:
𝑃𝑜𝑤𝑒𝑟 𝑠𝑎𝑣𝑖𝑛𝑔 𝑝𝑒𝑟𝑐𝑒𝑛𝑡𝑎𝑔𝑒 =𝑊̇𝑡𝑜𝑡,𝑤𝑖𝑡ℎ𝑜𝑢𝑡 𝐸𝐶𝑈− 𝑊̇𝑡𝑜𝑡,𝑤𝑖𝑡ℎ 𝐸𝐶𝑈
𝑊̇𝑡𝑜𝑡,𝑤𝑖𝑡ℎ𝑜𝑢𝑡 𝐸𝐶𝑈 ∗ 100% (3)
Now, the mass flow rate of refrigerant can be calculated as:
𝑚̇𝑟 =
𝑊̇𝑐𝑜𝑚. 𝜂𝑐𝑜𝑚
(ℎ2− ℎ1) (4)
Where 𝜂𝑐𝑜𝑚 is the total compressor efficiency that takes into account all mechanical and electrical losses (assumed 0.75) [18]. The mass flow rate of the cooling air (𝑚̇𝑎𝑖𝑟) can be calculated using the inlet air density (𝜌𝑎𝑖𝑟), velocity (𝑢𝑎𝑖𝑟,𝑜𝑢𝑡), and flow cross sectional area (𝐴𝑜𝑢𝑡) as:
𝑚̇𝑎𝑖𝑟= 𝜌𝑎𝑖𝑟∗ 𝑢𝑎𝑖𝑟,𝑖𝑛∗ 𝐴𝑜𝑢𝑡 (5)
The heat removed from the condenser can be calculated in terms of inlet and exit air temperatures (𝑇𝑎𝑖𝑟,𝑖𝑛𝑇𝑎𝑖𝑟,𝑜𝑢𝑡), air specific heat (𝐶𝑝𝑎𝑖𝑟), and mass flow rate of the cooling air (𝑚̇𝑎𝑖𝑟) as:
𝑄𝑐𝑜𝑛 = 𝑚̇𝑎𝑖𝑟∗ 𝐶𝑝𝑎𝑖𝑟 (𝑇𝑎𝑖𝑟,𝑜𝑢𝑡− 𝑇𝑎𝑖𝑟,𝑖𝑛) (6)
Now, the refrigerant mass flow rate (𝑚̇𝑟) can be re-calculated as:
𝑚̇𝑟 =
𝑄𝑐𝑜𝑛
ℎ2− ℎ3 (7)
This means there are two ways which lead to valuing the refrigerant mass flow rate (𝑚̇𝑟). The refrigerant mass flow rate is taken as the average value resulting from Eq. (4) and Eq. (7). The refrigeration capacity (𝑄𝑒𝑣𝑎) can be calculated as:
𝑄𝑒𝑣𝑎= 𝑚̇𝑟(ℎ1− ℎ4) (8)
𝐶𝑂𝑃 =𝑄𝑒𝑣𝑎
𝑊̇𝑡𝑜𝑡 (9)
The effectiveness of the ECU is defined as the actual temperature difference that occurs through it to the maximum temperature difference that can be attained from it. The maximum temperature difference occurs only when the exit temperature from the ECU is the wet bulb temperature related to the ambient dry bulb temperature (𝑇𝑤𝑏,𝑜). Generally, the effectiveness is given by the following formula [19]:
𝜀 =𝑇𝑜− 𝑇𝐸𝐶𝑈,𝑜𝑢𝑡
𝑇𝑜− 𝑇𝑤𝑏,𝑜 ∗ 100% (10)
Finally, the exergy analysis for each component can be performed as explained as follows.
6.2. Second Law Analysis (Exergy Analysis)
To analyse the performance of the VCC, based on the 2nd law of the thermodynamics, the exergy balance principle must be carried out. Moreover, the entropy balance is necessary to value the irreversibility of each component.
For a steady state open flow system, the exergy balance equation is given as below [20]:
Ψw= ∑ (1 −𝑇𝑂 𝑇𝑘) 𝑄𝑘+
𝑘
∑[(
𝑘=1
𝑚̇𝜓)𝑖𝑛− (𝑚̇𝜓)𝑜𝑢𝑡]𝑘− 𝑇𝑜𝑆𝑔𝑒𝑛 (11)
Where (Ψw) is the useful work done on or by the system. On the right-hand side, the first term is the net exergy that resulted from heat transfer (𝑄𝑘) on or from the system. The (𝑇𝑘) is the temperature of the heat sink or source at which the heat is transferred, while (𝑇𝑜) is the ambient air temperature. The term
∑[(𝑚̇𝜓)𝑖𝑛− (𝑚̇𝜓)𝑜𝑢𝑡] represents the flow exergy change of the working fluid and the third term
(𝑇𝑜𝑆𝑔𝑒𝑛) represents the irreversibility or the exergy destruction in the system where (𝑆𝑔𝑒𝑛) is the rate of entropy generation.
The flow exergy is given as:
𝜓 = 𝑚̇[(ℎ − ℎ𝑜) − 𝑇𝑜(𝑠 − 𝑠𝑜)] (12)
where 𝑆𝑜 and ℎ𝑜 represent the entropy and enthalpy at ambient conditions.
In fact, the exergy is always destroyed because of irreversibilities in the system. The exergy destruction in each process of the plant is written as [20]:
𝐼𝑑𝑒𝑠𝑡 = 𝑇𝑜𝑆𝑔𝑒𝑛 (13)
Where the entropy generation 𝑆𝑔𝑒𝑛 could be calculated using the entropy balance equation, which is:
𝑆𝑔𝑒𝑛 = 𝑚̇(𝑠𝑜𝑢𝑡− 𝑠𝑖𝑛) (14)
The second low efficiency is defined as the ratio of useful output exergy or recovered exergy to the input supplied exergy. The general second law efficiency definition is written as [20]:
𝜂𝐼𝐼 =𝐸𝑥𝑒𝑟𝑔𝑦 𝑜𝑢𝑡𝑝𝑢𝑡 𝐸𝑥𝑒𝑟𝑔𝑦 𝑖𝑛𝑝𝑢𝑡 = 1 −
𝐸𝑥𝑒𝑟𝑔𝑦 𝑙𝑜𝑠𝑠
6.2.1. Exergy balance of the compressor
The exergy balance for the compressor based on Eq. (11) is given by:
𝑇𝑜𝑆𝑔𝑒𝑛,𝑐𝑜𝑚 = 𝑚̇ [ (ℎ𝑟 1− ℎ2) − 𝑇𝑜(𝑠1− 𝑠2) ] + 𝑊̇𝑐𝑜𝑚 (16)
The entropy generation rate is:
𝑆𝑔𝑒𝑛,𝑐𝑜𝑚 = 𝑚̇ (𝑠𝑟 2− 𝑠1) (17)
Then the irreversibility is:
𝐼𝑑𝑒𝑠𝑡,𝑐𝑜𝑚= 𝑇𝑜𝑆𝑔𝑒𝑛,𝑐𝑜𝑚 = 𝑇𝑜[𝑚̇ (𝑠𝑟 2− 𝑠1)] (18)
6.2.2. Exergy balance of the condenser
The condenser exergy balance is also found by applying Eq. (11), which gives:
𝑇𝑜𝑆𝑔𝑒𝑛,𝑐𝑜𝑛= 𝑚̇ (𝜓𝑟 2− 𝜓3) + 𝑚𝑎𝑖𝑟̇ (ℎ𝑎𝑖𝑟,𝑖𝑛− ℎ𝑎𝑖𝑟,𝑜𝑢𝑡) − 𝑇𝑜(𝑠𝑎𝑖𝑟,𝑖𝑛− 𝑠𝑎𝑖𝑟,𝑜𝑢𝑡)
+ 𝑊̇𝑓𝑎𝑛,𝑐𝑜𝑛+ 𝑊̇𝑝𝑢𝑚 (19)
This equation is applicable no matter whether the condenser is evaporatively cooled or not. The entropy generation rate is:
𝑆𝑔𝑒𝑛,𝑐𝑜𝑛= 𝑚̇𝑟(𝑠3− 𝑠2) + 𝑚̇𝑎𝑖𝑟(𝑠𝑎𝑖𝑟,𝑜𝑢𝑡− 𝑠𝑎𝑖𝑟,𝑖𝑛) (20)
The irreversibility and exergy lost in the condenser is determined by the following equations:
𝐼𝑑𝑒𝑠𝑡,𝑐𝑜𝑛= 𝑇𝑜[𝑚̇𝑟(𝑠3− 𝑠2) + 𝑚̇𝑎𝑖𝑟(𝑠𝑎𝑖𝑟,𝑜𝑢𝑡− 𝑠𝑎𝑖𝑟,𝑖𝑛)] (21)
𝐼𝑙𝑜𝑠𝑡,𝑐𝑜𝑛 = 𝑚̇𝑎𝑖𝑟𝜓𝑎𝑖𝑟,𝑜𝑢𝑡 = 𝑚̇𝑎𝑖𝑟[ (ℎ𝑎𝑖𝑟,𝑜𝑢𝑡− ℎ𝑎𝑖𝑟,𝑜) − 𝑇𝑜(𝑠𝑎𝑖𝑟,𝑜𝑢𝑡− 𝑠𝑎𝑖𝑟,𝑜)] (22)
6.2.3. Exergy balance of the capillary tube
The exergy balance for the capillary tube is given by:
𝑇𝑜𝑆𝑔𝑒𝑛,𝑐𝑎𝑝= 𝑚̇𝑟(𝜓3− 𝜓4) (23)
Given that for throttling process (ℎ3= ℎ4). The entropy generation rate and the irreversibility are:
𝑆𝑔𝑒𝑛,𝑐𝑎𝑝= 𝑚̇𝑟(𝑠4− 𝑠3) (24)
𝐼𝑑𝑒𝑠𝑡,𝑐𝑎𝑝= 𝑇𝑜𝑆𝑔𝑒𝑛 = 𝑇𝑜[𝑚̇𝑟(𝑠4− 𝑠3)] (24)
6.2.4. Exergy balance of the evaporator
The exergy balance for the evaporator is given by:
𝑇𝑜𝑆𝑔𝑒𝑛,𝑒𝑣𝑎= 𝑚̇𝑟(𝜓4− 𝜓1) − (
𝑇𝑜− 𝑇𝑟𝑜
𝑇𝑟𝑜 ) 𝑄𝑒𝑣𝑎+ 𝑊̇𝑓𝑎𝑛,𝑒𝑣𝑎 (25)
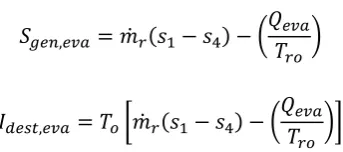
𝑆𝑔𝑒𝑛,𝑒𝑣𝑎 = 𝑚̇𝑟(𝑠1− 𝑠4) − (𝑄𝑒𝑣𝑎
𝑇𝑟𝑜 ) (26)
𝐼𝑑𝑒𝑠𝑡,𝑒𝑣𝑎= 𝑇𝑜[𝑚̇𝑟(𝑠1− 𝑠4) − (
𝑄𝑒𝑣𝑎
𝑇𝑟𝑜 )] (28)
Where (𝑇𝑟𝑜) is the room temperature. It is assumed to be the evaporator temperature plus 15 oC. The exergy lost in the evaporator (𝐼𝑙𝑜𝑠𝑡,𝑒𝑣𝑎) is determined by:
𝐼𝑙𝑜𝑠𝑡,𝑒𝑣𝑎 = (𝑇𝑜− 𝑇𝑟𝑜
𝑇𝑟𝑜 ) 𝑄𝑒𝑣𝑎 (27)
6.2.5. Cycle performance
The total exergy destruction in the VCC is the summation of exergy destruction in the different individual components of the system, i.e.:
𝐼𝑑𝑒𝑠𝑡,𝑡𝑜𝑡= 𝐼𝑑𝑒𝑠𝑡,𝑐𝑜𝑚+ 𝐼𝑑𝑒𝑠𝑡,𝑐𝑜𝑛+ 𝐼𝑑𝑒𝑠𝑡,𝑐𝑎𝑝+ 𝐼𝑑𝑒𝑠𝑡,𝑒𝑣𝑎 (28)
The second law efficiency of the whole system (𝜂𝐼𝐼,𝑡𝑜𝑡) is given by:
𝜂𝐼𝐼,𝑡𝑜𝑡= 𝑄𝑒𝑣𝑎 𝑊̇𝑡𝑜𝑡
(𝑇𝑜− 𝑇𝑟𝑜
𝑇𝑟𝑜 ) (29)
7.
Results and Discussion
The experimental data were recorded for five months that characterize the summer season in Basra city. These months are May, June, July, August and September. All the necessary calculations were done using the Engineering Equation Solver (EES) program [21].
7.1. Energy Performance Characteristics
The energy performance characteristics discussed in this section include consumption power, refrigeration capacity, and COP.
[image:10.595.199.371.91.167.2]
7.1.1. Consumption power
Figure 3 shows the variation of the consumption power with ambient temperature for the two cases. In both cases, the results show that increasing the inlet air temperature will increase the total input power dramatically. The increase in total power results from the increase in the condenser pressure which is caused by the higher inlet air temperature. The higher discharge pressure leads to a higher load on the compressor, keeping in mind that the power consumed by the compressor represents the main part of the total consumed power by the ACU. In fact, the compressor power has two impacts on the VCC operation. The first is the compressor pressure ratio and the second is the refrigerant mass flow rate. As such, an increase in the condenser pressure will cause the pressure ratio to increase, as shown in Fig. 4.
temperature of 54 oC. Actually, the change in condenser inlet air temperature resulting from adopting ECU and the way it varies with ambient temperature could explain the higher percentage of power saving that is achieved at lower ambient temperatures. This will be explained in section 7.1.3 that is related to the performance of ECU.
Fig. 3. Total power consumption vs. ambient
temperature. Fig. 4. Compressor pressure ratio vs. ambient temperature.
Fig. 5. Refrigerant mass flow rate vs. ambient
temperature. Fig. 6. Power saving of ACU using ECU.
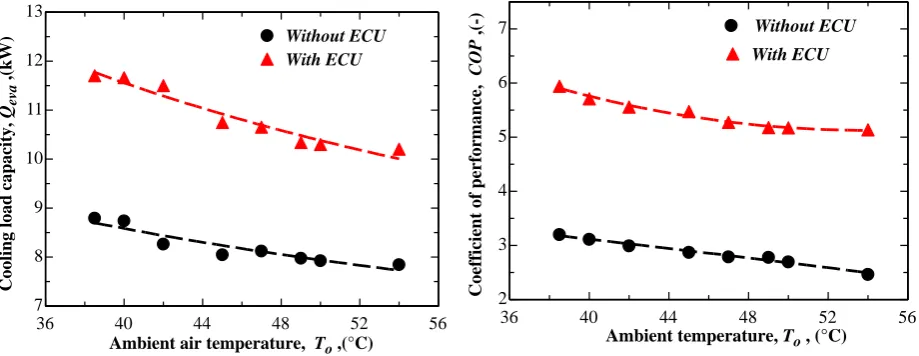
7.1.2. Cooling load capacity
Figure 7 shows the cooling load capacity obtained for the two cases as it varies with ambient temperature. This figure also reveals that the refrigeration effect decreases as the ambient temperature increases. This behaviour mainly is resulted from the increase in the evaporator temperature, which decreases the latent heat of evaporation. The increase in the evaporator temperature is directly affected by the increase in the condenser pressure which, by the capillary tube, is decreased to higher values corresponding to higher evaporation temperatures. The decrease of the refrigerant mass flow rate discussed before also contributes to the decrease in refrigeration capacity. Figure 7 indicates an improvement in refrigeration capacity for case two compared with case one. This is mainly due to decreasing the evaporator pressure (associated with decreasing the evaporator temperature) as well as increasing the refrigerant mass flow rate.
36 40 44 48 52 56
2 2.4 2.8 3.2 3.6 P o w er c o n su m p ti o n ( k W )
Ambient temperature, To , (°C) Without ECU
With ECU
36 40 44 48 52 56
2 3 4 5 6 C o m p re ss o r p re ss u re r a ti o
Ambient temperature, To , (°C) With ECU
Without ECU
36 40 44 48 52 56
0.045 0.05 0.055 0.06 0.065 0.07
Ambient air temperature, To , (°C)
R ef ri g er a n t m a ss f io w r a te , mr, ( k g /s ) With ECU Without ECU
36 40 44 48 52 56
16 18 20 22 24 26 28 30
Ambient temperature, To (oC)
[image:11.595.70.527.144.315.2] [image:11.595.71.530.366.538.2]7.1.3. Coefficient of performance (COP)
Figure 8 explains the variation of COP for the two cases with ambient temperature. Both curves reveal that the ambient temperature has a negative impact on the system’s COP. This is mainly attributed to the higher consumption power of the system and the decrease in refrigeration capacity, as explained before. Figure 8 demonstrates an improvement in the system’s COP for case two. This improvement can be clearly seen since the energy consumption is decreased and the cooling capacity is increased.
Fig. 7. Cooling load capacity vs. ambient
temperature. Fig. 8. COP vs. ambient temperature.
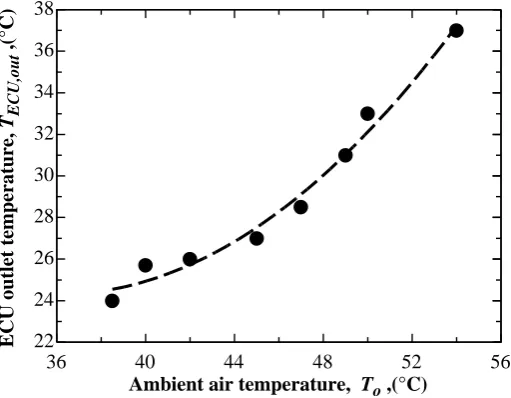
7.1.4. ECU performance
Figure 9 shows the air temperature exit from the ECU versus the ambient temperature. The figure demonstrates a decrease in the ambient temperature as it passed through the ECU, as expected. Raising the ambient temperature shows an increase in the exit air temperature. Several reasons are found to be responsible for this behaviour. Firstly, high ambient temperatures often occur in the period 12:00-2:00 pm. During this period of time, the combined outdoor unit coupled with the ECU will be directly exposed to the sun. This could increase the circulated water temperature used for the ECU. Certainly, the higher water temperature results in an increase of the outlet dry bulb temperature. Secondly, the ECU that is designed in the present study is working at fixed pad thickness and water mass flow rates. This situation tends to increase the dry bulb temperature at the outlet of cooling pad at higher ambient temperature due to lower heat and mass transfer coefficients. Finally, the ECU is working at constant volume flow rate of air. The original air fan of the outdoor unit is used to force air through the pad. At higher ambient temperate, the air density will be lower and then the air mass flow rate will be lower. Decreasing air mass flow rate and keeping ECU design parameters (pad thickness and water mass flow rates) will create higher air temperature difference between inlet and outlet of ECU. The reason for that is the time required for heat and mass transfer between air and water will be shortened.
The effectiveness of the ECU is shown in Fig. 10 as a function of the ambient temperature. By increasing the ambient temperature, the effectiveness of the ECU decreases. In fact, the outlet air temperature from the ECU has a direct effect on the efficiency of the ECU. As explained earlier, this variable depends on many parameters like ambient humidity, rate of circulated water, air velocity, and pad specification includes thickness, shape, and material type of the pad. The efficiency of the ECU could be enhanced so that the outlet temperature will approach the ambient wet bulb temperature. This could be done by changing the main parameters of the cooler like pad thickness, air velocity and water flow rate. Most of these parameters were not changed in this study.
36 40 44 48 52 56
7 8 9 10 11 12 13 C o o li n g l o a d c a p a ci ty , Qe va , (k W ) With ECU Without ECU
Ambient air temperature, To ,(°C)
36 40 44 48 52 56
2 3 4 5 6 7 C o ef fi ci en t o f p er fo rm a n ce , C O P , (-)
Ambient temperature, To , (°C) Without ECU
Fig. 9. ECU outlet air temperature vs. ambient temperature.
Fig. 10. The effectiveness for the ECU vs. ambient temperature.
7.2. Exergy Performance Characteristics
In this section, the exergy performance characteristics for the VCC, including exergy distribution and total second law efficiency, are discussed. Before that, the performance of the individual components is introduced.
7.2.1. Compressor performance
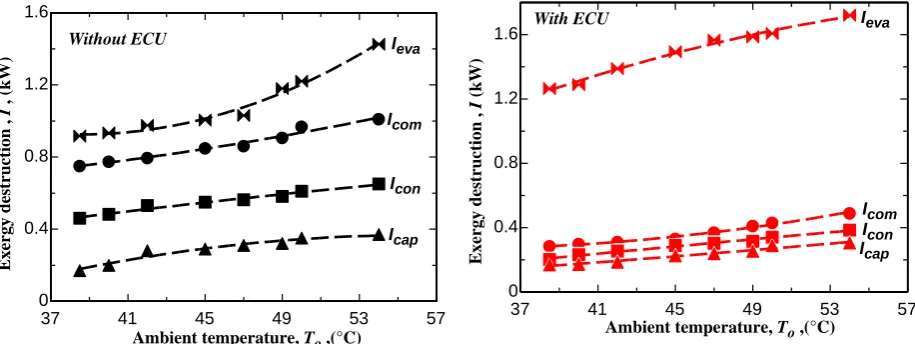
Figure 11 shows the variation of the exergy destroyed in the compressor with the ambient temperature for case one. The figure reveals that the higher temperature causes higher exergy destruction in the compressor. As modelled in the present analysis, all the compressor irreversibility is just internal. As such, this behaviour is clearly understood by examining Eq. (18), where both the ambient temperature and entropy difference between inlet and outlet are increased, thereby causing the exergy destroyed in this component to increase. Conversely, Fig. 12 shows the variation of the exergy destruction in the compressor for case two. The curve explains an increase in the exergy destruction with the increase in the ambient temperature at nearly the same rate as for case one. The exergy destruction in the compressor for case two is lower than for case one.
36 40 44 48 52 56
22 24 26 28 30 32 34 36 38
Ambient air temperature, To ,(°C)
E
C
U
o
u
tl
et
t
em
p
er
a
tu
re
,
TE
C
U
,o
u
t
,
(°
C
)
36 40 44 48 52 56
66 70 74 78 82
Ambient air temperature, To ,(°C)
E
ff
ec
ti
v
en
es
s
o
f
E
C
U
,
(%
[image:13.595.171.426.320.518.2]The reason for this behaviour is the decrease in the entropy difference between the inlet and exit. This increase in entropy generation is higher than the increase that occurred in the refrigerant mass flow rate.
7.2.2. Capillary tube performance
Figure 11 shows the variation of exergy destruction in the capillary tube with the ambient temperature for case one. As with the compressor irreversibility item, the exergy destroyed in this component also increases with the increase of the ambient temperature. The exergy destruction in the capillary tube represents the lower exergy destruction among the system components. In fact, the whole process in the capillary tube is irreversible, so there is no recovered exergy in this component. This makes the second law efficiency for this component zero.
Figure 12 shows the variation of exergy destroyed with the ambient temperature in the capillary tube for case two. Again, as with the compressor, the exergy destroyed in the capillary tube for case two is less than that for case one. However, the percentage decrease is lower than that for the one discussed previously. The reason for this behaviour is that the inlet condition for the capillary tube is always located in the sub-cooled region where there is no significant change in liquid properties.
Fig. 11. Exergy destroyed vs. ambient temperature
for Case 1. Fig. 12. Exergy destroyed vs. ambient temperature for Case 2.
7.2.3. Condenser performance
In the condenser, two exergy items are found. The first is the exergy destroyed in this component. This item mainly results from the heat transfer through the finite temperature difference from the hot fluid to the cooled fluid. The second one is characterized by the exergy lost to the environment. This item is represented by the flow exergy of the hot air leaving the condenser.
Figure 11 shows the variation of exergy destroyed in the condenser with the ambient air temperature for case one. As per the other irreversibility items, a higher ambient temperature causes higher exergy to be destroyed in the condenser. Examining Eq. (21) shows that both increasing the ambient temperature together with a higher entropy difference for both the air and refrigerant are responsible for this behaviour.
Figure 12 shows the exergy destruction in the condenser for case two as it varies with ambient temperature. As in the case of the compressor and capillary tube, the exergy destruction in the condenser for case two is lower than the exergy destruction in case one. Obviously, the decrease in the air temperature supplied to the condenser from ECU and its difference from the refrigerant are the main causes of this behaviour. As the temperature difference is minimum, the wasted work potential is lower.
Figure 13 shows the variation of exergy lost to the environment in the condenser with an ambient temperature for the two cases. In fact, increasing the ambient temperature will lead to an increase in the outlet air temperature. By increasing the outlet air temperature, its flow exergy will increase. As a result, the lower condenser outlet temperature for case two appears as a lower exergy lost.
37 41 45 49 53 57
0 0.4 0.8 1.2 1.6
Ambient temperature, To ,(°C)
E x er g y d es tr u ct io n , I , ( k W ) Icom Icon Icap Ieva Without ECU
37 41 45 49 53 57
0 0.4 0.8 1.2 1.6
Ambient temperature, To ,(°C)
[image:14.595.71.529.289.461.2]7.2.4. Evaporator performance
As in the case of the condenser, two exergy aspects are found, which are exergy destroyed and exergy lost to the environment. The main difference here is that the evaporator temperature is lower than the dead state temperature. This makes the evaporator a nominated heat sink for the heat that could be transferred from the surrounding.
Figure 11 shows the variation of exergy destroyed in the evaporator with the ambient temperature for case one. The behaviour of this curve is similar to the previous one. As such, by increasing the ambient temperature, the exergy destroyed in the evaporator will increase. The increase in the dead state temperature along with increasing the entropy difference leads to increasing irreversibility.
Figure 12 shows the variation of the exergy destroyed in the evaporator with the ambient temperature for case two. Unlike the one discussed previously, the exergy destroyed for the evaporator after using the ECU will be higher. The main cause of this is the decrease in the evaporator temperature, which is associated with a higher entropy difference as well as a higher cooling capacity. The increase in the refrigeration effect also appears as an increase in the exergy lost in the evaporator.
Figure 14 shows the variation of the exergy lost in the evaporator with the ambient temperature for the two cases. Surprisingly, the amount of exergy lost in the evaporator approaches the value of the exergy destroyed in the capillary tube as well as the exergy lost in the condenser. The increase in exergy lost in the evaporator in case two mainly resulted from the decrease in refrigeration effect.
Fig. 13. Condenser exergy lost vs. ambient
temperature. Fig. 14. Evaporator exergy lost vs. ambient temperature.
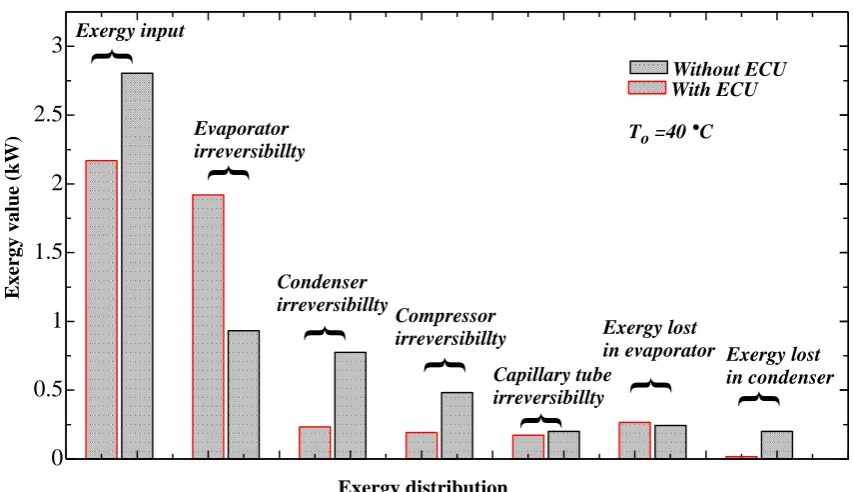
7.2.5. Exergy distribution
Figure 15 seeks to clarify the exergy distribution among the VCC components before and after using the ECU. The figure explains that the maximum irreversibility occurs in the evaporator. The compressor comes in the second order and the condenser is the next one. Finally, the capillary tube represents the minimum amount of exergy destroyed. However, the exergy lost in the evaporator is higher than that for the condenser.
The difference between the exergy destroyed and the exergy lost is that the exergy destruction is inherent in the VCC and there is no way to utilize it. The exergy lost is still available and could be utilized. Most of the components show a decrease in their exergy destructed, except that of the evaporator. It is noted that the input exergy itself will be decreased after the system modification. In respect of the exergy losses from the cycle, the exergy lost from the condenser is decreased from 6.31 to 0.7%. This is due to the decrease in the exit air temperature from the condenser. The exergy lost from the evaporator is increased from 8.6% to 12%, which is understood to be due to the increase in cooling capacity after using the ECU.
36 40 44 48 52 56
-0.1 0 0.1 0.2 0.3 0.4 0.5 C o n d en se r ex er g y l o st , Ilo st ,c o n ( k W
) Without ECU
With ECU
Ambient air temperature, To ,(°C)
36 40 44 48 52 56
0.2 0.4 0.6 0.8 1
Ambient air temperature, To ,(°C)
[image:15.595.76.532.327.536.2]Fig. 15. Exergy distribution of the VCC for the two cases.
[image:16.595.168.429.483.683.2]7.2.6. Total second law efficiency
Figure 16 shows the variation of the system second law efficiency with ambient temperature before and after using the ECU. The figure reveals that the exergy efficiency drops off by increasing the ambient temperature. This can be understood because of the sum of all exergy destroyed occurs in the VCC components. In addition, Fig. 16 indicates an improvement in the second law efficiency for case two. This explains the benefits of reducing the exergy destroyed in the system components. However, the data of the second law efficiency of the VCC components is still in the range of 39 to 21%, thereby indicating that an opportunity still exists to develop the cycle to reach the top COP.
Fig. 16. Total exergy efficiency versus ambient temperature. 0
0.5 1 1.5 2 2.5 3
Exergy distribution
E
x
er
g
y
v
a
lu
e
(k
W
)
Exergy input
Condenser irreversibillty
Compressor irreversibillty
Capillary tube irreversibillty
Exergy lost
in evaporator Exergy lost in condenser To =40 °C
With ECU Without ECU
}
}
}
}
}
Evaporator irreversibillty
}
}
36 40 44 48 52 56
Ambient air temperature, To ,(°C)
T
o
ta
l
ex
er
g
y
e
ff
ic
ie
n
cy
(
II
,t
o
t
)
(%
)
With ECU Without ECU
40
30
20
10
8.
Conclusions
The following conclusions are illustrated by the present study:
1. Decreasing of the inlet air temperature to the condenser will lead to decreasing the condensation and evaporation temperatures of the VCC. In addition, it decreases the compressor pressure and increases the refrigerant mass flow rate.
2. Using the ECU for ACU in Basra weather conditions results in saving power consumption by 26%, improving the cooling capacity by 32.9%, and enhancing the COP by 90%.
3. Using the ECU for ACU will lead to decreasing most of the exergy destroyed and losses in the components. Only exergy destruction in the evaporator will increase due to this modification.
4. Using the ECU for ACU in Basra weather conditions improves the system’s second law efficiency by 69.5%.
Acknowledgements
The authors are grateful to Basra Engineering Technical College, Basra, Iraq, for their support and help to complete this work.
Nomenclature
English Symbols
𝐴 Area (m2) 𝑠 Entropy (kW/K)
𝐶𝑝𝑎𝑖𝑟 Specific heat of air (kJ/kg.K) 𝑆𝑔𝑒𝑛 Entropy generation (kJ/kg.K)
ℎ Enthalpy (kJ/kg) 𝑇 Temperature (oC)
𝐼 Electric current (Ampere) 𝑢 Velocity (m/s)
𝐼𝑑𝑒𝑠𝑡 Exergy destruction (kW) 𝑉 Voltage (Volt)
𝑚̇ Mass flow rate (kg/s) 𝑊̇ Work energy (kW)
𝑄 Heat energy (kW)
Greek Symbols
𝜌𝑎𝑖𝑟 Density of air 𝜀 Effectiveness
𝜂 Efficiency 𝜓 Exergy flow
Subscripts
1. .4 Points on cycle 𝑖𝑛 Inlet
𝑎𝑖𝑟 Air 𝑜 Environment
𝑐𝑎𝑝 Capillary 𝑜𝑢𝑡 Outlet
𝑐𝑜𝑚 Compressor 𝑝𝑢𝑚 Pump
𝑐𝑜𝑛 Condenser 𝑟 Refrigerant
𝑒𝑣𝑎 Evaporator 𝑟𝑜 Room
𝑓𝑎𝑛 Fan 𝑡𝑜𝑡 Total
𝐼𝐼 Second law 𝑤𝑏 Wet bulb
Abbreviations
References
[1]
P. Martínez, J. Ruiz, C. G. Cutillas, P. J. Martínez, A. S. Kaiser, and M. Lucas, “Experimental
study on energy performance of a split air-conditioner by using variable thickness evaporative
cooling pads coupled to the condenser,” Applied Thermal Engineering, vol. 105, no. 25, pp.
1041-1050, Jul. 2016.
[2]
L. P. Lombard, J. Ortiz, and C. Pout, “A review on buildings energy consumption
information,” Energy and Buildings, vol. 40, no. 3, pp. 394-398, 2008.
[3]
Y. Yao and J. Chen, “Global optimization of a central air-conditioning system using
decomposition–coordination method,” Energy and Buildings, vol. 42, no. 5, pp. 570-583, 2010.
[4]
H. El-Dessouky, H. Ettouney, and A. Al-Zeefari, “Performance analysis of two-stage
evaporative coolers,” Chem. Eng. J., vol. 102, no. 3, pp. 255-266, 2004.
[5]
A. Sieminski, “International Energy Outlook 2014,” Energy Information Administration
(EIA), Washington, D.C., 2014.
[6]
D. Y. Goswami, G. D.
Mathur, and S. M. Kulkarni, “Experimental investigation of
performance of a residential air conditioning system with an evaporatiyely cooled condenser,”
ASME J. Sol. Energy Eng, vol. 115, no. 4, pp. 206-211, Nov. 1993.
[7]
S. Hu and B. Huang, “Study of a high efficiency residential split water-cooled air conditioner,”
Applied Thermal Engineering, vol. 25, no. 11, pp. 1599-1613, 2005.
[8]
E. Hajidavalloo and H. Eghtedari, “Performance improvement of air-cooled refrigeration
system by using evaporatively cooled air condenser,” Int. J. of Refrigeration, vol. 33, no. 5, pp.
982-988, 2010.
[9]
L. I. Jassim, “Enhancement the performance of condenser of split type air conditioning
system by using evaporative cooling,” Al-Ma'mon College J., no. 17, pp. 230-246, 2011.
[10] M. Y. Wen, C. Y. Ho, K. J. Jang, and C. H. Yeh, “Experimental study on the evaporative cooling of an air-cooled condenser with humidifying air,” J. Heat and Mass Transfer, vol. 50, no. 2, pp. 225-233, 2014.
[11]
J. Joseph and R. J. Thomas, “Exergy analysis on vapour compression refrigeration system
using evaporative condenser,” Int.J.of Scientific and Engineering Research, vol.5, no.7, Jul. 2014.
[12]
A. H. N. Khalifa, J. J. Fataj, and A. K. Shaker, “Performance study on a window type air
conditioner condenser using alternative refrigerant R407C,” Engineering Journal, vol. 21, no. 1,
pp. 235-243, Jan. 2017.
[13] I. Dincer and M. Kanoglu, Refrigeration Systems and Applications, 2nd ed. UK: John Wiley & Sons, 2010. [14] I. Dincer and M. A. Rosen, Exergy: Energy, Environment and Sustainable Development, 2nd ed. UK:
Elsevier, 2013.
[15] S. Anand, “Energy and exergy analysis of refrigeration systems,” Ph.D thesis, College of Engineering, Shri Mata Vaishno Devi University, Jammu & Kashmir, India, 2012.
[16]
M. A. Rosen, I. Dincer, and M. Kanoglu, “Role of exergy in increasing efficiency and
sustainability and reducing environmental impact,” Energy Policy, vol. 36, no. 1, pp. 128-137,
2008.
[17]
X. Hao, C. Zhu, Y. Lin, H. Wang, G. Zhang, and Y. Chen, “Optimizing the pad thickness of
evaporative air-cooled chiller for maximum energy saving,” Energy and Buildings, vol. 61, pp.
146-152, 2013.
[18]
D. R. Oughton and S. L. Hodkinson, Faber & Kell’s Heating and Air-Conditioning of Buildings,
10th ed. UK: Elsevier, 2008.
[19]
J. Wu, X. Huang, and H. Zhang, “Numerical investigation on the heat and mass transfer in a
direct evaporative cooler,” Applied Thermal Engineering, vol. 29, no. 1, pp. 195-201, 2009.
[20]
A. Y. Cengel and M. A. Boles, Thermodynamics, An Engineering Approach, 8th ed. New York:
McGraw Hill Companies, 2015.
Appendix A:
Error Analysis:
Table