University of Southern Queensland
Faculty of Engineering and Surveying
COST-EFFECTIVE 3D MODELLING
A dissertation submitted by
Bryan Patrick Walker
In fulfillment of the requirements of
Courses ENG4111 and 4112 Research Project
Towards the degree of
Bachelor of Engineering (Electrical and Electronic Systems)
University of Southern Queensland
Faculty of Engineering and Surveying
ENG4111 Research Project Part 1 & ENG4112 Research
Project Part 2
Limitations of Use
The Council of the University of Southern Queensland, its Faculty of Engineering and Surveying, and the staff of the University of Southern Queensland, do not accept any responsibility for the truth, accuracy or completeness of material contained within or associated with this dissertation.
Persons using all or any part of this material do so at their own risk, and not at the risk of the Council of the University of Southern Queensland, its Faculty of Engineering and Surveying or the staff of the University of Southern Queensland.
This dissertation reports an educational exercise and has no purpose or validity beyond this exercise. The sole purpose of the course "Project and Dissertation" is to contribute to the overall education within the student’s chosen degree programme. This document, the associated hardware, software, drawings, and other material set out in the associated appendices should not be used for any other purpose: if they are so used, it is entirely at the risk of the user.
Professor Frank Bullen
Dean
CERTIFICATION
I certify that the ideas, designs and experimental work, results, analyses and
conclusions set out in this dissertation are entirely my own effort, except where
otherwise indicated and acknowledged.
I further certify that the work is original and has not been previously submitted for
assessment in any other course or institution, except where specifically stated.
Bryan Patrick Walker
Student Number: Q97207691
______________________________________Signature
ABSTRACT
The use of Computer-Aided Drafting has led to the adoption of three dimensional
modeling into routine drafting practice. These three dimensional models have
enabled designers to build a “virtual object” which can be studied, analysed,
modified and duplicated prior to costly manufacture. This cycle enables a
reduction in risk for a design in terms of cost and schedule.
The construction of a three dimensional model can be a simple process. This
process basically involves four steps. The steps are:
a. an important feature of the real item is selected
b. physical measurement of the feature is conducted with an instrument such
as a ruler or vernier caliper,
c. this data is entered into the cad program, and
d. step (a) through (c) is repeated until the object is completely described in
the application.
These four steps are quite easy to execute for simple objects. But objects with
more complex shape require more features to be selected, more data to be
entered and possibly more sophisticated measuring equipment.
So the problem arises: Is there a method which can take a large number of data
points from a complex object and can this method be accomplished in a cost
effective manner?
The aim of this project is to develop a method of generating a three dimensional
resulting data from this model should be made suitable for use by common
industry software such as MATLAB or Autocad in order to demonstrate
usefulness of the design in areas such as virtual prototyping, non-contact
ACKNOWLEDGEMENTS
I wish to acknowledge and thank Professor John Billingsley, my project
supervisor for the help and guidance throughout this task.
I also acknowledge and thank Mr Harry Melnik and Mr Gavin Lewis of BAE
Systems for their help and encouragement.
Finally, to my wife Tricia, I owe my deepest gratitude. Her support and
encouragement were fundamental to completion of this project and indeed my
LIST OF FIGURES
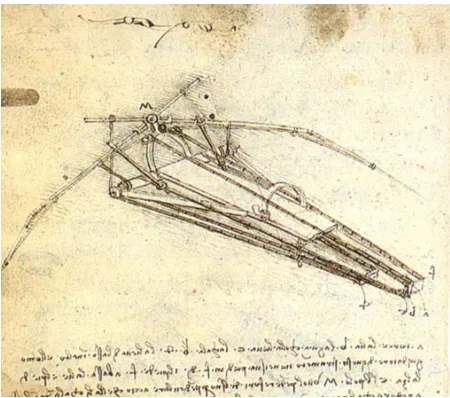
Figure 1.1 Leonardo's Flying Machine 12
Figure 1.2 CAD's Influence on the Design Process 14
Figure 1.3 Methodology of Project Execution 17
Figure 2.1 Cartesian Co-ordinate System 24
Figure 2.2 Cylindrical Co-ordinate System 25
Figure 2.3 Pinhole Camera Topology 27
Figure 2.4 Basic Triangulation Principle 28
Figure 2.5 A Three Dimensional Extension of the Basic Triangulation Principle 29
Figure 2.6 Triangle Method 32
Figure 2.7 Common Topologies with Scanned 37
Figure 4.1 Pinout of the AT90S8535 48
Figure 4.2 STK500 Development Board 49
Figure 4.3 Step Motor Drive Board Schematic 51
Figure 4.4 Turntable Assembly 53
Figure 4.5 Logitech Express Webcam 55
Figure 4.6 Laser Pointer 56
Figure 4.7 Embedded Software Flow 59
Figure 4.8 Step Motor Embedded Program Flow 60
Figure 4.9 Output Record Format 63
Figure 4.10 Main Form View 64
Figure 4.11 Camera Focus Dialog 66
Figure 5.2 Target Object 69
CONTENTS
Limitations ii
Certification iii
Abstract iv
Acknowledgements vi
List Of Figures vii
Chapter 1. Introduction 12
1.1. Project Background 12
1.1.1. Three Dimensional Modeling 14
1.2. Project Aim and Objectives 16
1.2.2. Project aims 16
1.2.3. Specific objectives 16
1.3. Project Methodology 17
1.4. Aspects of Ethical Responsibility 19
1.5. Dissertation Structure 22
Chapter 2. Conceptual Design 24
2.1. Co-ordinate Systems 24
2.1.1. The Cartesian Co-Ordinate System 24
2.1.2. The Cylindrical Co-Ordinate System 25
2.2. The Pinhole Camera 26
2.3. Triangulation 28
2.4. Relevant Literature 30
2.6. Constraints and Alternatives 37
2.6.3. Position Control System 38
2.6.4. Image Acquisition System 39
2.6.5. Host Or Main Control System 40
2.6.6. An Illumination Source 41
Chapter 3. Project Risk 44
Chapter 4. Detailed Design 47
4.1. Hardware Design and Implementation 47
4.1.1. Scanner control board 47
4.1.2. Step Motor Drive Board 50
4.1.3. Turntable 52
4.1.4. Optical Sensor 54
4.1.5. Light source 56
4.2. Software Design and Implementation 58
4.2.6. Embedded Software Development 58
4.2.7. Host Software Development 62
Chapter 5. Analysis and Performance 68
Chapter 6. Conclusions and Recommendations 71
6.1. Achievement of the Project Specification Objectives 71
6.2. Limitations of the Project 72
6.3. Recommendations and Further Work 73
References 75
References 75
Appendix B 79
Chapter 1.
Introduction
1.1.
Project Background
“Regardless of all the statements and the talk about what is the oldest profession
in the world, drafting is the only profession that historically can be documented.”
(ADA, 2006)
Engineering drawing, also known as drafting is a method of representing ideas
by the use of descriptive illustration. These illustrations communicate the method
or process detail required to bring ideas for everyday objects to reality. The
drafting process is ages old and is first recorded when ancient cavemen recorded
their hunting practices of on the walls of their caves.
Slowly, humans evolved and with them so did methods of drawing. The Arab
invasion of lower Europe in 720AD introduced the Chinese invention paper, to
the western world. This had a great impact on drawing as the act was no longer a
monastic endeavor conducted on animal skins and dried cane parchments.
[image:12.612.193.418.466.665.2]Drawing was now accessible to the masses.
One of society’s most recognizable drafters was engineer, scientist and inventor,
Leonardo Da Vinci. He lived between 1452 and 1519 and was responsible for
pictorial essays on many ingenious inventions- some which work and some
which could not.
Until recently, the basic equipment required to produce Engineering Drawings
was an accurate table, and the dexterous manipulation of instruments such as
squares and compasses. It was only with a high degree of skill that an accurate
drawing could be produced, as even the slightest misalignment of the equipment
would produce large errors. This made drafting a slow and tedious process.
The drafting machine was introduced to eliminate some of the tedium of
instrument handling. The use of the pantograph-like assembly gave drafters rapid
and repeatable access to reference angle at any place on the page.
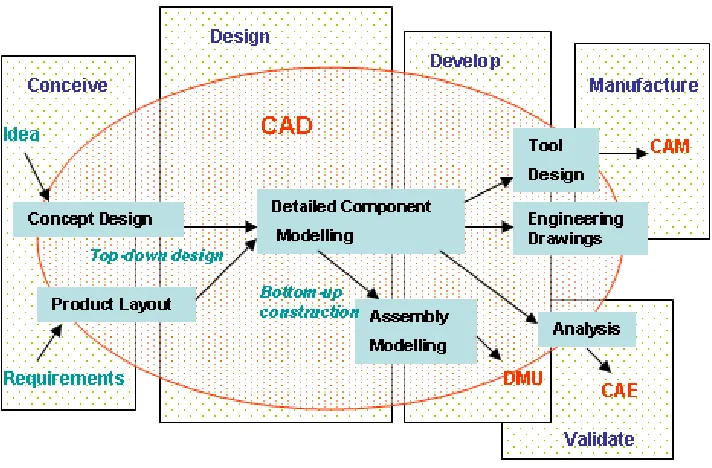
In recent times, computer technology has profoundly influenced the manner in
which Engineering Drawings have been conducted. Computer Assisted Design
(CAD) has been implemented in most aspects of design regardless of the scale.
Figure 1.2 shows just how many stages of the modern design process is
Source: WIKIPEDIA accessed www 26AUG07
Figure 1.2 CAD's Influence on the Design Process
The process of drawing, in an engineering context, has now evolved from a
largely manual and skill-intensive activity to one highly augmented by technology.
As a result, in many organisations, large offices once filled with expanses of
drawing machines and draftspersons have been replaced with fewer
multi-disciplined technicians and engineers operating powerful CAD stations.
1.1.1. Three Dimensional Modeling
One of the trends that has emerged as CAD programs became more powerful,
was the adoption of three dimensional modeling into routine drafting practice.
These three dimensional models have enabled designers to build a “virtual
manufacture. This cycle enables a reduction in risk for a design in terms of cost
and schedule.
The construction of a three dimensional model can be a simple process. This
process basically involves four steps. The steps are:
a. an important feature of the real item is selected;
b. physical measurement of the feature is conducted with an
instrument such as a vernier caliper;
c. this data is entered into the cad program; and
d. step (a) through (c) is repeated until the object is completely
described in the application.
These four steps are quite easy to execute for simple objects. But objects with
more complex shape require more features to be selected, more data to be
entered and possibly more sophisticated measuring equipment.
So the problem arises: Is there a method which can take a large number of data
points from a complex object and can this method be accomplished in a cost
effective manner?
In solving this problem, it seems intuitive to replace the human-dependant
operation with a mechanised operation. The logical approach to the problem is to
develop a machine that attempts mimic the steps that the human performs. The
machine must hence be able to recognize, manipulate and measure the object
1.2.
Project Aim and Objectives
1.2.2. Project aims
The aim of this project is to develop a method of generating a virtual 3
dimensional model of a small object using cheap and readily available
components. The resulting data output from the system should be made suitable
for use by common industry software such as MATLAB or Autocad to
demonstrate usefulness of the design in areas such as virtual prototyping,
non-contact metrology and artificial vision.
1.2.3. Specific objectives
The specific objectives of this project are:
a. to develop Visual Basic code to point a low power collimated light
source at a diffuse reflective surface;
b. to develop Visual Basic code to acquire the reflected beam (target)
using a commercially available Webcam and calculate the distance
of the reflection in front of a screen;
c. to develop code to then traverse the incident beam across the field
of view, and repeat the process outlined in (b); and
1.3.
Project Methodology
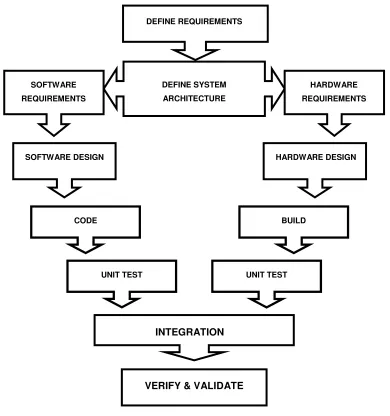
Prior to commencement of the design and build phase of the task, a strategy or
plan of attack was formulated. Figure 1.3 outlines the approximate methodology
[image:17.612.113.503.181.597.2]executed in this task.
Figure 1.3 Methodology of Project Execution
UNIT TEST
INTEGRATION
VERIFY & VALIDATE
UNIT TEST DEFINE REQUIREMENTS
CODE BUILD
DEFINE SYSTEM ARCHITECTURE SOFTWARE
REQUIREMENTS
HARDWARE REQUIREMENTS
Based on this methodology, the first step was to define the system level
requirements. From these requirements, an initial system level architecture could
be derived. Based on this architecture, it became apparent that system
development could be divided into two distinct disciplines, hardware and
software.
Sub-system level requirements, explicitly allocated to the two streams, were
developed as the design decomposition proceeded. Separate design activity
could be conducted for hardware and software sub-functions with the effects of
schedule and resource interdependency reduced. This was a distinct advantage
over a big bang approach.
These design activities proceeded in relative isolation as a result of the
decomposition of the design and the definition of sub-function interfaces.
Completion of sub-function design was evident with the completion of unit testing
for the sub-function.
The advantages of a staged approach were also exploited the project task
1.4.
Aspects of Ethical Responsibility
The concept of Ethical responsibility has been applied in many professional
endeavours for a long time. Most people at least aware of the centuries old
Hippocratic oath and have an idea of it’s impact on the medical profession. As
time passed, many of the values and ideals which underpinned the concept of
ethical responsibility had to be adapted to changing circumstances and
technologies. As an example, the concept of bioethics did not have a notable
impact until the 1960’s. (Lozano, 2003)
Other professions where a sense of ethical responsibility has been developed
include journalism, business science and research. Engineering is not alone.
Infamous examples of the failure of engineering as a profession to exercise
ethical responsibility include the Challenger disaster and the Bhopal accident.
This has led to leaders among the profession to adopt the approach ethical
aspects of engineering practice are not only important but critical.
In practicing engineering at any level effort should be made to ensure the activity
is performed with due respect to principles of human dignity, the environment
and ethical behaviour. This project in is an engineering effort.
This project aimed to minimise any environmental impact by either careful
selection of components which could potentially be recycled into other designs or
simplification of the design to minimise construction. As an example, selection of
a microcontroller was constrained to those types which can be flash programmed
and hosted on a commercial off the shelf (COTS) evaluation board. This strategy
custom circuit board and enabled potential redeployment of the microcontroller
and COTS evaluation board.
The risk Electromagnetic Interference as a result of poor EMI practices was
managed in accordance with common design practices. These practices included
design philosophies such as using only sufficiently high clock speeds and logic
family components to accomplish the task and good circuit layout. Also the use of
low as practical energy systems reduced consumption of power.
“Re-inventing the wheel” was deemed to be unnecessarily wasteful. Where a
technique or finding has been previously explored, it would be unnecessary
wasteful to replicate those conclusions unless some doubt is cast during
execution. Similarly, unless information derived from this task is appropriately
disseminated, subsequent project work conducted by other students will be at
risk of replicating effort already expended here. For this reason adequate prior
research was seen as a waste reduction strategy as was effective reporting of
the results.
Consequential effects of this research were considered. It was difficult to
pre-determine any potential impacts on fellow employees. The only possible impact
considered was some minor degree of anxiety due to a resistance to change.
The skill set required to draft in three dimensions are not yet strongly developed
within the existing engineering teams and some resistance to acquiring these
skills had already developed. This attitude has been underpinned with a record of
successful performance of engineering activity without the use of advanced
drafting techniques.
Another consequential effect was that on the customer. Under to the current
how many aspects of engineering. Currently the customer believes that much of
the legacy drawing cycle is an unnecessary expense and seeks reduce costs by
eliminating drafting effort by increasing the use of written and verbal disclosure.
In exercising this strategy, there have already been unsuccessful attempts to
adequately describe conceptual designs using words-only disclosure. A strategy
which seeks to return to a reliance on drafting would be likely to increase
financial risk and hence customer anxiety.
If can be demonstrated that a three dimensional model of a complex object can
be achieved inexpensively, then greater acceptance of three dimensional
modeling of all mechanical design could be supported. As a consequence of this
project, a company may be influenced to actually increase the rate of adoption of
these techniques. This will place the company at odds with both the employees
and the customer; making fellow engineers feel uncomfortable in doing tasks
they believe are unnecessary and the customer believing he is paying too much
for an engineering product.
Consequently, it would be prudent to engage both fellow engineers and the
customer in the development of the project. By informing all parties and even
have them participate, the potential outcomes of the task could become less
threatening. This would also enable a sense of contribution to the organisational
aims.
The instruments and techniques developed by this project may benefit persons
engaged in the development of weapons for war. As “Warfare is inherently
destructive of sustainability…”, any successful outcome would appear to be at
odds with the peaceful aspect of sustainability. Conversely, It could be argued
that an improvement in efficiency will reduce costs and may result in
many advances in peaceful science and engineering have been augmented by
technologies spun from defence-initiated research.
Another potential ethical risk would be the potential for deliberate inaccurate
disclosure by or knowingly take credit for others work. In the case of inaccurate
disclosure, these risks will not be realised, as all academic citing will be
conducted and raw data will be made available for review.
1.5.
Dissertation Structure
This dissertation is broken into 6 Chapters. The first chapter aims to set the
background of the task and define how the problem came to be.
Chapter 2 develops a Conceptual Design for the problem. This chapter explains
some important background information and concepts required to understand the
development of the solution. In this chapter the number systems and
mathematics required to understand the problem are introduced. Chapter 2 also
contains the Literature review which aims to look at how similar problems were
solved.
Chapter 3 is solely devoted to the risk issues of the task. It is by nature linked to
the aspects of ethical responsibility explained in Chapter 1 but is more specific to
The detail design is disclosed in Chapter 4. This chapter works through each
aspect of the design of both software and hardware.
Chapter 5 is discloses the results of subsystem and integration testing and
Chapter 2.
Conceptual Design
2.1.
Co-ordinate Systems
To describe a position of a point in three dimensional space a numerical
language was needed. Two systems were studied, The Cartesian and cylindrical
co-ordinate systems.
2.1.1. The Cartesian Co-Ordinate System
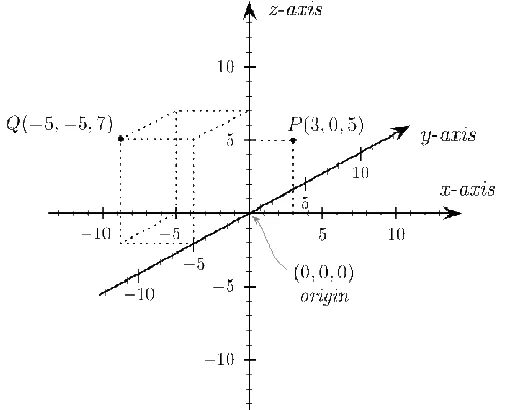
Cartesian co-ordinate systems are defined by three orthogonal axes x,y and z.
these axes correspond with three physical dimensions of length, width and
[image:24.612.181.434.450.655.2]height.
Figure 2.1 shows two points plotted in a three-dimensional Cartesian coordinate
system: P(3,0,5) and Q(−5,−5,7). The axes are conventionally drawn with the z
axis upright. This is also known as the world co-ordinate system.
Source: WIKIPEDIA accessed www 26AUG07
The displacement of a point in three dimensional space is can be represented by
vector notation. In this case the x, y and z values are represented in terms of the
unit basis vectors I, j and k.
k
z
j
y
i
x
r
ˆ
=
ˆ
+
ˆ
+
ˆ
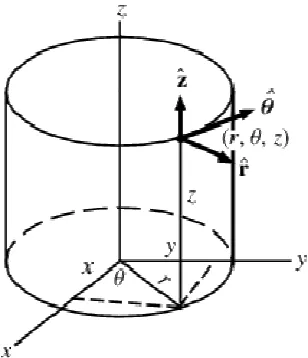
2.1.2. The Cylindrical Co-Ordinate System
The Cylindrical Co-Ordinate System was also studied as a candidate for
describing the points in three dimensional space.
The cylindrical coordinate system is a three-dimensional coordinate system. This
system relies on a definition in one plane, described by an angle and radius and
the third dimension is disclosed by a height parameter above that plane. Thus
point P is given by (r,θ,h).
[image:25.612.229.383.465.644.2]Source: Wolfram Mathworld accessed www 26AUG07
Figure 2.2 shows the arrangement of the Cylindrical co-ordinate system.
Thus, the conversion function f from cylindrical coordinates to Cartesian
coordinates is:
)
,
sin
,
cos
(
)
,
,
(
x
y
z
r
r
h
f
=
θ
θ
Similarly the vector form of the conversion is given by:
−
=
z
y
x
z
ˆ
ˆ
ˆ
1
0
0
0
cos
sin
0
sin
cos
ˆ
ˆ
ˆ
φ
φ
φ
φ
φ
ρ
2.2.
The Pinhole Camera
Light travels in straight lines. The simple concept of the pinhole camera has been
used to teach this basic phenomenon in elementary physics courses and was
also employed in developing an understanding of how the system would derive a
measurement from an image. Figure 2.3 shows the relationship between an
object in the real world and one in the two dimensional image. Note that for the
purposes of this explanation the z axis is aligned to the optical axis.
In this case the dog’s foot at point P, can be described in the real word by the
Cartesian co-ordinates P(X,Y,Z). The pinhole camera image is shows the dog is
inverted and somewhat reduced in size. The location of the dog’s foot in the
To derive the actual co-ordinate data the equation for the translation are:
Z Xf x=
Z Yf y=
where f is the effective focal distance of the camera.
[image:27.612.112.507.296.523.2]
Source: (Entner, 2005)
=
1
1
0
0
0
0
0
0
0
0
0
Z
Y
X
Z
f
Z
f
z
y
x
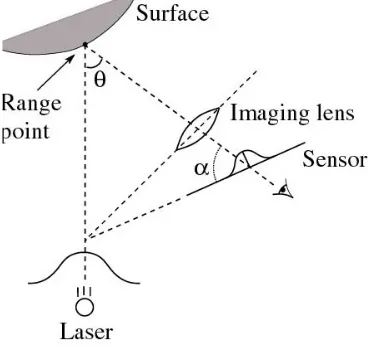
2.3.
Triangulation
Having established a mathematical language to communicate position, the
principle of operation was derived. Figure 2.4 shows a plan view of the basic
Triangulation principle.
[image:28.612.212.396.364.540.2]Source: (Curless, 1999)
Figure 2.5 A Three Dimensional Extension of the Basic Triangulation Principle
First Impressions
The objective is to prove that an optical measurement and position control
system can be implemented from cheap, readily available components and the
use of such a system would reduce the time required to manually draft a 3D
model.
The system must be able to recognize, manipulate and measure the object and
then record the date in a manner suitable for entry into an external software
2.4.
Relevant Literature
A library survey of techniques used to accurately measure position and
displacement was conducted to see if any techniques could be useful in
conducting the project.
As a significant portion of this task could be defined as a non-contact
measurement of distance, previous works published in this area were sought.
Chakravarthy et al., (2002) developed a method of measurement where a light
source illuminated the surface of a liquid in the tank with a predefined pattern.
The reflected light pattern was then captured by a CCD camera and analysed.
The positions of the lines in the image plane varied with the position of the lines
on the surface of the liquid. The relationship between the positions of the lines
corresponded to a simple principle of perspective geometry. This relationship is
used to accurately determine the depth of the liquid in the tank.
In order to determine distance, and hence depth of fluid in the tank, the images
required processing. The steps used by Chakravarthy were:
(a) Thresholding: computation is reduced by converting the grayscale images
into a 2 level binary image. The threshold is the value of grey which determines
whether a pixel becomes black or white;
(b)Thinning: Thick multi-pixel lines are are thinned so that a single pixel line may
(c) Median Filtering: Artifacts from the process of thinning are produced. These
artifacts are noise and are removed by the application of a median filter.
After the image was processed in the above manner the range was finally
determined by averaging the coordinate of every point on the offset line. This
final averaging was used to effectively remove distortion to the line caused by an
irregular surface.
Other authors wrote of other techniques to speed up the computing process.
Dias. et al.(2000) used a process called a Gaussian pyramid algorithm to
speed-up computation. For the same reason that Chakravarthy employed thinning, the
Gaussian pyramid algorithm was required to reduce the number of pixels
manipulated without the loss of significant information from the image. Each pixel
in one level of the pyramid is obtained by applying a mask to the group of pixels
of the image directly below it. The mask is behaved as a low pass filter thus also
smoothing the images and reducing the noise.
Lang (2000) successfully implemented a navigation system based on
inexpensive CMOS cameras. Lang’s method also cited the use of thresholding
and edge detection to increase processing rates. Lang recommends further
improvements in running time and memory requirements using code optimization
techniques such as combining loops, reusing memory used for image
calculations optimizing numerical representations using look-up tables. These
may be effective areas for investigation in this project, should the processing
In a similar ranging method to that used by Chakravarthy et al., (2002), Ming-Chih et. al (2006) projected two laser pointers onto one surface. These lasers were set
up to produce a triangle, and the distance between the two points is related to
distance by the following relationship:
[image:32.612.146.465.301.576.2]
This can be illustrated by Figure 2.6.
Figure 2.6 Triangle Method
This method, whilst simple requires the target object to present a relatively large
surface parallel to the CCD image plane. That makes the image unsuitable for
Noteably, Ming-Chih et. al (2006) was of the opinion that the method discussed
in his paper, avoided the use of expensive high-speed DSP microprocessors or
resource intensive pattern recognition algorithm to process pixels in an image.
Rather Ming-Chih opted for simple circuits, geometrical relationships and counter
circuits to determine distance.
Intuitively it would seem that the ultimate accuracy of the system may be limited
by the resolution of the camera. An option was sought for improving the accuracy
of the system to sub pixel uncertainty. Sandoz. et al. (2000) reported a highly
accurate vision technique for position and displacement measurement of moving
targets. Claimed uncertainties in the order of 10-2 pixels were reported.
This technique involved the use of a phase reference pattern, consisting of a pair
of complementary strips, fitted to the object of interest and the whole scene is
observed with a static camera. The strip sets correspond to a narrow spectral
band in the spectral domain, and space-frequency analysis is performed through
a wavelet transform. This analysis similar to the Image Pattern Recognition
process described by Leis (2002).
In the method reported by Sandoz. et al. (2000), the analysis of the phase
deviation corresponding to each strip set enabled determination of the strip
centre and the determination of the object position to within less than a pixel in
the recorded image. Displacements are computed from positions computed
before and after the object motion. For measurement in two axes, two sets of
strips would be fitted.
This technique whilst extremely promising in regards to improving the accuracy
was to be repeadedly manipulated to measure a new aspect. Each time the
object was moved the reference strips would need to be reaffixed..
Another method of achieving sub-pixel uncertainty was briefly explained by Dias
et al. (2000). In this approach, a quadratic interpolation was applied. Whilst this
did not yield the accuracy of the Sandoz approach, an interpolative method is
could seen as easier to implement.
Further reading was conducted to determine the effectiveness and usable
techniques of vision-controlled robotic systems.
Dias. et al.(2000) published a report on their attempts to perform the pursuit of a
moving target. In their work they used two visual-based control schemes. One
was use of a “visual fixation control” and the other was a trajectory control
system. In their implementation, the visual fixation control, by the vision system,
continuously tracked the target providing information about its position. The
system then uses the positional information as a feedback to maintain position
with respect to a moving target.
Diaz made use of filtering and prediction methods to estimate the present and
the future values of the target parameters of position, velocity and acceleration.
The use of filters was particularly useful for compensation for the delays in the
system. This conclusion was also reached by Lang (2000) in his paper on Visual
Measurement of Orientation Error. Whilst these conclusions are valid for dynamic
systems, filtering and prediction methods of the types discussed Diaz and Lang
are probably unnecessary in a target that will be static during the position
Ellerton (2002), used an optical system to take cross-sectional measurements of
dingo teeth. In this paper the process used a non structured light approach to
measure the width of a dingo tooth silhouette. The tooth was then rotated and a
tomagraphic model was produced, based on a series of tangential
measurements.
Of particular interest of the Ellerton scheme was the use of a simple light source
and an inexpensive Webcam as the optical sensor.
Also noted was the purpose built turntable arrangement, controlled from the
parallel port.
An internet search was also conducted. A number of interesting options for range
measurement were found. One scheme of note was that published on the
internet by Danko (2003). In this scheme a laser diode is placed next to the
Webcam. The boresight axis for both laser and camera are parallel to the target
surface. The crux of this solution is the displacement of the image from the
camera centre field of view as the target surface approaches the camera. This
effect is exploited by developing a linear mathematical relationship between the
pixel offset of the camera image and the distance to the camera. A calibration is
used a line of best fit supplies function coefficients.
The major limitation of this method would be the need to scan the range sensor
2.5.
Design Requirements
To bound the design problem and begin the Project Methodology as defined in
Chapter 1, a set of requirements were derived. As a starting point was decided
that the prototype system should be:
a. able to support/manipulate an object of less than 5 kg in weight;
b. the physical size of the object shall fit in a cube with a side of 150mm;
c. the system shall be able to resolve the surface at a resolution of not less
than 30mm; and
2.6.
Constraints and Alternatives
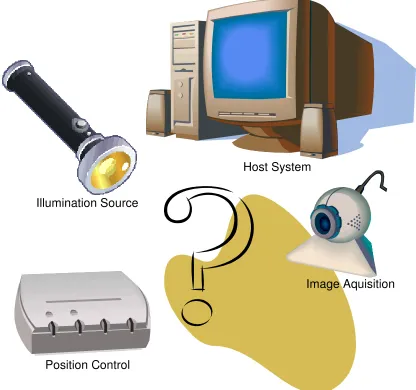
Figure 2.7 Common Topologies with Scanned
Most of the systems studied, exhibited a topology as similar to that shown in
Figure 2.7.
Position Control Illumination Source
Host System
In these systems the functional allocation was seen to be divided into four
sub-systems:
a. position control system;
b. image acquisition system;
c. host or main control system; and
d. an illumination source.
2.6.3. Position Control System
The position control system is responsible for the orientation of the target with
respect to the image acquisition system. A number of alternate methods were
considered.
Servo based systems- particularly those which employed model aircraft servos,
had been applied in mechanisms which left the target stationary and scanned the
illumination source. In one particular solution examined, the position data was
commanded from a host system using the serial communication port. This
allowed the illumination system to be commanded to 1 in 256 positions within the
180 degree arc of rotation of the servo output shaft. A limitation of this system
was the need to manually reposition the target to gather surface data for the rear
of the object. This was seen as an unnecessary constraint.
Another position control system mounted the target directly onto the output shaft
of a small stepper motor. The stepper motor control was accomplished using the
parallel port to drive each phase of the stepper motor using a darlington driver to
system, a half-step drive scheme was adopted to give the system the necessary
resolution.
Whilst this system was very successful, a number of constraints prevented a
direct reimplementation of this scheme. Firstly, a self-imposed requirement for a
load of 5 kg would place too much longitudinal load on the shaft of a device
designed for radial loading. Also this mass would require a large amount of
starting and holding torque to reposition. As a third constraint, use of the parallel
port was considered undesirable as this port is obsolete in many computer
systems.
The preferred technique used in this design was for the system use the serial or
USB port, mount the target on a robust table and rotate the table using a
reduction drive scheme.
2.6.4. Image Acquisition System
The function of the image acquisition system was to digitise the real image into a
array suitable for processing. Two techniques considered were physical scanning
of a sensor element and use of a solid state array sensor such as CMOS or
Charge Coupled Device (CCD) typically used in digital cameras.
Physical scanning systems use simple sensors and mechanically scan the
image. These systems use many moving parts and typically are not robust,
The use of the solid state sensor –based system overcomes the issues of fragility
and synchronization. By using this type of sensor pre-packaged in a camera,
issues of design and construction are simplified.
At hand, prior to design of the system, was a Logitech Express Webcam. It uses
a CMOS sensor and connected to the PC via the USB port. It was capable of a
still shot with a resolution of 640 by 480 pixels, was manually focused and could
stream video in near real time.
The use of a USB controlled webcam was selected on the basis of simplicity and
cost.
2.6.5. Host Or Main Control System
There are three critical sub-functions to be performed by the Host or Main
Control System. They are:
a. process the image
b. store the resultant data
c. control the sequence of operation of the system.
Only two options were considered.
A dedicated Digital Signal Processor could perform the image processing of the
data stream and even store the resultant data for future use. This type of system
would also prove portable due to small footprint and low power consumption.
However the disadvantage of this system is the difficulty in providing a user
The other option considered was to use a PC to perform image processing, data
storage and sequence control. The distinct advantage of this system was the
ease at which a man-machine interface could be provided. Portability concerns
are also easily addressed if a notebook form of PC was used.
As a result, a notebook computer was selected to perform the functions of the
Host and Main Control System.
2.6.6. An Illumination Source
Illumination was required to enhance the contrast of the target’s profile within the
image. Three options were considered as the illumination source:
a. illuminated against a black background using simple white light;
b. illumination by a “half plane” of light using a slide projector; and
c. illumination with a focused monochromatic light.
Illumination using simple white light has been previously used with success in
scanning dingo teeth (Ellerton, 2002). In this method a light source was used to
contrast the object against a black background. This method, whilst simple and
proven, was not implemented in this project as a black background was
considered an unnecessary constraint.
Half-plane illumination places a contrast boundary onto the object to aide
detection of the profile. This boundary is able to employ triangulation as it cuts
the target at an angle to the direction of observation. This method was more
background. It did have the significant disadvantage of requiring the use of a
strong shaped light source such as a slide projector. Consequently this option
would disadvantage the design in terms of portability.
It was seen that many of the range scanners analysed used laser illumination
instead of incandescent or fluorescent light.
One principle reason for this was a laser devices ability to hold a focus for a
distance. This provides distinct resolution and discrimination advantages, thus
improving resolution of laser based systems.
Another reason was a low bandwidth. This property was reported to provide a
high immunity to ambient light interference if the system employed high quality
optical filters tuned to the wavelength of the laser used.
Finally, illumination with a focused monochromatic light was considered. In the
most common form of this technique a common laser diode is used to provide a
sharp contrast point on the surface of the target. Like half plane illumination, the
method employs triangulation as the beam paints the target at an angle to the
direction of observation. This method is compact and simple but has a
requirement for reposition as only a small point is illuminated at each acquisition
cycle. This characteristic can be overcome by ether adding a method of
repositioning or reshaping the beam into a stripe to avoid additional mechanical
A laser diode, was selected based upon cost and availability. The point source
was converted to a stripe to avoid the need to physically scan a point source up
Chapter 3.
Project Risk
The risk management process adopted by this project follows the methodology
outlined in AS/NZS 4360:2004. Its main elements are shown in Table.3.1 below.
Hazard Risk/Consequence Control
Laser Radiation Exposure
Slight/minor injury • Use of non-specular reflection
• Aversion response due to wavelength
• Use of class1 laser
• Operator controlled environment. Electric Shock Extremely slight/
Possible death
• Designed to use plugpack/low voltages only.
• Only serviceable equipment to be used in manufacture.
• Only qualified personnel to manufacture.
• Manufacturing instructions to be provided
Burns (soldering iron) Extremely slight/ minor injury
• Only serviceable equipment to be used in manufacture.
• Only qualified personnel to manufacture.
Hazard Risk/Consequence Control
Cuts from moving parts Extremely slight/ minor injury
• Use of safety guards intrinsic safety
• Only qualified
personnel to operate.
• Use minimal forces/velocities in mechanics
Poisoning (soldering) Extremely slight/ minor injury
• Only qualified personnel to manufacture.
• Manufacturing instructions to be provided
• PPE to be used
• Relevant Material Safety Data Sheets (MSDS) to be read and understood
• Adequate disposal instructions
Injury to operator (RSI/posture)
Extremely slight/ minor injury
• Only qualified
personnel to operate.
• Adequate instructions (Warnings for
excessive operation time)
• Adequate ergonomics
• Low glare monitors
Software not used for the purpose it was intended
Extremely slight/ major injury
• Only qualified
personnel to operate.
• Adequate instructions/ documentation
• Password protection
Hazard Risk/Consequence Control
Chapter 4.
Detailed Design
4.1.
Hardware Design and Implementation
4.1.1. Scanner control board
The Scanner Control System is required to perform the following functions:
a. turn the light source on and off
b. provide a heart-beat indicator to the user; and
c. provide the correct switching sequence for stepper motor operation.
The Scanner Control Board is based on an ATMEL AT90S8535 Microcontroller.
This microcontroller device is a CMOS 8-bit microcontroller based on the AVR
Reduced Instruction Set (RISC) architecture. This device contained many
features, including:
a. 8Kbytes of in system programmable Flash memory;
b. 512 bytes of both EEPROM and SRAM memory;
c. a programmable serial UART;
d. 8-channel 10-bit ADC; and
Figure 4.1 Pinout of the AT90S8535
Although the range of functions provided by this device far exceeded that which
was anticipated by the early design scope, it was decided that the risk of
unforeseen design changes would best be mitigated by selecting a more capable
device outright.
The microcontroller is mounted on an STK 500 development board. This circuit
board assembly was selected as it provides the ideal environment to prototype
the system. The STK system is the recommended companion to the Studio 4
software which is also made by the microcontroller Original Equipment
Manufacturer (OEM), ATMEL. This combination reduces project risk associated
The STK 500 provides access to all ports through integral header pins. Also
provided, is a bank of eight light emitting diodes and eight switches for hardware
development. The UART can be accessed to by either direct connection off the
board, from port D header connector or via a MAX 202 integrated circuit to the
auxiliary 9 pin connector. The Max 202 changes the TTL levels of the
microcontroller output port to those required to interface with the RS232 serial
communication port of a Personal Computer.
In the initial implementation of this design it was decided to leave the
microcontroller resident on the development system and develop the rest of the
Scanner Board functionality as plug-in additions. There were a number of
reasons for this decision.
Firstly, the development board was small and consumed little power. This meant
the requirement for portability would not be compromised due to packaging and
power supply size. Also, no significant advantage could be identified by
producing a dedicated prototype circuit card if all necessary ports and peripherals
could be easily accessed. In fact, more time resources could be spent on critical
[image:49.612.189.422.517.683.2]areas of the systems, rather than re-inventing that which was already provided.
Both manual and remote switching of the laser light source was provided by the
system. This was accomplished by feeding a regulated 3 volt power source
through a single pole double throw switch. With the switch in the remote position,
the laser would be actuated by a relay controlled by port D pin 5. In the manual
position the diode is fed directly from the power source. In the centre position the
laser is off.
A heart beat function is also provided by the system. Port D pin 4 is strobed at a
one cycle per second rate. The output of the microcontroller is capable of driving
a LED directly but it was not recommended. Consequently, a transistor was
provided for switching to aide microcontroller longetivity.
4.1.2. Step Motor Drive Board
A stepper motor consists of a strong permanent magnet shaped into a toothed
rotor and a number of wire coils forming the stator. They deliver torque which has
a tendency to diminish as shaft speed is increased. Due to the way they are
actuated they divide a rotation into a number of discrete steps. They are widely
used in printers, plotters and other consumer machinery and hence are readily
available in discarded electronic goods.
The particular step motor used in this project was recycled from a spares box
and an internet search based on the part number was unable to return useful
design data. Labeling showed that the operating voltage for the motor was 10.9
volts and six wires presented a high probability that the motor was a four phase
type. The output ports of the microcontroller were only marginally capable of
driving a LED. Consequently, buffering and current drive functions must be
Some research was conducted on the internet and various flexible designs were
considered. The final design developed for this project is best described as an
amalgam of the designs seen.
Refer to the schematic shown in Figure 4.3 for an overview of the Step Motor
Drive Board. The Step Motor Drive circuit is required to provide sufficient current
to step a four phase step motor and isolate the microcontroller from the
[image:51.612.92.536.312.602.2]essentially inductive load.
Figure 4.3 Step Motor Drive Board Schematic
The input to the Step Motor Drive Board is a 7406N inverter buffer. These gates
are open collector type recommended for interfacing with high current loads. The
outputs from the load. This logic device operates from a 5 volt supply which is
decoupled by C2. Unused gates in the device have been tied to logic high to
avoid oscillation and excessive power consumption.
IC1 is a three pin voltage regulator which converts the input supply of 12 volts to
5.
Transistors Q1 to 4 are used to invert the signal and drive the output switches.
Q10, Q12, Q13 and Q14 act as switches for each phase of the stepper motor.
Diodes D1 to D4 are used to suppress back EMF thus protecting the output
switches.
The output connector was deliberately chosen as a screw type device. This
allowed interchanging of the stepper motor leads during testing as the lead
configuration could not be confirmed prior to assembly.
4.1.3. Turntable
The turntable is a 250mm custom built rotary table, designed to support in
excess of 5 kg. The general arrangement of the turntable is shown in figure 4.4.
The table is a disk of 2024-T3 aluminium, 6mm thick supported on a bearing
Figure 4.4 Turntable Assembly
Fixed to the underside of the table is a 215mm diameter ring gear, also recycled
from obsolete aircraft components. Torque is transmitted from the ring gear to
the turntable by 3 M4x20mm stainless steel hexagonal standoffs.
This ring gear is driven by a 25mm pinion which is directly coupled to the shaft of
a bi-phase stepper motor scavenged from a discarded photocopier. The stepper
has a resolution of 1.80/step and shaft input, actuated through the geared reduction, will yield a rotation of 0.20/step.
The whole turntable assembly is mounted on a 6mm thick baseplate of 2024-T3
aluminium. This baseplate is required to provide sufficient rigidity to the recycled
flatbed scanner which is the base. Stepper Pinion
4.1.4. Optical Sensor
It was decided that a webcam would provide the optical sensor for the project. A
Logitech Express webcam was used based primarily on availability and cost.
This camera features:
a. CMOS sensor;
b. 640 x 480 pixel resolution;
c. 30 fps video;
d. manual focus; and
e. USB connectivity.
The Logitech camera is based on a CMOS sensor as opposed to the CCD
devices used in many of the projects researched.
The CMOS sensor is much cheaper than CCD technology as the production
process uses standard microprocessor technology. This has seen a reduction in
cost of image sensors which are based on this technology.
A typical CMOS sensor consists of a number of transistors located on a
photosite. These transistors amplify and transfer the charge produced by the
photons. This allows the pixels to be read individually.
Unfortunately, CMOS image sensors operate at a lower gain and also produce
more noise than a CCD imager. This often results in a poorer image quality.
A photosite measures intensity and cannot determine colour. To transduce a
colour image a filter system is employed to discern the light into the three primary
colours. The reconstruction of the image then becomes a process of recombining
A colour filter array is used over each photosite. A common pattern of filters is
the Bayer filter pattern. This pattern alternates a row of red and green filters with
a row of blue and green filters. Due to the human eye having inconsistent
sensitivity to each of these colours, the filter is characterised as having an
uneven distribution of red green and blue.
[image:55.612.188.424.237.461.2]
Figure 4.5 Logitech Express Webcam
The video streaming feature of the camera could be employed during a focus
4.1.5. Light source
A laser diode-based laser pointer was used for the light source for the system.
The light source assembly was custom built for this project. The main component
[image:56.612.162.450.251.402.2]of the assembly is a modified class 2 red laser pointer.
Figure 4.6 Laser Pointer
The light source was a modified laser pointer. Modifications of the device
included:
a. machining of the rear cap;
b. removal of the front cap; and
c. replacement of the batteries with a custom remote switchable power
source.
To avoid the need for mechanical scanning a means of projecting a stripe was
required. The normal output of the laser pointer was a slightly elliptical collimated
Examination of other applications employing a laser stripe, showed most
employed a special lens arrangement to form the circular beam into a stripe.
The modified laser diode was installed in an adjustable housing. This housing
also has a specially-built lens assembly which converted the point source into a
4.2.
Software Design and Implementation
4.2.6. Embedded Software Development
The embedded software was developed on the Studio 4 software supplied free
from ATMEL. This software is a front end program for both C and the AVR family
assembler. It is an Integrated Development Environment (IDE) which enables the
designer to code, simulate debug and download from the one graphical interface.
The five stages of coding this microcontroller were:
a. determine the program interfaces;
b. design the program flow;
c. code the program in assembler;
d. simulate the program and debug; and
e. download the code to the device.
Program Interfaces
The first program interface specified was a simplex communication channel to
the host system. The specification chosen was a 9600 baud rate, 1 stop and no
parity bit. The protocol used was a simple “S” character to command a step, a “L”
character to switch the laser.
The next interface defined was the scanner man machine interface. This
interface consisted of output port pin used to interface with a simple LED circuit
to give the instrument a heart beat. Similarly, control of the laser state was also
Finally, and most crucially the interface to the stepmotor driver board used four
output pins to drive the phases in the correct sequence.
Program flow
A strategy for handling the interfaces was determined prior to the initial flow chart
development. As the simplex communication would involve an on-demand
response from the system, it was decided to implement an interrupt-based rather
than polled UART scheme. This allowed the laser switch function, and step
functions to be part of the interrupt service routine and the heart beat indication
would naturally be allocated to the normal wait loop. The resulting program flow
[image:59.612.131.479.385.641.2]chart is shown in Figure 4.7
Figure 4.7 Embedded Software Flow
Setup Ports
Setup UART
Enable interrupt
Change LED state
DELAY
MAIN ISR
Is the char
an “L” ? Toggle Laser State
Return Is the char
an “S” ? Y
Execute step motor sequence
N
To drive a bi-phase stepper motor in a full step mode, a four byte sequence was
implemented. Some memory was allocated and the required sequence was
stored in what is referred to as a look-up table. This method was used to facilitate
the future ability to step forward and backward in a partial cycle. This bidirectional
[image:60.612.233.469.213.633.2]step function was not yet implemented in the first incarnation of the project.
Figure 4.8 Step Motor Embedded Program Flow
Get the bit pattern from a LUT
Output the pattern to the µC output port Step Motor Function
Has the last pattern been
used?
Increment LUT pointer
Return
N
Executed on reception of an “S” character
Assembler Code
The above software flow was coded in AVR Assembly Language in accordance
with the ATS90S8535 instruction set.
The resulting code listing is shown in Annex B.
Debugging the Firmware
The code built without errors and was the debugged with the Studio 4 simulator
until expected operation was observed.
Download of code
On completion of the coding and debug cycles the code was down loaded into a
ATS90S8535 microcontroller mounted in the STK500 development kit. LEDs
were connected to the appropriate output ports, the secondary serial connection
was setup and test stub software which could issue the necessary commands
4.2.7. Host Software Development
The host software was developed on the Microsoft VisualBasic.net Express
edition software supplied free from Microsoft. VisualBasic.net is an
object-oriented computer language that has evolved from earlier versions of VB in an
attempt to provide greater usage of the .NET framework.
Initially it was intended to use Visual Basic 6 in this project. By commencement of
the task, that version was no longer supported. Unfortunately, the introduction of
the new variant has not been without problems with backward compatibility, thus
introducing a risk that some functions and libraries no longer exist or will not work
in the new version.
This software is a provides another Integrated Development Environment (IDE)
which enables the designer to code, simulate ,debug and deploy the finished
code from the one graphical interface.
The six stages of coding the host software were:
a. determine the program interfaces;
b. design the form;
c. install the appropriate controls;
d. code the program modules;
e. simulate the program and debug; and
The Host Program Interfaces
The host program interfaces were included a serial port to communicate with the
instrument, a camera control to use the webcam to acquire the data, and a text
[image:63.612.201.410.246.481.2]file interface to write the data to an output record.
Figure 4.9 Output Record Format
The output record is a space delimited text file called PointCloud.txt. A
screenshot of the data is shown in Figure 4.9. The data is recorded as a 3 x n
array of cylindrical co-ordinates with the first element being the angle in degrees,
the second is the height and the third is the radius in millimeters. A text file was
The serial communication specification previously chosen was a 9600 baud rate,
1 stop and no parity bit. The characters “S” and “L” would be transmitted in
response to the host software cycle.
The webcam is connected to the PC via a USB port. Unlike the serial port, a
camera API was used and all issues associated with communication to the
camera could be handled through this interface.
[image:64.612.91.524.319.569.2]Design of the Host Program Form
Figure 4.10 Main Form View
Figure 4.10 shows the screen shot of the main Host program form. The form was
designed to have a similar operation to many windows graphic user interfaces.
This strategy was adopted to minimise the learning time of any novice operator
The frame on the left is the viewing pane for the acquired image. After pressing
the acquire button at the bottom of the form, the array appears as a still picture.
Similarly, actuating the process button at the bottom of the form initiates the
analysis and processing of the previously captured image, and displays it in the
right hand viewing pane. It is after this cycle that the table position is incremented
through the issue of a step command on the serial port.
The image displayed in this pane paints the detected pixel in yellow. This allows
immediate determination of outlier data in the output file.
The Laser button issues a laser on/off command through the serial port.
The quit button exits the form.
Installation of Controls
The Microsoft Windows Image Acquisition (WIA) interface was used to access
and control the Logitech camera. The WIA is both an API and a Device Driver
Interface (DDI). The WIA API was used in this program to enumerate available
image acquisition devices and create the connection. Once the connection was
created data transfer was also accomplished using this interface.
The API also provided a useful means for notification for a variety of device
The WIA DDI significantly reduced the amount of code a required compared to
[image:66.612.181.430.145.385.2]using the Logitech SDK.
Figure 4.11 Camera Focus Dialog
Figure 4.11 shows the camera focus dialog was accessed from a drop down
menu. Due to the nature of it’s operation a real-time image capture is not shown.
This function allowed the system to be manually focused by streaming webcam
video to the pane in real time. The focus ring was then accomplished by rotating
the lens ring for best picture. Camera alignment was also accomplished with the
aid of this form. Clicking the return brought the operator back to the main form
view. Failure to actuate the return button prior to an acquisition cycle would
Deployment of the code.
A formal code deployment process was not conducted during this task. All
Chapter 5.
Analysis and Performance
Figure 5.1 General Setup of the System
The system was setup in as per figure 5.1. A notebook computer was used in lieu of
the desktop PC to aid with portability. Minor changes were required in the host
software to enable use with the differing port numbers.
A suitably sized object was selected and set-up on the table. The object used was a
Figure 5.2 Target Object
The system was setup to scan at a 20 pixel vertical resolution to reduce the output
Figure 5.3 Example Data Run
Figure 5.3 shows a screen capture of the scan in progress. In the Acquired Image
pane, the laser illumination of the object is shown. In the Processed Image pane the
image shows where the pixel position has been detected by painting yellow dots. The
effect of the red threshold setting of 20% is illustrated by the absence of any yellow
artifacts in the top and bottom 40 pixels of the processed image.
Chapter 6.
Conclusions and Recommendations
6.1.
Achievement of the Project Specification Objectives
The task was planned and executed in accordance with the methodology outlined in
Chapter 1. Documentation was conducted through this dissertation and project
appreciation conducted in Semester 1.
Information on three dimensional modelling techniques was conducted. Sources of
data were found in textbooks, journals and the internet. The details of this research
and a critical evaluation were disclosed in the Relevant Literature section of Chapter 2.
Firmware was designed and coded for an ATMEL AT90S8535 in assembly language.
The code was tested using a combination of the native simulator in the Studio 4 IDE
and once downloaded, stub test software was written to verify operation in the STK500
development system.
Host syst