Anthropogenic disturbance of environmental signals retained in massive corals
244
0
0
Full text
(2) ANTHROPOGENIC DISTURBANCE OF ENVIRONMENTAL SIGNALS RETAINED IN MASSIVE CORALS. VOLUME I. Thesis submitted by Cecily Ellen RASMUSSEN (BA)Hons in December 1991 Resubmitted March 1994 for the degree of Doctor of Philosophy Sir George Fisher Centre for Tropical Marine Studies James Cook University of North Queensland.
(3) I, the undersigned, the author of this thesis, understand that James Cook University of North Queensland will make it available for use within the University Library, and, by microfilm or other photographic means, allow access to users in other approved libraries. All users consulting this thesis will have to sign the following statement:. "In consulting this thesis I agree not to copy or closely paraphrase it in whole or part without the written consent of the author; and to make proper written acknowledgement for any assistance which I have obtained from it".. Beyond this, I do not wish to place any restriction on access to this thesis. Cecily E RASMUSSEN. Date.
(4) DECLARATION. I declare that this thesis is my own work and has not been submitted in any form for another degree or diploma at any university or other institution of tertiary education. Information derived from the published or unpublished work of others has been acknowledged in the text and a list of references is given.. Cecily. Date. Elle4 PASMUSSEN. ii.
(5) ABSTRACT Samples of Porites coral were removed from seven different reefs (No Name, Hastings, Upolu, Thetford, Batt, Green Island and Brook Islands Reefs), including two from the same reef (Green Island Reef), within Australia's Great Barrier Reef Marine Park. Chemical and morphological data retrieved from these samples were used to investigate historical change in water quality surrounding the growing corals, particularly as this related to the increased use of phosphatic fertiliser on the nearby mainland. The study focused on a narrow section of the continental shelf adjacent to the mouth of the Barron River. In this area coral reefs are close to a mainland significantly altered for anthropogenic purposes. No Name Reef (approximately 300 km north of the study area and reasonably distant from known anthropogenic input) was included as a control. The Brook Islands Reef (approximately 300 km south of the study area) was added for geographic variability. Support data was gained by a two year nutrient monitoring programme of the Barron and Mossman River catchments, and marine waters adjacent to these two river systems. Additional information was acquired by the experimental supplementation of Acropora formosa corals with 2.0 gM, 4.0 AM and 8.0 /./M PO,.. Stream phosphate levels responded rapidly to rainfall. During the April 1989 flood period between 710 and 2,850 tonnes of Superphosphate were delivered into the ocean. Estimates vary according to the presumed ratio of soluble to particulate phosphate in the flood plume (e.g. see Cosser 1987 and Brodie & Mitchell 1992). The lower figure is nearly half the total industry estimated fertiliser usage (1810 tonnes) for the Far Northern Statistical Division during 1988. The greater figure is more than a third higher than Australian Bureau of Statistics figures for the same period (Pulsford 1990). The marine monitoring program suggested that nutrient monitoring was an insufficient method of estimating water quality.. The phosphate supplementation experiment showed that elevated levels of phosphate hindered calcium carbonate production with considerable alteration to the internal and external morphology of the coral skeleton. Chemical analysis of the Porites samples suggested that intra-reefal variation in the coral skeleton was minor, but with sufficient inconsistencies in the annual record to.
(6) suggest that localised, micro-environmental conditions exist and should be recognised when attempting to reconstruct environmental records from the coral skeleton. Statistically, the inner- and inner/mid-shelf sample sets were significantly different from each other and from all other sample sets. No significant statistical difference could be distinguished in the mid- to outer-shelf sample sets, but the relative contribution of each element differed for each of these sample sets.. The difference between the samples from nearer to shore and those from the outershelf was also apparent in the reconstructed coral inferred environmental record. Strontium-based sea-surface temperature estimates provided an adequate record of historical sea surface temperatures from the mid- to outer-shelf samples (No Name, Hastings, Upolu and Thetford Reefs), but were unreliable for the closer to shore samples (Batt, Green Island and Brook Island Reefs).. Similar inconsistencies were noted in associations with climatic variables. Data from the outer-shelf No Name Reef sample correlated with climatic data associated with the Southern Oscillation Index (SOI) while data from the Green Island Reef sample correlated with Mean Sea Level Pressure read at Darwin. These inconsistencies were inherent in the coral-inferred record and were not associated with anthropogenic influence.. However, ambiguities in the chemical composition and morphological structure of the Green Island sample were noted post-1950. These inconsistencies were statistically correlated to the use of fertiliser on the nearby mainland. Changes to the internal porosity of the coral skeleton were similar to those noted in the experimental phosphate supplementation programme.. The study concludes that chemical and morphological variations in the skeleton of the massive Porites coral are suitable for hindcasting paleoenvironmental conditions laid down in the skeleton at the time of precipitation. The study further concludes that there is significant evidence of anthropogenic influence in the Green Island sample, and that this influence is related to the use of fertilisers on the nearby mainland.. iv.
(7) VOLUME I CONTENTS. DECLARATION ABSTRACT TABLE OF CONTENTS ACKNOWLEDGEMENTS. ii iii v xv. LIST OF FIGURES. xviii. LIST OF TABLES. xxiii. LIST OF PLA I ES. xxvi. CHAPTER I: ANTHROPOGENIC SIGNALS IN MASSIVE CORALS AN INTRODUCTION TO THE CONCEPT OF THE THESIS AND SELECTION OF STUDY AREA 1.1 Introduction. 3. 1.2 Selection of the study area. 4. 1.3 Previous work by the author suggesting the possibility of using sclerochronology to determine environmental change on coral reefs. 4. 1.4 The possibility that enhanced levels of phosphate could leave a signal in the coral skeleton suitable for use as a surrogate indicator of nutrient enhancement. 5. 1.5 Research plan. 6. CHAPTER 2: THE ENVIRONMENT OF THE STUDY AREA 2.1. The Cairns-Mossman area and its hinterland - the potential for impact in adjacent marine environments 2.2 The terrestrial environment of the study area. 9 10.
(8) 2.2.1. Geographical characteristics 2.2.2. Geological and pedological characteristics. 10 11. 2.2.3. The effects of climate and hydrology on sediment yield 2.2.4 Agricultural practices and fertiliser application Historical background Current Land Management Practices. 12 15 15 15. 2.3. The marine environment of the study area 2.3.1. Geographical characteristics 2.3.2 Morphological characteristics of reefs in the study area 2.3.3 Hydrodynamics Tides Currents 2.3.4 Water mass structure Temperature Salinity Nutrients 2.3.5 Terrestrial influences 2.3.6 The distribution of nutrient rich waters from upwelling event. 19 19 19 20 20 20 20 20 21. 2.4. Conclusion. 22. 21 22. CHAPTER 3: DELIVERY OF NUTRIENTS TO THE GREAT BARRIER REEF - A SERIES OF QUESTIONS 3.1 Introduction. 28. 3.2. Aims and objectives. 30. 3.3 The use and behaviour of phosphate in North Queensland. 32. 3.4. Results and discussion - addressing a series of questions 3.4.1 Question 1: Does the application of fertiliser lead to enhanced levels of soluble phosphorus in the river system? 3.4.1.a General 3.4.1.b Results 3.4.1.c Discussion. 34. 3.4.2 Question 2: Is the soluble phosphorus flux in the fluvial system sufficient to influence the nutrient status of shelf waters? 3.4.2.a General 3.4.2.b Results General Soluble phosphate concentration Soluble phosphate load Rainfall, discharge and phosphate load 3.4.2.c Discussion vi. 34 34 34 35 37 37 40 40 42 42 42 44.
(9) 3.4.3 Question 3: Is there a seasonal response in shelf waters that could be related to terrestrial influences? 3.4.3.a General 3.4.3.b Results 3.4.3.c Discussion. 45 . 45 47 48. 3.4.4 Question 4: Could reef flat sediments act as phosphate banks? 52 3.4.4.a General 52 3.4.4.b Results 56 3.4.4.b(i) Mineralogical assessment of the reef flat sediments 56 3.4.4.b(ii) Release of soluble phosphate from the sampled sediments 59 3.4.4.b(iii) Short-term, in situ, phosphate dynamic study of reef flat waters and underlying sediments . 61 63 3.4.4.c Discussion 3.4.4.c(i) The relationship between sediment mineralogy and phosphate retention on the Low Isles 63 reef flat 3.4.4.c(ii) The short-term, in situ, phosphate dynamic study of reef flat waters and the underlying 66 sediments 69. 3.5 Conclusions. CHAPTER 4: EXAMINATION OF THE EFFECTS OF ENHANCED LEVELS OF PHOSPHATES ON EXPERIMENTAL CORALS 4.1 Introduction. 73. 4.2 Establishing the experiment 4.2.1. Selection of experimental corals 4.2.2. Establishing the experimental aquaria 4.2.2.a Location of aquaria 4.2.2.b Water supply to the aquaria 4.2.2.c Coral collection and establishment in the experimental aquaria 4.2.2.d Establishing temporal indicators using Alizarin Red 4.2.2.e Introduction of enhanced phosphate concentrations to the experimental corals. 74 74 74 74 75. 4.3 Results 4.3.1 External characteristics 4.3.2 Internal characteristics 4.3.3 Examination of crystallographic distortion using X-ray Diffractometry (XRD) 4.3.4 Estimation of changes in skeletal mass following phosphate enhancement. 77 77 78. 4.4 Discussion. 83 vii. 75 76 77. 79 82.
(10) CHAPTER 5: GEOCHEMICAL RECORDS RETAINED BY MASSIVE CORALS (A) MICRO-ENVIRONMENTAL (LOCAL OR INTRA-REEFAL) ASSESSMENT OF THE GEOCHEMISTRY OF THE CORAL SKELETON. 5.1 Introduction. 85. 5.2 Analysis 5.2.1 Procedure 5.2.2 Statistical Analysis. 87 87 88. 5.3. Results Multivariate Analysis Univariate analysis (ANOVA) (i) Calcium (ii) Strontium (iii) Magnesium. 89 89 90 91 92 93. 5.4. Discussion Multivariate analysis Univariate analysis General. 94 94 94 95. 5.5 Conclusions. 96. CHAPTER 6: GEOCHEMICAL RECORDS RETAINED BY MASSIVE CORALS (B) REGIONAL VARIABILITY AND HUMAN IMPACT? 6.1 Introduction. 97. 6.2 Characteristics of the elements analysed 6.2.1 Calcium 6.2.2 Strontium 6.2.3 Magnesium 6.2.4 Potassium 6.2.5 Sodium 6.2.6 Iron. 99 99 100 101 103 103 103. 6.3. Analysis 6.3.1 Chemical Analysis 6.3.2 Statistical analysis. 103 103 104. 6.4. Results Multivariate Analysis Univariate analysis Calcium Strontium (iii)Magnesium (iv) Sodium. 104 104 105 105 107 109 112.
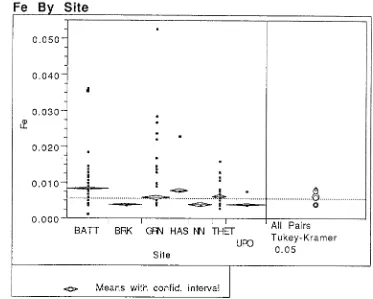
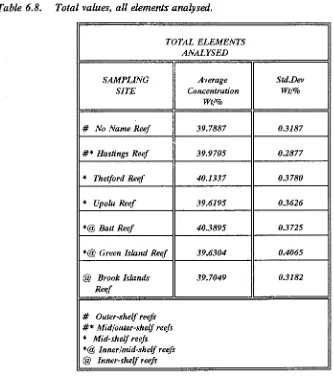
(11) Potassium Iron (vii)Total values, all analysed elements. 113 114 116. 6.5. Discussion - Regional Patterns. 117. 6.6. Discussion - Anthropogenic Signals. 120. 6.7. Possible causes of changes pre- and post-1950 6.7.1. Calcium 6.7.2. Strontium Strontium/Temperature Relationships Strontium/Calcium Temperature Relationships Strontium/Skeletal Growth Rate Relationships Diagenetic alteration and strontium content Summary of factors contributing to strontium discrepancies 6.7.3 Magnesium 6.7.4. Potassium 6.7.5. Sodium 6.7.6. Iron. 126 126 127 127 130 132 136. 6.8. Chemical/morphological relationships and human disturbance 6.8.1. Introduction 6.8.2. Spatial mapping of the Green Island sample 6.8.3. Crystallographic variation of the Green Island sample 6.8.4. Statement of the overall conclusion from a study of chemical/morphological relationships and human disturbance in the study area. 146 146 147 149. 6.9 Geochemical records retained by massive corals: Regional variability and human impact - Conclusions 6.9.1. Discussion and conclusions. 138 139 142 144 144. 151. 151 151. CHAPTER 7: GEOCHEMICAL RECORDS RETAINED BY MASSIVE CORALS (C) MACRO-ENVIRONMENTAL (GLOBAL) ASSESSMENT OF THE GEOCHEMISTRY OF THE CORAL SKELETON: AN UNDERLYING GLOBAL INFLUENCE IN THE ENVIRONMENTAL RECORD? 7.1 Introduction. 156. 7.2. Data and analysis 7.2.1. Climatic data 7.2.2. Statistical analysis. 157 157 159. 7.3. Results. 161. ix.
(12) 7.4. Discussion 7.4.1. Comparisons between strontium content and the Southern Oscillation. 165. 7.4.2. Comparison of the aragonite XRD (111) reflection anomalies and the SOI. 167. 7.5 Summary and conclusions. 165. 171. CHAPTER 8: IMPLICATIONS OF THE RESEARCH FINDINGS AND SUGGESTIONS FOR FUTURE RESEARCH. 8.1 Summary and overview of the research. 174. 8.2 Implications of the research findings and suggestions for future research. 176. 8.3 Conclusions from the research. 183. 184. REFERENCES. VOLUME H. TABLE OF CONTENTS. Volume I(i). LIST OF FIGURES. Volume II(v). LIST OF TABLES. Volume II(vi). APPENDICES: APPENDIX A: METHODOLOGY 1.. General introduction to the study area and handling of the collected data la Terrestrial: Statistical analysis: lb Marine:. Ai. Aii Aii Aii Aii.
(13) lb(i) Selection of sampling sites lb(ii) Geomorphological description of the reefs studied 2.. Nutrient sampling programme 2a Terrestrial Site Selection Sampling time-frame Sampling procedure 2b Marine Sampling procedure. Aix Aix Aix Aix Aix Ax Ax. 3. Sediment desorption techniques 3a Sample collection 3b Sample preparation 3c Sample treatment 3d Mineralogical determination of the sediments 4.. Aii Aiv. Removal and treatment of coral cores 4a Drilling Programme 4b Core Preparation 4c X-Radiography 4d Spectrofluorescence 4e Sample preparation. 5. Analytical techniques 5a Nutrient analysis 5b Atomic Absorption Spectrometry (AAS) 5c Scanning Electron Microscopy (SEM) 5d X-Ray Diffractometry (XRD). Ax Ax Axi Axii Axii Axiv Axv Axv Axv Axvi Axvii Axviii Axix /bud i. 6. Data handling and statistical analysis. APPENDIX B: SHORT-TERM DYNAMIC STUDY BARRON RIVER, YUNGABURRA Daily soluble phosphorus concentrations, Barron River at Yungaburra Daily rainfall data read at Yungaburra Barron river discharge at Picnic Crossing (Yungaburra). APPENDIX C: CLIMATIC DATA FOR THE STUDY AREA Monthly rainfall averages in the study area Monthly averages - Barron River Discharge Daily values - Barron River Discharge for the Month of April, 1989. xi. Bi Bii Bii Bii. Ci Cii Cii Ciii.
(14) APPENDIX D: PHOSPHATE RESULTS - TERRESTRIAL Legend and site identification Monthly phosphate concentrations. Di Dii • Diii. APPENDIX E: PHOSPHATE RESULTS - MARINE Legend and site identification Monthly phosphate concentrations. Ei Eii Eiii. APPENDIX F: COMPARISONS OF NUTRIENT MONITORING DATA DEMONSTRATING THE VALUE OF SHORT INTERVAL SAMPLING Fortnightly phosphate concentrations, March/April 1989. APPENDIX G: STATISTICAL ANALYSIS - (PEARSONS PRODUCT MOMENT CORRELATIONS) Legend and site identification Pearson's Product Moment Correlations Phosphate concentration in the Barron and Mossman Rivers correlated with climatic data. APPENDIX H: COMPARATIVE ASSESSMENT (1883-1902) RESULTS - CHEMICAL ANALYSIS OF PORITES SAMPLES FROM GREEN ISLAND (SAMPLES #1 AND #2), NO NAME, UPOLU, BATT, AND BROOK ISLANDS REEFS Summary'statistics Annual values Wt% Calcium Wt% Strontium Wt% Magnesium. APPENDIX I: MULTIVARIATE (MANOVA) AND UNIVARIATE (ANOVA) STATISTICAL ANALYSIS Multivariate analysis and biplot of multivariate centroid means with associated 95% confidence ellipsoids on the first two canonical axes exploring variation in chemical composition among locations, for the time period 1883-1902. (Figure 15, V1 p89. xii. Fi Fii. Gi Gii Giv. Hi Hii Hiii Hiv Hv. Iii.
(15) Univariate analysis and graph showing mean calcium levels over time period 1883-1902, for each location ± 95% confidence intervals. (Figure 16, V1 p91). Iiii. Univariate analysis and graph showing mean strontium levels over time period 1883-1902, for each location ± 95% confidence intervals. (Figure 17, V1 p92). Iiv. Univariate analysis and graph showing mean magnesium levels over time period 1883-1902, for each location ± 95% confidence intervals. (Figure 18, V1, p93). Iv. Multivariate analysis and biplot of multivariate centroid means with associated 95% confidence ellipsoids on the first two canonical axes exploring variation in chemical composition among locations for sample sets covering the time span n-1987. (Figure 20, VI. p105). Ivi. Univariate analysis and graph of mean calcium concentration for each location over time (n-1987), ± 95% confidence intervals. (Figure 21, V1 p107). Ivii. Univariate analysis and graph of mean strontium concentration for each location over time (n-1987), ± 95% confidence intervals. (Figure 22, V1 p109). Iviii. Univariate analysis and graph of mean magnesium concentration for each location over time (n-1987), ± 95% confidence intervals. (Figure 23, V1 p111). Iix. Univariate analysis and graph of mean sodium concentration for each location over time (n-1987), ± 95% confidence intervals. (Figure 24, V1 p111). Ix. Univariate analysis and graph of mean potassium concentration for each location over time (n-1987), ± 95% confidence intervals. (Figure 25, V1 p113). Ixi. Univariate analysis and graph of mean iron concentration for each location over time (n-1987), ± 95% confidence intervals. (Figure 26, V1 p116). Ixii. Multivariate analysis and biplot of multivariate centroid means with associated 95% confidence ellipsoids on the first two canonical axes exploring variation in chemical composition of calcium, strontium and magnesium between locations, for sample sets covering the two time periods pre-1950 and post-1950. (Figure 27, V1 p121). Ixiii.
(16) Multivariate analysis and biplot of multivariate centroid means with associated 95% confidence ellipsoids on the first two canonical axes exploring variation in chemical composition of calcium, strontium, magnesium, potassium, sodium and iron among locations, for sample sets covering the two time periods pre-1950 and post-1950. (Figure 28, V1 p124). APPENDIX J: GEOCHEMISTRY RESULTS Calcium Strontium Magnesium Sodium Potassium Iron. Ixiv. Ji Jii Jix Jxvi Jxxiii Jxxx hoocvi i. APPENDIX K: ARAGONITE XRD (111) REFLECTION ANOMALIES FROM GREEN ISLAND AND NO NAME REEF CORALS WITH CLIMATIC VARIABLES. Ki. APPENDIX L: SCANNING ELECTRON MICROSCOPY GREEN ISLAND RESULTS. Li. APPENDIX M: PERIODS OF ENSO ACTIVITY WITH ANOMALOUS XRD RESULTS. Mi. APPENDIX N: PEARSONS PRODUCT MOMENT CORRELATIONS. Ni. xiv.
(17) ACKNOWLEDGEMENTS. A formal acknowledgement carries with it the need for a set of very formal guidelines. In some instances this rigidity is essential. Many persons and institutions must be acknowledged formally for their professional help and expertise, and this assistance will be gratefully documented shortly. But I wonder if those around us ever really know how much they contribute to a PhD - not in a formal capacity, but simply by being there and being themselves. The husband who quietly slips a cup of coffee in front of you at three o'clock in the morning. The daughters who slip dinner into the oven. The son who untangles the mess you made on the computer. The neighbour who notices how tired you are and offers help. The friend who knows a break is essential and turns up with a bottle of wine. The Supervisors who never tire of your mindless questions. The Tutor, long since gone, who knew when to coerce or chastise. The office staff who never criticise your endless demands. The technician who can take a piece of wire and a length of string and build a drilling rig. Skippers and crew of Research Vessels who find it fun to manoeuvre a square peg into a round hole. Volunteers who think it's fun and make it fun. Volunteers who don't think it's fun but do it anyway. Public servants who open their hearts, their minds and their filing cabinets and say "Sure. I can help with that". Some will recognise themselves in this acknowledgement, but most will never know how much they have helped. Life becomes that little bit easier, and a whole lot more pleasant, with people like you around.. Formally, the help and assistance of numerous agencies, assistants, and individuals is gratefully acknowledged -. Dr. Sharon Ness and Dr. Christopher Cuff,. Geology Department, James Cook. University, refined and developed the technology necessary for the XRD analysis. Their assistance and knowledge was invaluable.. John Morrison, Sir George Fisher Centre for Tropical Marine Studies, James Cook University, can make anything work and often did. If I could document John's many skills, areas of expertise, sense of humour, patience, and plain darn stubborness when faced with a problem, I would set them down as prerequisites for all field work. xv.
(18) Manfred Mangolini, Sir George Fisher Centre for Tropical Marine Studies, James Cook University, conducted the AAS analysis. Manfred's help in numerous undefinable areas can never be underestimated.. Hugh Simmons, Geology Department, James Cook University, who sat with me through many hours to develop the spatial mapping programme on the SEM.. Paul Besant, Sir George Fisher Centre for Tropical Marine Studies, James Cook University, unravelled the intricacies of Multivariate Analysis and read, corrected, and re-read, countless versions of the statistical interpretation. Paul's ability to simplify complex issues was sorely tested.. Keith Barry, Radiographer, successfully established a method for X-raying very thin slabs of coral.. Robin Waterhouse, Radiologist, and his staff, for help and assistance with the radiography of the coral cores.. Geoff Charles, Manager of the Orpheus Island Research Station, established and nursed the experimental aquaria at the Research Station.. Chris Farr, Chemistry Department, James Cook University of North Queensland, installed the necessary electronics for the experimental aquaria.. Graham Grant, Lighthouse Keeper, Low Isles, who will forever be locked into the concept of collecting water samples on The Day The Ship Comes In".. Department of Environment and Heritage, formerly Queensland National Parks and Wildlife Service, Cairns, who always remembered the water samples no matter how rough the weather.. Australian Institute of Marine Science Analytical Laboratory Technical Staff who spent many hours explaining water sampling techniques and analytical procedures..
(19) Bruce Parker, Australian Institute of Marine Science, provided enormous support in the preparation and slabbing of the coral cores.. Al Diamond, Administrative Officer, Sir George Fisher Centre for Tropical Marine Studies. A very special thanks must go to Al who sorted through all the demented babblings of a frustrated research student until the problems disappeared.. To my husband, Charles, without whose kindness and help this PhD, regardless of its quality, would never have been completed, I extend a very special thanks.. Research funding was generously supplied bya the Great Barrier Reef Marine Park Authority.. Partial funding was also made available by provision of the Australian. Coral Reef Society Special Research Award, 1988.. The support of the Australian. Commonwealth Postgraduate Research Award is also most gratefully acknowledged.. To my examiners, for your patience, many many thanks.. And last, but definitely not least, to my two Supervisors, Professor David Hopley for allowing me the freedom to pursue the many fireflies that constantly fluttered through my mind, and Dr. Chris Cuff who spent hours patiently explaining the intricacies of chemistry and trying desperately to convince me that anything and everything could be reduced to a chemical equation.. xvii.
(20) LIST OF FIGURES VOLUME I. Figure 1:. Location of Australia's Great Barrier Reef. 1. Figure 2:. Location of the study area. 2. Figure 3:. Location of the study sites. 8. Figure 4:. Geology of the study area. 24. Figure 5:. Landuse in the study area (After: Valentine 1988). 25. Figure 6:. Figure 7:. Figure 8:. Figure 9:. Figure 10:. Figure 11:. Figure 12:. Figure 13:. Relationship between geology and landuse on the Atherton Tablelands Water balances for selected stations in North East Queensland (Source: Douglas 1973). 26. 27. Phosphate values in the Barron River near Yungaburra following the first rains of the season. 35. Regressions of stream PO, concentration over rainfall for the short-term dynamic study in the Barron River near Yungaburra, (a) to the first storm rains of the season, and (b) to the second rain period. 37. A conceptual model of some of the forces affecting stream phosphate flux in the Barron/Mossman River systems. 40. Soluble phosphate concentration and total phosphate load with climatic data. Sampling sites are grouped and the data averaged according to the land management practices of the area. 43. Soluble phosphorus concentrations are higher in the nearshore to midshelf reef areas during the wet, summer period. Concentrations are also high along the Barron River during this same period. Concentrations are also high at the nearshore sites of Low Isles and Cairns Leads during the coastal cane planting season. 49. Nutrient profiles for selected months. 50. xviii.
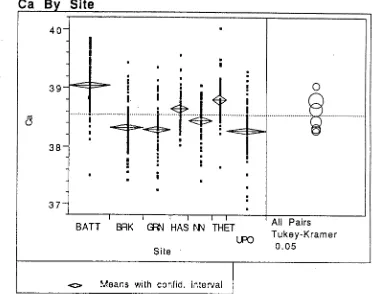
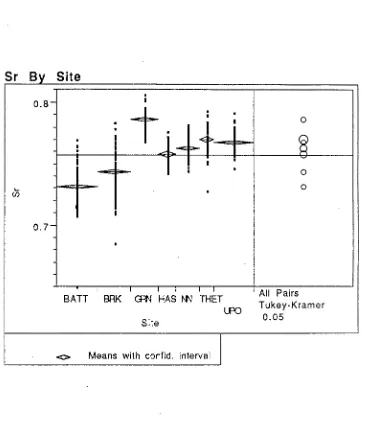
(21) Figure 14:. Figure 15:. Figure 16:. Figure 17:. Figure 18:. Figure 19:. Figure 20:. Figure 21:. Figure 22:. Figure 23:. Location of sampling sites on Low Isles, Great Barrier Reef.. 54. Biplot of multivariate centroid means with associated 95% confidence ellipsoids on the first two canonical axes exploring variation in chemical composition among locations, for the time period 1883-1902. 90. Graph showing mean calcium levels over time (1883-1902) for each location ± 95% confidence intervals. Means comparisons presented were assessed using Tukey-Kramer HSD Test (a=0.05). 91. Graph showing mean strontium levels over time (1883-1902) for each location ± 95% confidence intervals. Means comparisons presented were assessed using Tukey-Kramer HSD Test (a=0.05). 92. Graph showing mean magnesium levels over time (1883-1902) for each location ± 95% confidence intervals. Means comparisons presented were assessed using Tukey-Kramer HSD Test (a=0.05). 93. Localised variations in the timing and intensity of the strontium concentration in the Green Island Polites core. 95. Biplot of multivariate centroid means with associated 95% confidence ellipsoids on the first two canonical axes exploring variation in chemical composition among locations for sample sets covering the time span n-1987. 105. Graph of mean calcium concentration for each location over time (n-1987), ± 95% confidence intervals. Means comparisons presented were assessed using Tukey-Kramer HSD Test (a=0.05). 107. Graph of mean strontium concentration for each location over time (n-1987), ± 95% confidence intervals. Means comparisons presented were assessed using Tukey-Kramer HSD Test (a=0.05). 109. Graph of mean magnesium concentration for each location over time (n-1987), ± 95% confidence intervals. Means comparisons presented were assessed using Tukey-Kramer HSD Test (a=0.05). 111. xix.
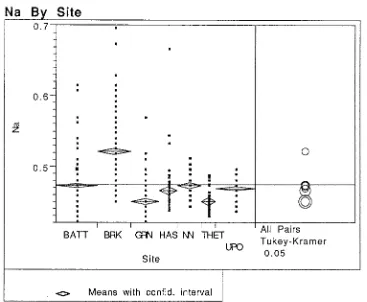
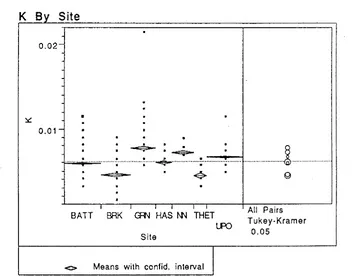
(22) Figure 24:. Figure 25:. Figure 26:. Figure 27:. Figure 28:. Figure 29:. Figure 30:. Figure 31:. Figure 32:. Graph of mean sodium concentration for each location over time (n-1987), ± 95% confidence intervals. Means comparisons presented were assessed using Tukey-Kramer HSD Test (a=0.05). 111. Graph of mean potassium concentration for each location over time (n-1987), ±. 95% confidence intervals. Means comparisons presented were assessed using Tukey-Kramer HSD Test (a=0.05). 113. Graph of mean iron concentration for each location over time (n-1987), ± 95% confidence intervals. Means comparisons presented were assessed using Tukey-Kramer HSD Test (a =0.05). 116. Biplot of multivariate centroid means with associated 95% confidence ellipsoids on the first two canonical axes exploring variation in chemical composition of calcium, strontium and magnesium between locations, for sample sets covering the two time periods pre-1950 and post-1950. 121. Biplot of multivariate centroid means with associated 95% confidence ellipsoids on the first two canonical axes exploring variation in chemical composition of calcium, strontium, magnesium, potassium, sodium and iron among locations, for sample sets covering the two time periods pre-1950 and post-1950. 124. Estimation of calcium outlier distances using the Mahalanobis Distance of each point from the multivariate mean. 126. Average linear extension with average strontium content from selected decades. Thetford Reef has been eliminated from this data set because of insufficient material. 134. Annual strontium content of the sample set from Green Island Reef plotted against annual rates of linear extension. 136. Graph of mean Green Island magnesium concentration for each decade ± 95% confidence intervals. Means comparisons presented were assessed using Tukey-Kramer HSD Test (a=0.05). 141. )0C.
(23) Graph of mean Green Island potassium concentration for each decade ± 95% confidence intervals. Means comparisons presented were assessed using Tukey-Kramer HSD Test (a=0.05). 143. Graph of mean Green Island sodium concentration for each decade ± 95% confidence intervals. Means comparisons presented were assessed using Tukey-Kramer HSD Test (a=0.05). 143. Graph of mean Green Island iron concentration for each decade ± 95% confidence intervals. Means comparisons presented were assessed using Tukey-Kramer HSD Test (a=0.05). 145. Figure 36:. Skeletal porosity of the Green Island sample set. 148. Figure 37:. Trend lines indicating the association between skeletal porosity in the Green Island sample set and the use of total fertiliser on the nearby mainland. 149. Examination of the shifts in the anticipated XRD (111) aragonite peak reflection for the Green Island sample. 150. Mean Sea Level Pressure read at Darwin and Townsville (r=0.8236, n=37, a=0.001). 159. Examination using 10x10 year moving averages indicates a positive coherence between the SOI and XRD anomalies at No Name Reef. 163. Examination using 10 x 10 year moving averages for the Green Island XRD (111) anomalies and Darwin MSLP indicates a positive correspondence. 164. Annual variations between the Index of the Southern Oscillation and deviations in the location of the Aragonite (111) reflection in the No Name Reef sample. 168. Annual variations of Mean Sea Level Pressure at Darwin, and deviations in the location of the Aragonite (111) XRD reflection in the Green Island sample. 169. Figure 33:. Figure 34:. Figure 35:. Figure 38:. Figure 39:. Figure 40:. Figure 41:. Figure 42:. Figure 43:.
(24) Figure 44:. Figure 45:. Figure 46:. Variations between the June/July/August (winter) average SOI and annual deviations in the location of the Aragonite (111) reflection in the No Name Reef sample. 169. Variations between the September/October/November (spring) average Darwin MSLP and annual deviations in the location of the Aragonite (111) reflection in the Green Island Reef sample. 170. Variations between the June/July/August (winter) average Darwin MSLP and annual deviations in the location of the Aragonite (111) reflection in the Green Island Reef sample.. 170. LIST OF FIGURES VOLUME H Figure Al. Geographical location of reefs sampled. Figure A2. Location of drilling sites at selected reefs. Av Avi.
(25) LIST OF TABLES VOLUME 1 Table 2.1:. Seasonal rainfall extremes in the study area. 10. Table 2.2:. Elemental nutrients applied to fields of the Atherton Tablelands. Source: Valentine (1988). 16. Breakdown of the Barron\Mossman River catchments into areas of similar land management practices. 41. Pearson's Product Moment correlations for stream phosphate concentration at the South Mossman River and Newell Point sampling sites, and phosphate concentration at Low Isles (after removal of the outlier). All terrestrial samples were taken early in the month (within the first three days). Low Isles samples were taken (a) early in the month, and (b) mid-month. 47. Assessed mineralogy of the Low Isles sediments. Mineralogy detected using X-ray Diffractometry on the <63 micron portion of the sediments. 57. Soluble phosphate concentrations released from the <63 micron portion of the Low Isles sediments following six sequential treatments in freshwater at 26oC + agitation; in saltwater at 26°C + agitation; in saltwater at 40°C + agitation; and in saltwater at 60°C + agitation. 58. Pearson's Product Moment Correlations for phosphate concentration released from the sediments of Low Isles Reef Flat, under a number of treatments designed to simulate environmental conditions. 60. Soluble phosphorus concentrations released from the <65 micron portion of the Low Isles sediments of the Northern Gap following six successive treatments Freshwater at 26°C; Saltwater at 26°C, 40°C and 60°C. 62. Superphosphate analysis according to the label of the commercial brand "Superphosphate". 77. Average measurements of actively growing tips from experimental A.formosa over a twelve week period. 78. Table 3.1:. Table 3.2:. Table 3.3:. Table 3.4:. Table 3.5:. Table 3.6:. Table 4.1:. Table 4.2:.
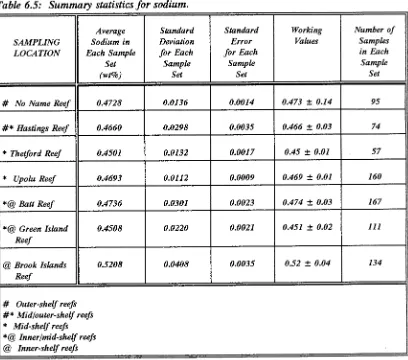
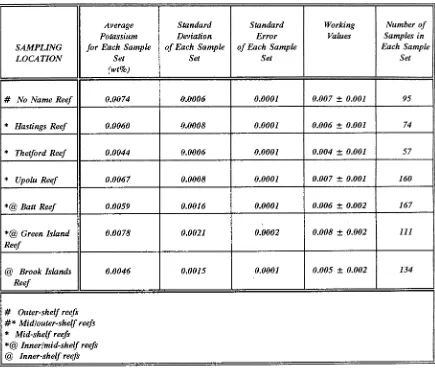
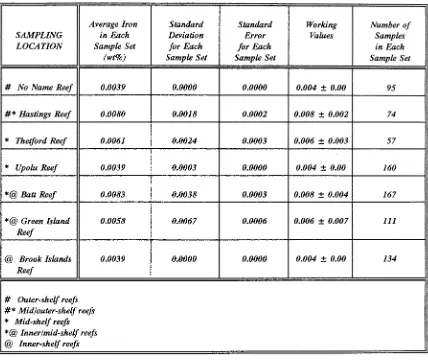
(26) Table 6.1:. Period covered by each sample set and the location of the sample sets on the Continental Shelf. 98. Table 6.2:. Summary statistics for calcium. 106. Table 6.3:. Summary statistics for strontium. 108. Table 6.4:. Summary statistics for magnesium. 110. Table 6.5:. Summary statistics for sodium. 112. Table 6.6:. Summary statistics for potassium. 114. Table 6.7:. Summary statistics for iron. 115. Table 6.8.. Total values, all elements analysed. 117. Table 6.9.. Average values for calcium, strontium, magnesium, potassium, sodium and iron, for the two periods pre- and post-1950. 125. Proxy seawater temperatures estimated using (a) Weber's (1973) calculations - 68 ppm strontium variation per degree C variation (based on 7627 ppm strontium at No Name Reef = a known sea surface temperature of 26.7°C at Yonge Reef, approximately 20 km north of No Name Reef), and (b) Schneider & Smith's (1982) equation - Sr:Ca x 10' = 10.94 - 0.070T(°C). 129. Average skeletal strontium content and skeletal growth rate for the periods 1920-29, 1930-39 and 1980-87. 133. Correlations of various parameters associated with indices of the Southern Oscillation (Darwin MSLP) and the strontium content of samples from No Name and Green Island Reefs. 162. Table 6.10:. Table 6.11:. Table 7.1:. xxiv.
(27) LIST OF TABLES VOLUME II APPENDICES. Aiii. Table Al:. Geographic Location of reefs studied. Table A2.. Estimated Visitor Impact on Reefs Studied. Aviii. Table A3.. Estimated distance from possible source of nutrient supply. Aviii. Table A4.. Semi-quantitative values assigned to sediment mineralogy from the Low Isles reef flat. Mineralogy determined using X-ray Diffractometry. Axiii. Table A5. Aragonite Internal Standard - Composition. Axix. Table A6. Verification of Scanning Electron Microscopy techniques developed for examination of skeletal porosity in Porites samples. Replicate examination was conducted on samples removed from three different annual bands and analysed at varying intervals to determine sampling accuracy and sample homogeneity. Analysis followed the same methods outlined above. Natural variation will occur throughout the sample because of the high and low density bands characteristic of the Porites coral. Axxi. Table A7. Verification of XRD Methodology. To verify the reliability of the procedure, seven smear mounts were prepared from each of several specimens. Values represent the degree of deviation from the anticipated location of the XRD (111) aragonite peak. All replicates are from Green Island. Axxii.
(28) LIST OF PLATES Plate 1 Linear extension of actively growing Acropora formosa growth tips under controlled experimental conditions. Arrow indicates beginning of experiment. (a) Control (b) 2 RIVI (c) 4 gIVI (d) 8 p.1\4. 80. Plate 2 Internal morphological changes of Acropora formosa growth tips following the addition of varying levels P043- (c) 4 RM P043of P043-. (a) Control (b) 2. 81.
(29) ANTHROPOGENIC DISTURBANCE OF ENVIRONMENTAL SIGNALS RETAINED IN MASSIVE CORALS.
(30) 142.. 144.. 346*. !a9•. 150•. 157,. CORAL. SOUTH. CARPENTARIA. Cooktown. Dantlee. ft. Mossman. 90”... 9. PACIFIC. Cairgs ATHERTON TABELAND Tunisian Mourrlyan. 01,11140. Kurrinune. nee Connie.. Macka. QUEENSLAND flunclaberg. CooToola. SOUTH BRISBANE Southport Gem Coss,. SOUTH. NEW. Figure 1:. Location of Australia's Great Barrier Reef. 1. WALES.
(31) Figure 2:. Location of the study area..
(32) CHAPTER 1. ANTHROPOGENIC SIGNALS IN MASSIVE CORALS AN INTRODUCTION TO THE CONCEPT OF THE THESIS AND SELECTION OF THE STUDY AREA. 1.1. INTRODUCTION. Considerable debate exists about the extent of anthropogenic influence on Australia's Great Barrier Reef. A great deal of this debate surrounds the issue of nutrient enhancement (Baldwin et.al, 1987; Yellowlees 1990). Ideally, ambient conditions should be known before the onset of any change. Without baseline information, researchers and managers often resort to comparative, experimental, or short-term historical records to understand perceived alterations. Under such circumstances cause and effect situations can be inferred, but without long-term knowledge on the natural variability of the system, inferences must remain tenuous. Interpretations of ecosystem dynamics arising from such methods are ambiguous and invite argument.. Sclerochronology has the potential to provide the necessary information of past environmental conditions. Various trace elements (e.g. strontium, magnesium, sodium, potassium, iron, barium, cadmium and lead), incorporated into biogenic carbonates at the time of deposition, have previously been used as proxy indicators of environmental parameters including oceanic temperature, salinity, nutrient concentration, and rainfall timing and intensity (e.g. Houck et.al. 1977; Druffel 1981, 1982; Isdale 1981, 1984; Schneider & Smith 1982; Druffel & Suess 1983; Shen et.al 1987; Linn et.al 1990).. Use of massive corals with a sclerochronological history pre-dating anthropogenic influence allows interpretation of data laid down in the skeleton prior to major manipulation of adjacent systems. In the Indo-Pacific the massive Porites coral produces the most suitable material for sclerochronological studies because (a). individual corallites are small (Veron 1986) producing a finely grained, dense skeleton,. 3.
(33) alternating density bands enable the skeleton to be dated with a reasonable degree of accuracy (Knutson et.al 1974), Porites form some of the largest coral colonies, reaching heights of around eight metres with an average growth rate of around 9 mm per year. Individual colonies may be in excess of 1000 years old (Veron 1986). Theoretically, therefore, paleoenvironmental interpretation using massive corals should be restricted only by the age of the colony and knowledge of the relationships between seawater and the chemical and physical properties of the skeleton.. 1.2. SELECTION OF THE STUDY AREA. Although the majority of Australia's Great Barrier Reef is sufficiently distant from the mainland to be considered relatively free of terrestrial influence (Figure 1), in the northern sector between latitudes 15°S and 18°S, the shallow continental shelf narrows to approximately 40 km (Figures 1 & 2). Rainfall on the adjacent mainland is high, the hinterland is rugged, and the area between Cairns and Mossman has been significantly altered for agricultural and urban purposes. Hence, the potential exists for the rapid transfer of agricultural and urban additives from the mainland to the vicinity of the reefs.. It has been suggested that Crown-of-Thorn infestations could be related to enhanced levels of nutrients from anthropogenic sources (Endean 1973). Other research has suggested that the Green Island/Low Isles area adjacent to the Cairns/Mossman hinterland (Figures 1 & 2) may be a primary source of Crown-of-Thorn infestations to the Great Barrier Reef (Kenchington 1977). Therefore, study of this area also has application to the whole of the Great Barrier Reef and the most highlighted problems of the last 30 years.. 1.3. PREVIOUS WORK BY THE AUTHOR SUGGESTING THE POSSIBILITY OF USING SCLEROCHRONOLOGY TO DETECT ENVIRONMENTAL CHANGE ON CORAL REEFS. Earlier work conducted by the author on Low Isles (Figure 3), suggested that many geomorphological changes that had taken place between 1928-29 (the time of the first Royal Society expedition to the Great Barrier Reef) and 1986 (Rasmussen 1986),. 4.
(34) could not be attributed to simple reef biological and morphological processes. The expansion of seagrass beds, mangroves and soft coral colonies, the spread of filamentous algae, the increased availability of shingle, and the decline in live coral cover, suggested a reef under stress. Comparisons with a morphologically similar low wooded island also studied by the 1928-29 Expedition (Three Isles, 200 km to the north and distanced from a settled section of the mainland) did not show evidence of similar changes. Research by numerous authors worldwide has attributed similar changes on nearshore coral reefs to terrestrial alteration of adjacent areas (e.g. Smith et.al 1981; Cortes and Risk 1985). Geochemical and geomechanical analysis of a coral core removed from a Porites colony at Low Isles provided additional circumstantial evidence of anthropogenic perturbations in the water around the growing coral (Rasmussen 1986). Examination of fertiliser data (Australian Bureau of Statistics) showed a strong inverse relationship between the use of phosphatic fertiliser and strontium content of the Porites skeleton. The results suggested that the geochemical and geomechanical properties of massive corals had the potential to provide the necessary medium for understanding changes in the marine system, including those of anthropogenic origin possibly related to nutrient enhancement.. 1.4. THE POSSIBILITY THAT ENHANCED LEVELS OF PHOSPHATE COULD LEAVE A SIGNAL IN THE CORAL SKELETON SUITABLE FOR USE AS A SURROGATE INDICATOR OF NUTRIENT ENHANCEMENT. Whether phosphorus or nitrogen exerts the major influence on organic production in the sea remains a controversial issue (Smith, 1984; Smith et.al 1989). However, there is little or no literature on either systemic or systematic effects of nitrogen bearing species (e.g. NH4, NO3) on crystallisation in aqueous calcium carbonate systems'. On the other hand, it has been known for over 50 years that PO4 exerts a systematic effect on crystallisation in such systems (e.g. see Rosenstein 1936; Reitemeier & Buehrer 1950; Simkiss 1964a).. It is not the intention of this study to investigate the chemical pathways followed by various elements in the process of skeletogenesis. This study will concentrate on the. Following the experimental component of this thesis, Belda et.al 1993, examined the effects of combined nutrients on the skeleton of the giant clam Tridacna gigas. Their research demonstrated that P, N and P+N all had a deleterious effect on skeletal architecture. 5.
(35) signals retained within the coral skeleton, and attempt to link those signals to environmental changes on the nearby mainland, and in particular with the use of phosphatic fertiliser in adjacent areas. It is acknowledged that agriculture seldom uses only one variety of fertiliser, nor are commonly available fertilisers made up of a single element. Therefore, until the effects of nitrogen enhancement in skeletal material can be separated from those of phosphorus, any signals believed due to elevated levels of phosphorus in the sea can only be considered proxy indicators of total nutrient enhancement.. 1.5. RESEARCH PLAN. A research plan was established to promote interpretation of proxy environmental signals from the corals. For the reasons outlined above, the section of the Great Barrier Reef adjacent to the Cairns/Mossman hinterland (Figure 1) was considered the area best suited to the study. The program was designed to include (1) The examination of samples of Porites corals taken from a number of It was reasoned that if evidence of geographically dzfferent areas. anthropogenic change could be detected in the coral skeleton, then such change should vary with proximity to the source of the influence, and with the increased incidence of European settlement on the nearby mainland. Therefore, it was necessary to remove samples from a number of Porites colonies at a variety of locations within the Cairns Section of the Great Barrier Reef Marine Park. Each core needed to be long enough to include material pre-dating European impact (approximately 130 years). The examination of elevated levels of phosphate on the growth kinetics of reef corals. Because there was little information on the effects of elevated levels of phosphate on coral skeletal material, experimental research was necessary. Controlled experiments were planned for aquaria at the James Cook University Orpheus Island Research Station. The examination of the nutrient status of streams, rivers and adjacent marine waters in the study area. Following the Low Isles study (Rasmussen 1986) outlined above, considerable argument suggested that phosphate was 'fixed' into the soil profile, and that any phosphorous that may be delivered into the ocean would be quickly utilised by resident marine flora and fauna (Furham 1987; Orrett & Karl 1987; Kuhn 1990; Moody & Chapman 1990; Furnas 1990; Thomson 1991). It was considered necessary, therefore, to undertake limited studies of the nutrient dynamics of both the terrestrial and marine segments of the study area. Lack of information on the generation and transport of nutrients through the fluvial system into the marine environment, under North Queensland climatic conditions, also 6.
(36) necessitated this part of the study. Information gained from the monitoring program is used, not to fully document the nutrient flux, but to demonstrate the potential of agricultural areas to generate high levels of nutrients to nearby rivers, the importance of rainfall events in raising the nutrient status of river systems draining these agricultural lands, and the relationship between rainfall events, river discharge, agricultural practices and nutrient enhancement in adjacent marine waters.. The synthesis of these areas of study, as discussed in Chapter 8, suggests that the corals examined do retain a record of environmental change. A long-term variability apparently associated with the main driving force of North Queensland weather, the El Nirio Southern Oscillation, is over-ridden in recent times by a dominant anthropogenic influence.. 7.
(37) LOCALITY MAP ,$) Undine Re Ale,tondro Boy Opal Reef. ,k). •. SITE (19) Newell Pt. 16'30'. Mossman N fit. Mias mal R. — RA MOIRA", R. —yi. TonguelReef. Low Isles. SITE '1181 Cooyah Beach. Boll Reef. Norman Reef ` c...1 Saxon Reef. • Pert Dou.las. • •. SITE (17) Sth. Mossman R.. ,1Hastings % Hope Reef Reef an6) ) Michaelmas. Reef. (— Upolu Coy( 1 : ‘1. Arloglon Reef Euston Rent. N. SITE (131 Myola S E (9) B on Biboohra SITE ( Mareeba. !rot).. an. SI E (12) SITE 14) ko. L. Plac. V. e Milln Reef. -4 . „. r\cope ,Grafton. ,. es. 9. • Gordonvale. c. •. Sudbury Reef. \. Tincroo Falls Dam‘. IT (2) Atherton S0 SITE (I). •. OSS. f— a& 0. . Bridge. SITE (3) Tinaroo Kaki II. Frankland %. Islands. UG. Malanda. fi 17'30'. Innisfail SCALE km 20. 10. to. 20 km. LOCATION MAP. STUDY AREA. Figure 3: Location of study sites.. Moore Pee ,. r Al Fitzroy Island. ITE (0) hesy R. SITE (Ie). SITE (5) Edmund Kenne. * Flynn Reel. Trinity Bay. CAIR. SITE (8) Sl4E (7) Enterald. s SITE (4) Heiyy Hannikn. Grcnle. SITE (161 Thomas C.* Green Island SITE (15) Thetford Reef Freshwater C.. le Flora Reef.
(38) CHAPTER 2 THE ENVIRONMENT OF THE STUDY AREA. 2.1. THE CAIRNS-MOSSMAN AREA AND ITS HINTERLAND THE POTENTIAL FOR IMPACT IN ADJACENT MARINE ENVIRONMENTS. Geologic, biologic, climatic, oceanic and tectonic forces (Hopley 1982) have produced a particularly diverse community of reefs and islands near an equally diverse tropical rainforest environment in the Cairns region. Climatic conditions and the perceived fertility of rainforest soils have encouraged the expansion of primary industries. Before European settlement most of the coastal areas of Northeast Queensland and the Atherton Tablelands were forested. The luxuriant growth of the rainforests was thought to indicate highly fertile soils capable of returning high agricultural yields. Between 1918 and 1932 agrarian development increased by 100% in the Cairns/Mossman district. The construction of an irrigation network associated with the completion of Tinaroo Dam in 1958 allowed major expansion of agriculture to spread into drier areas of the Atherton Tablelands.. The effect of land clearance on the fluvial system has been well documented (e.g. see Ward 1975). However, in the Cairns/Mossman region, the climate can be erratic and extreme. The "wet season" in North Queensland broadly covers the period November to April, but intensity, duration, and onset vary dramatically. For example, in 1973/74 Atherton recorded 2391 mm of rain from 121 raindays, with nearly half falling over a 28 day period in March (1107 mm). By contrast, the total 1977/78 seasonal rainfall (716 mm) was less than that of March 1974. Seasonal variations are further displayed in Table 2.1.. Annual rainfall occasionally exceeds 5000 mm along the coastal strip between Cairns and Mossman. Individual rainfall events during the 'dry' season can produce daily totals of more than 100 mm (Australian Bureau of Meteorology). During spring and early summer, intense thunderstorms of short duration are often responsible for falls of 40 mm in less than 20 minutes (Douglas 1973). Under such circumstances, the effects of man. 9.
(39) superimposed on to the climatic regime outlined above combines to create a rapid and efficient method of transportation. In an area where geological characteristics produce a profile conducive to erosion, the effect will be exacerbated.. Table 2.1: Seasonal rainfall extremes in the study area. WET SEASON. SEASONAL AVERAGE (ATHERTON). DRY SEASON. SEASON (NOV-OCT). TOTAL YEARLY RAINFALL (mm). NUMBER OF RAIN DAYS FOR YEAR. ONSET OF WET SEASON. HIGHEST RAINFALL MONTH (mm). RAINFALL (mm). RAINDAYS FOR THAT MONTH. 1973/74. 2776. 152. NOVEMBER (238 mm). MARCH (1107). 77 (AUGUST). 2. 1977/78. 716. 171. NOVEMBER (15 mm). JANUARY (196). 31 (AUGUST). 15. Source: (Australian Bureau of Meteorology). 2.2. THE TERRESTRIAL ENVIRONMENT OF THE STUDY AREA. 2.2.1. GEOGRAPHICAL CHARACTERISTICS The Barron River and its tributaries link the Atherton Tablelands to the Great Barrier Reef Lagoon (Figures 1,2 & 3). Draining a catchment of 2100 km2 from its headwaters near Mt. Hypipamee (elevation 1100 m) over a distance of approximately 160 km, the Barron River enters the ocean approximately 12 km north of Cairns.. The coastal strip between Cairns and Mossman includes the catchments of the Lower Barron River and its anabranch Thomatis Creek, Freshwater Creek, South Mossman River, North Mossman River and Newell Creek (Figure 3). Freshwater Creek drains sugarcane farms before joining the Barron River just prior to discharge into Trinity Bay. The Thomatis Creek anabranch of the Barron River drains sugarcane farms, and enters Trinity Bay north of the main mouth of the Barron River. South Mossman River, North Mossman River and Newell Creek are short runoff streams draining sugarcane lands. The major contribution of the short runoff streams to the hydrology of the area occurs during periods of short duration under the intense precipitation of the wet tropical environment. The mouths of all rivers support extensive estuarine mangrove habitats. 10.
(40) 2.2.2. GEOLOGICAL AND PEDOLOGICAL CHARACTERISTICS The geology of the area is shown in Figure 4. In the upper reaches of the Barron River catchment parent material is mainly Atherton Basalt, with small inliers of Barron River Metamorphics around Yungaburra, and Elizabeth Creek Granite on the southwestern boundary. The major group of sedimentary rocks in the northwest area of the Atherton Tablelands is the Hodgkinson Formation. This formation comprises thick monotonous sequences of massive to thin bedded sandstone, greywacke and mudstone, with intercalated chert, conglomerate, breccia, and rare limestone lenses (Douglas 1973). In the northern section of the Tablelands the river flood plain has established large areas of alluvium from parent material in the upper catchment.. On the Atherton Tablelands the soils are primarily structured sesquioxides with fine granular or crumb structure (Gillman and Sumpter 1985). Chemical properties of the soils are determined by the parent rock. Depending on soil parent material, the clay mineralogical composition is dominated by kaolinite, with various amounts of iron and aluminium hydroxides and oxyhydroxides, chloritized vermiculite, and illite (Gillman and Sumpter 1985). The clay content of the soils formed from the basalt of the Atherton Tablelands is at least three times greater than those of the other soil types (Toreu et al 1988). The basaltic clays of the area are dominated by oxides of iron and aluminium, greatly increasing the ability of the soils to sorb phosphates (Toreu et al 1988). Soils formed on the granites have a lower clay content of a longer range order than those present in the basaltic soils, indicating a lower specific surface and a reduced capacity to sorb phosphate (Toreu et al 1988). The P-sorption characteristics of soils formed on metamorphic rock or alluvial parent material are intermediate between those of basaltic and granitic origin, dependent upon clay content and composition (Toreu et al 1988). In the north and east of the Barron catchment, large areas of soils have formed from Barron River Metamorphics. Douglas (1973) suggested the high silicate content of these sediments produced easily erodible, nutrient poor soils following removal of the natural vegetation.. Soils along the coastal strip are a combination of (a) highly weathered material formed on basaltic, granitic and metamorphic rocks (Toreu et al 1988),. 11.
(41) alluvium and colluvium derived from one or more of the parent materials (Toreu et al 1988), with a significant input from coastal marine deposits (Jones 1985).. 2.2.3.. THE EFFECTS OF CLIMATE AND HYDROLOGY ON SEDIMENT YIELD. The area has been the location for several studies on water movement and sediment yield (e.g. see Douglas 1966 and the summarisation by Pringle 1986). It is now also known that North Queensland's weather patterns are strongly influenced by the intensity and duration of the El Nitio Southern Oscillation (ENSO) (e.g. see McBride & Nicholls 1983; Allan 1988, 1991). ENSO is a family of oceanographic and meteorological events closely linked to the oscillation between the South Pacific subtropical high (measured at Tahiti) and the Indonesian equatorial low (measured at Darwin, Australia). Variations between the two pressure cells provide an indication of the intensity of the ENSO event (Quinn et al 1978). An ENSO year is associated with a weakening of the equatorial easterly winds and the strengthening of the westerlies above Queensland (Australia), forcing a mass of warm water across the Pacific (e.g. Quinn et al 1978; Rasmusson & Carpenter, 1982; Rasmusson & Wallace 1983). As a consequence, sea levels rise along the west coast of South America. The slope of the oceanic mixed layer across the Pacific is reversed, depressing the thermocline on the equatorial eastern side of the ocean. Equatorial upwellings of cold nutrient rich water induced by the combination of trade winds and the coriolis force are restrained. Sea surface temperatures become warmer in the eastern Pacific and slightly cooler in the western Pacific (Rasmusson & Carpenter 1982). During periods of strong ENSO activity (the active phase of the ENSO cycle) heavy rains occur in southern Ecuador and northwest Peru and droughts are experienced in Australia. During periods of anti-ENSO activity (the passive phase of the ENSO cycle), the reverse applies. Sea surface temperatures warm in the western Pacific, cyclonic activity increases along the north Australian coast, heavy rains occur in Australia (McBride & Nicholls 1983), with droughts in Ecuador and Peru.. Climatic conditions in North Queensland are generalised as tropical. However, distance from the sea, elevation, and location of coastal highlands and ranges, mean sharp contrasts in rainfall and temperature can occur within very short distances. 12.
(42) (Report by the Commonwealth Department of National Development and the Queensland Department of Industrial Development 1971). Therefore, while summer temperatures of above 38°C are common, in the higher areas of the Atherton Tablelands frosts can occur during the short winter period. Consequently the Atherton Tablelands experience a sub humid to humid climate with marked wet/dry seasons (Department of Primary Industries note, Anon), with more than 85% of the rain falling in the December to March period.. The coastal strip of the North Queensland wet tropics receives very high rainfall, occasionally over 5000 mm per annum. Rainfall is strongly seasonal (predominantly summer), of long duration (four to six months), and often intense. Precipitation rates of 3300 mm were recorded during a two week period in 1979 (Australian Bureau of Meteorology).. Thus, soils in the area are at, or above, field capacity. during most of the wet season (Douglas 1973; Figure 7). However, although rainfall is strongly seasonal, heavy downpours can occur throughout the year. Individual rainfall events during the 'dry' season can produce daily totals of more than 100 mm (Gilmour et al 1982). Hydrologic processes consistent with such environments are constantly operating to transport moisture and nutrients from the saturated zone to the water table, and respond rapidly to rainfall events resulting in saturated overland flow and accompanying soil movement. Prove (1987) has shown that under the conditions operating along the wet tropical coastal strip of North Queensland, high intensity rainfall causes overland flow (or runoff) to occur. Douglas (1973) also showed that in the Barron River catchment, the high runoff per unit area makes large quantities of dissolved, matter available for evacuation. Most of the material removed from these very wet catchments is carried in suspension or as bed load (Douglas 1973). The estimated ratio of dissolved to suspended load is approximately 0.5 with over 50% of the sediment load removed on fewer than seven days of the year (Douglas 1973). Under cultivated conditions evacuated material could be expected to be considerably higher.. Douglas (1973) considered that climate was the most important controlling factor for runoff processes in the Barron River catchment. Under normal conditions hydrological processes are controlled by the synergistic interaction of rainfall 13.
(43) variability, seasonality, intensity, duration and timing. Douglas (1973) concluded that when the effects of man are superimposed on to a strongly seasonal climate with sudden, intense precipitation of long duration, and with periods of intense wet interspersed with periods of extreme dry, the combined effects produce a rapid and efficient method of transportation from the terrestrial to the marine environment.. The importance of these combined effects on the transportation of sedimented particles is shown in Douglas's (1973) water balance diagrams (Figure 7). Before the onset of the wet season, air temperatures are high and cloud cover low. Evaporation exceeds precipitation and soil moisture loss is extreme. Fields are prepared and crops sown specifically to take advantage of the first storm rains. Therefore, most of the fields are free of vegetative cover when the first rains occur. Trash retention and minimum tillage have not been normal land management practice in the Cairns/Mossman district and adjacent hinterlands. Relatively little flat land is available for farming. The first storm rains (November/December) of the wet season (November to May) are often sudden and intense. Precipitation during this period contributes significantly to overland flow and/or sheet flow before infiltration into the soil profile. Soils during this period are particularly vulnerable to erosion.. Erosion is a major problem on the Atherton Tablelands, with the most severe erosion in the cultivated areas around Atherton (Kneipp & Bolt, 1971). Comparisons between a rainforest area at the headwaters of the Barron River and an area further downstream draining agricultural lands, showed that following Cyclone Flora in 1964, peak flows in the agricultural area carried approximately three times more sediment than equivalent flows in the headwaters (Douglas 1973). The larger amount of sediment removed from the lower section of the catchment was attributed to the direct supply of sediment from ploughed fields, to water erosion between the rows of young maize plants, and to the undercutting of stream banks.. The hydrology of streams draining basalt terrains is further affected by the underground drainage of the basalt (Douglas 1973). The deep circulation of groundwater in the basalt of the Atherton Tablelands reduces streamflow at the beginning of the wet season but maintains a steady baseflow during the winter. Therefore runoff per unit area during the dry season at Mareeba, just below the basalt outcrop, can be higher than at Kuranda in the wetter coastal hills (Douglas 1973). 14.
(44) 2.2.4. AGRICULTURAL PRACTICES AND FERTILISER APPLICATION. Historical Background: Landuse has changed considerably over the last 130 years. Before European settlement most of the Atherton Tablelands and the coastal area between Cairns and Mossman were forested. Interest in the economic viability of the North Queensland area was initially stimulated by rainforest timber. Climatic conditions and the perceived fertility of rainforest soils encouraged the expansion of primary industries. Agriculture began in cleared areas in the 1880's. By 1906 much of the wet tropical coastal lowland had been cleared for sugar cane cultivation and the northwest part of the Atherton Tablelands for crops and dairying. By 1918 large areas of the Atherton Tablelands had been cleared for dairying (Pringle 1986). Although land clearing slowed during the 1920's because of difficulties in the more marginal areas, within previously cleared areas there was a marked increase in cultivation and pasture development (Pringle 1986). Agrarian development continued to increase on the Atherton Tablelands and in the Cairns to Mossman Districts (Frawley 1983). Completion of the Tinaroo Dam on the upper reaches of the Barron River in 1958, and the accompanying network of irrigation channels, had two effects on the Tablelands, (1) intense farming methods were now possible, and (2) agricultural expansion spread into the marginal areas of the Tablelands. By 1960, when it became clear that greater capital investment was needed in farming, only remnant forest remained in steeper areas between clearings (Frawley 1983; Pringle 1986).. Current Land Management Practices: Most agriculture on the Atherton Tablelands takes place on the deeply weathered basaltic soils with a high clay content (Loader 1987). The interrelationship between agricultural practices and geology is shown in Figure 6. Most of these soils have acid extractable phosphorus levels over 20 ppm. These values are considered sufficient for the major agricultural practices of the Tablelands (Loader 1987). Other areas of the Tablelands are deficient in phosphorus (Crosthwaite, 1983, p44), using considerable quantities of phosphatic fertiliser for efficient production. Historical farming practices, however, also control fertiliser application incidental to crop or soil requirements. Only 18% of the phosphatic fertiliser applied to peanut plantations was based on scientific analysis (Loader 1987). Table 2.2 summarises the major use of individual fertilisers in the Barron River catchment.. 15.
(45) Table 2.2: Elemental nutrients applied to fields of the Atherton Tablelands. Source: Valentine (1988) Above Tinaroo Dam Nitrogen. Phosphate. Potassium. Sulphur. Rate. Total. Rate. Total. Rate. Total. Rate. Total. kg ha.'. kg. kg ha.'. kg. kg ha-'. kg. kg ha.'. kg. ORCHARD. 40.0. 16545. 12.0. 4898. 13.8. 5667. 12.7. 1938. DAIRY. 51.0. 475348. 12.0. 111738. 15.6. 146267. 9.7. 90643. BEEF. 10.3. 82918. 5.9. 47616. 5.9. 47572. 7.0. 56261. MAIZE. 86.2. 230631. 13.6. 41092. 2.4. 7152. 7.7. 23381. POTATOES. 151.0. 35947. 114.3. 27256. 93.2. 22229. 224.6. 53568. PEANUTS. 10.0. 15116. (?)3.7. (?)5570. 1.5. 2297. 4.7. 7073. SUGAR. 187.0. 24330. 54.5. 7094. 124.0. 16130. 82.0. 10643. Landuse. 910835. TOTAL YR -I. 243507. 247314. 245264. (?) possible discrepancy in data (see text) Below Tinaroo Dam Sulphur. Potassium. Phosphate. Nitrogen Rate. Total. Rate. Total. Rate. Total. Rate. Total. kg ha.'. kg. kg ha"'. kg. kg ha"'. kg. kg ha.'. kg. ORCHARD. 72.4. 76692. 13.6. 14466. 58.8. 62334. 43.3. 45869. PEANUTS. 8.9. 30467. 26.9. 92182. 1.3. 4439. 24.4. 83763. MAIZE. 88.5. 263321. 35.4. 105324. 0.4. 1287. 13.1. 39130. BEEF. 6.2. 94023. 4.2. 64644. 0.5. 8357. 4.2. 64656. POTATOES. 147.6. 55778. 123.6. 46720. 125.2. 47341. 181.0. 68549. RICE. 181.8. 86150. 28.0. 13310. 5.3. 2519. 28.0. 13325. TOBACCO. 130.4. 167461. 53.6. 68863. 290.0. 373112. 32.3. 41525. FEED. 23.5. 38806. 10.8. 17917. 0.4. 598. 12.2. 20064. SUGAR. 148.0. 292525. 28.2. 55736. 108.4. 213987. 18.3. 36164. OTHER. 89.8. 39999. 22.6. 10071. 23.4. 10420. 20.4. 9084. TOTAL YR" I. 1145222. 489233. 16. 724394. 422129.
(46) The most extensive agricultural landuse on the Atherton Tablelands is beef cattle grazing (45% of the agricultural land), followed by the grazing of dairy cattle (18%) (Valentine 1988). The higher economic return from the dairy industry supports intensive grazing practices and considerably higher use of fertiliser.. In both. instances, fertiliser is broadcast directly on to the fields before the onset of the wet season. Fertilisers are applied at the rate of 44 kg P ha1 and 62 kg K ha-1 for intensive dairy production.. The most extensively grown crops on the Atherton Tablelands are maize and peanuts. Most farmers growing maize also grow peanuts (Valentine 1988). Both crops are rain grown and soil preparation and planting are closely associated with rainfall (Crosthwaite 1983; Valentine 1988). Fields are prepared by ploughing after harvest (September-November). Maize is planted following the first storm rains and fertiliser applied to the soil at the time of planting (November to January). Peanuts are planted on the first storm rains and grown through the wet season (Department of Primary Industries Note, Anon.). According to Loader (1987), 70% of growers on the Atherton Tablelands fertilise their peanut crops. Nearly all (94%) use phosphorus. The relative profitability of peanuts enables the crop to support extremely high levels of phosphatic fertiliser (Valentine 1988).. Fertiliser is always broadcast and. incorporated into the soil profile before planting. 66% of growers use other nutrients as well. Valentine's data suggest phosphatic fertiliser applied to peanuts (3.7 kg ha') is considerably less than that applied to maize (13.6 kg-i ha) (Table 2.2). Loader's (1987) data suggest this figure should be 370 kg ha' phosphate. In many cases 'elemental P' is referenced in preference to 'phosphate' and/or fertiliser weight, however, highlighting the difficulties in assessing varying data sources.. Potatoes are the fastest expanding crop on the Atherton Tablelands (L.Loader, Department of Primary Industries, pers.com.), increasing from 696 hat in 1987 to 952 ha-1 in 1988. Potato growing on the Atherton Tablelands uses the greatest quantities of chemicals with extremely high applications of nitrogen, potassium and phosphate (Valentine 1988; Table 2.2). Approximately 180 tonne P and 240 tonne N were used on potato crops during 1988/89 (Department of Primary Industries note, Anon.). Fertiliser is applied to the soil at the time of planting (Bartholomew, 1981). Summer and winter crops may be planted. Although potatoes only used 1% of agricultural land in 1987 (Valentine 1988), the increasing popularity of this crop, the ability to 17.
(47) sustain more than one crop per year, and the need for extremely high inputs of fertilisers, indicates the potential importance of potato farming to the nutrient budget of the Atherton Tablelands.. Orchards use only moderate levels of nitrogen, potassium and phosphate (Table 2.2). However, the recent expansion of tropical fruits (Valentine 1988) suggests higher inputs of fertilisers will be required in the future. Fertilisers are generally applied during the wet season (January-February) but application is not restricted to this period (Valentine 1988).. Sugar cane is the only major crop grown along the coast. Planting begins around May and continues through until September. Phosphatic fertiliser is added to the soil at the time of planting for slow release by subsequent rains. Land management practices also require cane fields _to remain fallow for alternating periods. During this period fields are top dressed with nitrogen based fertilisers. Top dressing takes place around November to take advantage of summer monsoons.. Soils in the Mossman-Cairns area are low in magnesium, calcium and potassium, contain a reasonable amount of sulphur and phosphorus and are extremely high in nitrogen (Bureau of Sugar Experiment Stations 1981). Top soils in all regions register high levels of P, suggested by Chapman et al (1981) to be due to previous applications of fertiliser. Phosphorus equal to 50% of the applied phosphorus fertiliser is present in the crop. The remainder of the applied phosphorus accumulates in the top soil and is registered in the levels of phosphorus detected by soil analysis (Chapman et al 1981).. Soil pH values at approximately 5.2 are considered below optimum in the Mossman to Cairns area (Chapman et al 1981). The satisfactory maintenance of soil calcium, magnesium and potassium, is difficult in regions subjected to leaching from high rainfall conditions (Chapman et al 1981). Application rates of calcium and magnesium fertiliser are estimated to be less than those removed by the crop, and soil nutrient reserves of these elements are gradually being depleted (Chapman et al 1981).. 18.
(48) 2.3.. THE MARINE ENVIRONMENT OF THE STUDY AREA. 2.3.1.. GEOGRAPHICAL CHARACTERISTICS. In the northern sector of the study area (Figures 1, 2 & 3), the Great Barrier Reef is characterised by a series of ribbon reefs on the outer edge of the narrow, relatively shallow continental shelf. To the east the shelf drops away from depths of less than 50 m to greater than 1000 m within a kilometre of the shelf edge (Hopley 1982). Behind the reef extensive banks of Halimeda have developed. In the southern sector, adjacent to the Cairns/Mossman area, a series of ribbon-like reefs occur along the edge of the narrow continental shelf. In this area the shelf drop-off is more gradual than in the northern sector, but depths of 1000 m within 10 km of the shelf crest have been noted (Hopley 1982). Extensive Halimeda banks have also formed behind the outer reefs in this location (Wolanski et al 1988).. Most reefs in the area lie between 20 and 60 km from the coastline. Major reef development begins around 25 km from the mainland, coinciding with the 36 m isobath. A series of small, relatively close and evenly spaced reefs occupy the outer portion of the continental shelf (Hopley 1982). The inner shelf is comparatively featureless, except for occasional high continental islands close to the coastline, and the low wooded island of Low Isles approximately halfway between the coastline and the 36 m isobath.. Reefs selected for study are adjacent to the Cairns hinterland drained by the Barron River catchment and the short runoff streams between Cairns and Mossman (Figures 2 & 3). Brook Islands Reef, to the south of the major area of study, was included to represent a secondary area with contrasting geological, climatic and agricultural background. No-Name Reef, on the outer shelf of the Great Barrier Reef, 60 km east of the mainland and 300 km north of the mouth of the Barron River (Figures 2 & 3), is adjacent to a mainland area supporting only sparse beef cattle production and considered sufficiently removed from anthropogenic influence to provide an adequate control site.. 2.3.2 MORPHOLOGICAL CHARACTERISTICS OF REEFS IN THE STUDY AREA Reef morphology follows a pattern of maturation associated with depth of the preHolocene reef from which modern reef growth has taken place (Hopley 1982; 1989). 19.
(49) Fringing reefs display the shallowest foundations with a progression towards deeper foundations from planar, through lagoonal, crescentic to ribbon reefs (Hopley 1989).. The study area is dominated by planar and crescentic reefs (Hopley 1989) indicative of the relatively shallow underlying pre-Holocene platform. For example, drilling has encountered Pleistocene reef at depths less than 20 m in the study area (see Davies et al 1989). Therefore, most of the reefs in the study area have formed extensive reef flats exposed during periods of low tide.. 2.3.3. HYDRODYNAMICS. Tides Semidiurnal tidal exchange produces a significant degree of flushing and mixing of shelf waters (Davis 1978; Hopley 1982).. Tidal range in the study area is. approximately 2.5 m, induced partly by minor amplification on the shallow continental shelf, with a strong solar influence reflected in relatively high neap to spring tidal variations (Hopley 1982). Currents induced by tidal variations can be significant in shallow areas. Extremely low spring-tides occur during the night in summer (January, February) and during daytime in winter (June, July). Wide expanses of reef flat and living coral are exposed during these tides (Hopley 1982).. Currents Influence from the dominant southeasterly wind regime, operating along the east coast of Queensland, forces a northwards moving current along the North Queensland coast (Wolanski and Jones 1981; Wolanski and van Senden 1983). Discharge from rivers is subsequently pushed northwards during normal conditions. Thus, reefs in the study area will also be affected by fluvial discharge from southern rivers, driven into the area by dominant northwards moving coastal currents.. 2.3.4. WATER MASS STRUCTURE. Temperature Although latitudinal variation in temperature correlates with air temperature (Walker 1981; Andrews 1983), the greatest seasonal variations occur in a cross shelf transect (Hopley 1989). For example, in the Townsville region of the Great Barrier Reef, 20.
Figure
+7
Related documents
Vice President Lenz said this discussion would update the Committee on the UC San Diego Health System’s Strategic Plan as background for a proposed action in the subsequent item
The theory of exchange, related to Menger’s view of economic goods and the theory of value based on his subjectivism, appears to form the two pillars of his market emergence
(1) productivity: what array of housing units and other real estate developments, financing dollars, housing management services, and services for project residents and other
• exclusive leader board ad on registration web site from date of contract through the summit • logo in pre-conference promotional material • Post-event registration lists
Section l.90(d) of the final rules requires each financial institution or creditor that offers or maintains one or more covered accounts to develop and implement a written
In Dolley and ‘the great little Madison,' Conover Hunt-Jones provides an exhaustive study of the material cultural assemblages employed by the Madisons not just at Montpelier,
They are (1) as the purpose of this study was to identify the reaction of African American students to a culturally relevant (Ladson-Billings, 1992, 1995a, 1995b, 2009) visual tool
Six situations were considered in each set of tests: a non-strengthened column; a monolithic model; a column strengthened without any interface surface preparation; a
