PREVALENCE OF HYPERLIPIDEMIA AMONG HEALTHY
FEMALES AND THEIR RELATIONSHIP WITH WAIST
CIRCUMFERENCE AND BODY MASS INDEX
THE TAMILNADU Dr.M.G.R. MEDICAL UNIVERSITY
with partial fulfillment of the regulations for the award of the degree of M.D. GENERAL MEDICINE
COIMBATORE MEDICAL COLLEGE A Dissertation on
PREVALENCE OF HYPERLIPIDEMIA AMONG HEALTHY
FEMALES AND THEIR RELATIONSHIP WITH WAIST
CIRCUMFERENCE AND BODY MASS INDEX
Dissertation Submitted to
ADU Dr.M.G.R. MEDICAL UNIVERSITY CHENNAI - 600 032
partial fulfillment of the regulations for the award of the degree of M.D. GENERAL MEDICINE
BRANCH-I
COIMBATORE MEDICAL COLLEGE COIMBATORE
APRIL 2016
PREVALENCE OF HYPERLIPIDEMIA AMONG HEALTHY
FEMALES AND THEIR RELATIONSHIP WITH WAIST
CIRCUMFERENCE AND BODY MASS INDEX
CERTIFICATE
This is to certify that the dissertation entitled “PREVALENCE OF HYPERLIPIDEMIA AMONG HEALTHY FEMALES AND THEIR
RELATIONSHIP WITH WAIST CIRCUMFERENCE AND BODY MASS
INDEX.” is a bonafide research work done by Dr. NIRMALA. P, Post Graduate student in General Medicine, under my direct guidance and supervision. This is being submitted to the The Tamil Nadu Dr. M.G.R. Medical University, Chennai, in partial fulfillment of the regulations for the award of M.D. Degree in General Medicine examination to be held in April 2016. I have great pleasure in forwarding the same to The Tamil Nadu Dr. M.G.R. Medical University, Chennai, Tamilnadu, India.
Prof. Dr.USHA.S, M.D., Prof.Dr.KUMAR NATARAJAN, M.D.,
Prof. and Guide Prof. and H.O.D Department of Medicine, Department of Medicine
Coimbatore Medical College Coimbatore Medical College
THE DEAN
THE TAMILNADU DR.M.G.R MEDICAL UNIVERSITY
CHENNAI
DECLARATION BY THE CANDIDATE
I, Dr. NIRMALA.P hereby declare that this dissertation entitled “PREVALENCE OF HYPERLIPIDEMIA AMONG HEALTHY FEMALES
AND THEIR RELATIONSHIP WITH WAIST CIRCUMFERENCE AND
BODY MASS INDEX”. is a bonafide and genuine research work carried out by me under the guidance of Dr.USHA.S, M.D. Professor, Department of Medicine, Coimbatore Medical College, Coimbatore, in partial fulfillment of the regulations for the award of M.D. Degree in General Medicine to be held in Apr 2016.
This dissertation has not been submitted by me on any previous occasion to any university for the award of any degree.
Date:---
Place:Coimbatore Dr.Nirmala.P Post Graduate student Department of Medicine Coimbatore Medical College
ACKNOWLEDGEMENT
I sincerely thank Dr. A. EDWIN JOE M.D., B.L., Dean of Coimbatore Medical College for allowing me to utilize the hospital facilities for doing this work.
I take this opportunity to express my sincere gratitude and indebtedness to Prof. Dr. USHA.S. M.D., Professor of Medicine, Department of Medicine, my unit chief for her able guidance, without whose help this study would not been possible.
I sincerely thank Prof. Dr. KUMAR NATARAJAN, M.D., Head of the Department of Medicine for his suggestions throughout this study. I sincerely thank Prof. Dr. RAVEENDRAN.M. M.D., for his guidance and support. I sincerely thank Dr. T. GEETHA M.D., Dr. K. SIVAKUMAR M.D., Dr. P.S. RANI M.D., Dr. A.AKILA M.D., Assistant Professors of my unit for their thoughtful guidance.
I would like to express my gratitude to Prof. Dr. MANIMEGALAI.N M.D., Department of Biochemistry for her help and guidance.
I thank my post graduate colleagues for their help and suggestions and acknowledge the co-operation of all the Staff and Technicians.
TABLE OF CONTENTS
S.NO CONTENT PAGE NO
1 INTRODUCTION 1
2 AIMS AND OBJECTIVES 4
3 REVIEW OF LITERATURE 6
4 METHODOLOGY 52
5 RESULTS 55
6 DISCUSSION 74
7 SUMMARY 79
8 CONCLUSION 82
9 BIBLIOGRAPHY
10 ANNEXURES
A)CONSENT FORM B)PROFORMA C)MASTER CHART
LIST OF TABLES
S.NO CONTENT PAGE
NO
1. Digestion of lipids in the body 9
2. Functions of Adipokines 13
3. Characteristics of the major classes of lipoproteins 16
4. Functions of lipoproteins 17
5. Fredrickson classification of hyperlipoproteinemias 30
6. Statin therapy 38
7. – 16. Related studies 41-49
17. Demographic and clinical characteristics of the
study population
55
18. Biochemical characteristics of the study population 56
19. Distribution of lipid profile among aymptomatic
females
57
20. Distribution of BMI among asymptomatic females 58
21. Distribution of WC among asymptomatic females 59
22. Pattern of Dyslipidemia in asymptomatic females 60
23. Distribution of BMI and Dyslipidemia 61
24. Distribution of WC and Dyslipidemia 62
S.NO CONTENT PAGE NO 26. Incidence of Diabetes and Impaired fasting glucose
in asymptomatic females
64
27. Age specific distribution of Coronary risk factors
among study population
66
28. Coronary risk factors and Habits 68
29. Pearson correlation coefficient analysis of variables
Obesity and Dyslipidemia
70
30. Pearson correlation coefficient analysis of variables
Obesity and lipid profile
71
31. Pearson correlation coefficient analysis of lipid
subfractions to variables of obesity in various age
groups
LIST OF FIGURES
S.NO CONTENT PAGE NO
1. Role of adipose tissue in Dyslipidemia 12
2. Structure of Lipoproteins 16
3. Sources of cholesterol 18
4. Cholesterol synthesis pathway 20
5. Fate of triglycerides 21
6. Functions of HDL 23
7. Role of Diabetes Mellitus in Atherosclerosis 33
8. Role of insulin in atherosclerosis 34
9. Role of hypertension in atherosclerosis 35
10. Various types of bariatric surgeries 40
11. Distribution of lipid profile 57
12. Distribution of BMI 58
13. Distribution of WC 59
14. Pattern of Dyslipidemia 60
ABBREVIATIONS WHO - World Health Organisation
CVD - Cardio Vascular Disease
NCMH - National Commission on Macro Economics and Health
NHANES - National Health And Nutrition Survey
BMI - Body Mass Index
WC - Waist Circumference
WHR - Waist Hip Ratio
PPAR - Peroxisome Proliferator – Activated Receptor
FA - Fatty Acid
CETP - Cholesterol Ester Transfer Protein
PAI -1 - Plasminogen Activator Inhibitor -1
HMG
CoA Reductase - 3 Hydroxy – 3 Methyl – Glutaryl – CoA Reductase IL – 6 - Interleukin – 6
TNF – ∞ - Tumour Necrosis Factor Alpha
LP - Lipoprotein
LPL - Lipoprotein Lipase
LCAT - Lecithin Cholesterol Acyl Transferase
TGL - Triglyceride
TC - Total Cholesterol
VLDL - Very Low Density Lipoprotein
LDL - Low Density Lipoprotein
IDL - Intermediate Density Lipoprotein
HDL - High Density Lipoprotein
FBS - Fasting Blood Sugar
FH - Familial Hypercholesterolemia
INTRODUCTION
Heart disease is the most important cause of death and sickness in developing countries like India.1 In women, those under the age of 50, Cardiac disease is unusual in the absence of disease such as diabetes or hypertension. The first step in assessing disease of coronary vessels in females is by introducing awareness of its existence-both among doctors and female themselves.2 Diseased Coronary arteries usually present atypically in females.3Unusual anginal presentation is more common than MI. NCMH (National Commission on Macroeconomics and Health ) of India, according to this Commission, there would be around 62 million patients with arterial disease of the heart occur within 2015 in India and of 23 million people of them would be younger than age of 40 years.4
Coronary vascular disease is mainly due to atherosclerotic process affecting various sized arteries of the heart and abnormally high fat in blood has been found to be one of the most important factor contributing to vascular narrowing and hypoperfusion.5 WHO defines overweight and obesity as conditions in which the body accumulates fat to the extent that health and well-being are affected very much.6 With obesity and weight above normal, the prevalence of high BP, high lipid level, and high blood sugar increases substantially and are considered to be three factors on the pathway to CV disease and mortality.7,8
factor when added with Body Mass Index (BMI).9 The relationship among them is mediated by a modification /resistance produced by insulin on the metabolism lipids.10Individuals who presented “centrally obese” (e.g., with a high Waist circumference and WH Ratio ) will have high serum lipid levels 11 These observations has been noticed in a variety of populations all over the world specific in developed12 and less developed countries.13
Apart from its interest for establishing a physiopathological causal link, this predictive association suggests the possibility of measuring one or more anthropometric indices of central adiposity as a first step in population screening for high lipid level in blood.14
In our cross-sectional study we studied the pattern of hyperlipidemia and its correlation with Waist Circumference and Body Mass Index(BMI) among healthy, asymptomatic female patients attending out patient department in CMCH, Coimbatore.
AIM OF THE STUDY
The study aims to identify the prevalence of dyslipidemia in
asymptomatic female patients attending master health checkup in
Coimbatore Medical College hospital.
OBJECTIVES
• To assess the prevalence of hyperlipidemia among healthy females
• To analyze the significance between hyperlipidemia and anthropometric indices including WC,WHR and BMI.
• To correlate lipid subfractions with anthropometric measures.
REVIEW OF LITERATURE
Heart Disease (CVD) is now the most common cause of death worldwide now. In 2010, Heart disease mainly coronary disease caused 16 million deaths worldwide (30%).This includes nearly 40% of deaths in developed countries and 28% in developing countries like India16 . The overall variation in cardiac disease rates is related to ethinic, genetic, environmental and regional variations in risk behaviours. Worldwide, high lipid levels are estimated to play a role in 56% of ischemic disease of heart and 18% of, cerebrovascular accidents, accounting to 4.4 million deaths per annum. In 2008, age standardized mean total cholesterol was 179.4 mg/dl in men and 184.2 mg/dl in women17.
Obesity is increasing throughout the world, particularly in developing countries .Three risk factors for CAD are hypertension, dyslipidemia, and cigarette smoking18. All these can be preventable and able to treat. In recent times, more importance has been focused on treatment of cholesterol mainly through behavioural modifications ,traditional diet and by drugs. The various drugs,i.e statins, fibrates and glitazars (PPAR modulators). Each of them, attacking metabolism of lipids at various state through its own mechanism. The HMG-CoA reductase is the enzyme which is the rate limiting step in lipid synthetic pathway. The inhibitors in this pathway (Hydroxy, Methyl Glutaryl co-A) are often called to as “statins“,continue to be the main treatment in hyperlipidemia.
Lipids are consumed in the form of neutral fats which are also known as triglycerides. Triglycerides are made up of glycerol nucleus and free fatty acids. Triglycerides form the major constituent in foods in animal origin and much less in foods of plant origin. Apart from triglycerides, usual diet also contains small quantities of cholesterol and cholesterol esters.
Dietary fats are classified into two types: 1. Saturated fatty acids 2. Unsaturated fatty acids.
Saturated fats contain triglycerides which has maximum amount of hydrogen ions without any double bonds between carbon atom. It is rich in full fat milk, meat, cheese, baked biscuit, coconut oil, palm oil and deep fried fast foods.
Unsaturated FA formed by dehydrogenation of saturated FA. It can be classified into 3 types:
1. Monounsaturated fats 2. Polyunsaturated fats 3. Trans fats.
Polyunsaturated fats which contains more than one double bond between the carbon atoms. It is rich in fruits, vegetables, walnuts, fish, sea foods and egg.
DIGESTION OF LIPIDS
Area Juice Enzyme Substrate End product
Mouth Saliva Lingual lipase Triglycerides
Fatty acid 1, 2-diacylglycerol
Stomach Gastric juice
Gastric lipase(weak
lipase)
Triglycerides Fatty acids Glycerol
Small intestine
Pancreatic juice
Pancreatic lipase Triglycerides Monoglycerides Fatty acids Cholesterol ester hydrolase Cholesterol ester Free cholesterol Fatty acids
Phospholipase A Phospholipids Lysophospholipids
Phospholipase B Lyso Phospholipids
Phosphoryl choline Free fatty acids
Colipase Facilitates action of Pancreatic lipase --- Bile-salt activated lipase
Phospholipids Lysophospholipids Cholesterol
esters
Cholesterol and fatty acids
Succus
entericus Intestinal lipase Triglycerides
Fatty acids glycerol (weak
action)
Trans fats which contain trans double bond between carbon atoms and it is rich in milk, cheese, lamb and beef.
Bile salts also involved in the digestion of lipids. The final end products are FA, cholesterol and monoglycerides. They are absorbed from the micelles enters the intestinal mucosal cells by simple diffusion and re-esterified to triglycerides and cholesterol esters. They form chylomicrons which cannot pass through membranes of the capillaries because of its larger size they enter the lymphatic lymph vesssels. The lipids are stored in the adipose tissues in the form of triglycerides. Obesity does not depend on the body weight but on the amount of body fat.
ADIPOSE TISSUE
Adipose tissue or fat is a loose connective tissue that forms the storage site of fat in the form of triacylglycerol.Adipose tissue is of two types, white and brown adipose tissue.
WHITE ADIPOSE TISSUE
BROWN ADIPOSE TISSUE
PATHOPHYSIOLOGY
FIG 1: ROLE OF ADIPOSE TISSUE IN DYSLIPIDEMIA
True adipokines such as leptons and by adipose tissue.
Visceral adipose tissue CETP, PAI
6. Obesity can be due to chronic low grade inflammation characterized by elevated plasma levels of inflammatory markers. Exce
persons. This state of inflammation ma
with obesity such as dyslipidemia, insulin resistance and atherosclerosis. Increased state of inflammation
PAI-1,Leptin,IL-6,TNF
Endothelial dysfunction insulin resistance
PATHOPHYSIOLOGY OF ADIPOSE TISSUE
ROLE OF ADIPOSE TISSUE IN DYSLIPIDEMIA
es such as leptons and adiponectin, are produced exclusively
Visceral adipose tissue CETP, PAI-1,angiotensinogen, adiponec
6. Obesity can be due to chronic low grade inflammation characterized by elevated matory markers. Except adiponectin which is low in obese persons. This state of inflammation may contributes to health problems associated with obesity such as dyslipidemia, insulin resistance and atherosclerosis.
Excess adipose tissue
Increased state of inflammation
6,TNF-alpha,Angiotensinogen insulin resistance ATHEROSCLEROSIS Increased CETP(cholesterolester transfer protein) Dyslipidemia ADIPOSE TISSUE
ROLE OF ADIPOSE TISSUE IN DYSLIPIDEMIA
tin, are produced exclusively
1,angiotensinogen, adiponectin and IL-6. Obesity can be due to chronic low grade inflammation characterized by elevated
tin which is low in obese y contributes to health problems associated with obesity such as dyslipidemia, insulin resistance and atherosclerosis.
Increased CETP(cholesterolester
transfer protein)
TABLE 2: FUNCTIONS OF ADIPOKINES
Adipokines Functions
Adiponectin
Anti-inflammatory, Insulin sensitizer
Leptin Regulate appetite and energy expenditure
Platelet activator inhibitor-1
Contributes to the prothrombotic state, proinflammatory
TNF-alpha
Impairs the insulin signaling cascade, Inducing insulin resistance
Contributes to proinflammatory state
IL-6
Stimulates CRP release from the liver Causes insulin resistance
PATHOPHYSIOLOGY OF LIPID METABOLISM Cholesterol Homeostasis
Cholesterol is an essential cell membrane component and it is derived from steroid hormones and bile acids. Sources of cholesterol are produced by the body itself and from ingested foods, which is necessary to carry out normal functioning of life.Blood cholesterol levels approximately 40-60% from endogenous source, remaining from dietary sources.
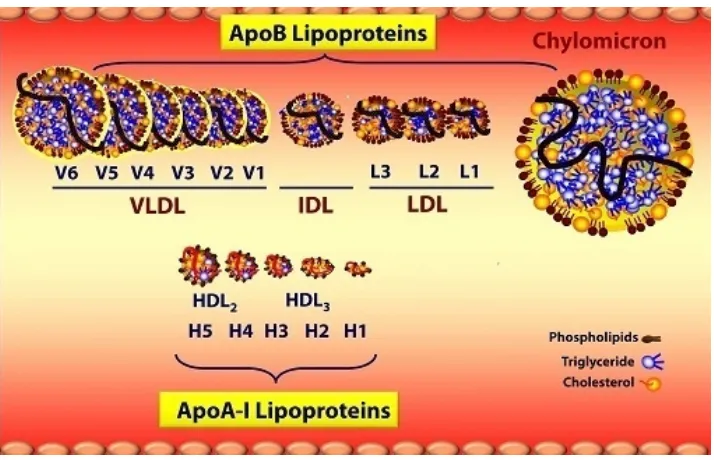
Triglycerides are synthesized in the body mainly from diet rich in carbohydrates . In the liver ,the fatty acids can be esterified with glycerol and stored19. Lipids, triglycerides and cholesterol are transported in the blood by combining with lipoproteins which are spherical in its nature.These Lipoproteins (LP) depending on their composition it was categorized into five major classes20.
FIG 2: STRUCTURE OF LIPOPROTEINS
Category Composition Origin
Chylomicrons Exogenous triglycerides Gut Very low density
lipoproteins Triglycerides
Liver
Intermediate density lipoproteins
Cholesterol esters and
triglycerides VLDL/HDL
Low density lipoproteins Cholesterol VLDL catabolism
High density lipoproteins Cholesterol Liver, gut
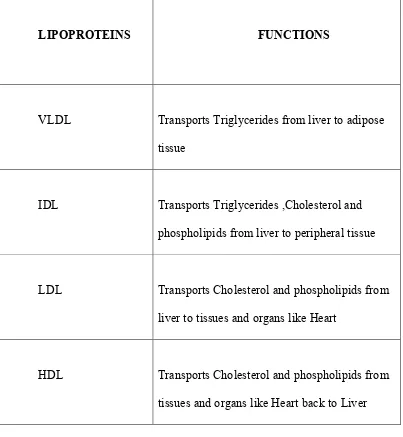
[image:28.612.104.525.334.590.2]Functions of lipoproteins;
Lipoproteins are involved in transport of free fatty acids in blood in combination with albumin.
LIPOPROTEINS FUNCTIONS
VLDL Transports Triglycerides from liver to adipose tissue
IDL Transports Triglycerides ,Cholesterol and phospholipids from liver to peripheral tissue
LDL Transports Cholesterol and phospholipids from liver to tissues and organs like Heart
[image:29.612.106.509.167.604.2]HDL Transports Cholesterol and phospholipids from tissues and organs like Heart back to Liver
FIG 3: SOURCES OF CHOLESTEROL
In the first pathway, dietary fat is digested ,then absorbed in proximal part of small intestine.After absorbtion ,they are transformed to chylomicrons which are made up of fatty acids, cholesterol, and apolipoproteins.
In the endogenous pathway, lipoprotein are mainly involved in the synthesis, transport in blood and catabolism of chylomicron particles and remnants23. They are all reformulated in the intestinal endothelium where they are all packed into These chylomicrons then enter and transported via the lymphatic system.In the capillary beds,it can be metabolized by the enzyme called lipoprotein lipase (LPL).
These chylomicrons acted upon by lipoprotein lipase break into chylomicron remnants which contain less fatty acids and apolipoprotein B-48 Apo-E .These remnant proteins are cleared from blood via LDL receptor protein in the liver.25
In the second pathway, cells can synthesis their own cholesterol from acetyl- CoA through series of biochemical reaction.
FIG 4: CHOLESTEROL SYNTHESIS PATHWAY
Acetyl-coA is converted into CoA by an enzyme called HMG-CoA synthetase.It can converted to mevalonate,then farnesyl pp ,squalene, lanosterol and finally become cholesterol through serial enzymatic reactions.The enzymes involved are HMG CoA synthase and HMG CoA reductase .
The inhibitors of HMG-CoA reductase reduce the production of cholesterol in the cell,by competitively inhibiting this enzyme23.
VLDL, LDL, HDL. are the three major lipoprotein involved in endogenous pathway.
o apolipoprotein B-100, o apoproteins E,
o apoproteins C-11 along with triglycerides and
cholesterol. These VLDL contains five times more TGL than cholesterol.
Apoprotein B and E - link with B-E or LDL cell surface receptors. Apolipoprotein C-II - cofactor for the enzyme lipoprotein lipase (LPL).
The FFA are used for energy production primarily by cardiac and skeletal muscle and stored in fat cells.
FIG 5:FATE OF TRIGLYCERIDES
Triglyceride molecules hydrolysed by the enzyme LPL.This process of lipolysis decreases the content and the size of VLDL.It enters either of the two pathways
1.Hepatic Clearence
2.Transformation to IDL.
IDL contains almost all the cholesterol present in the VLDL.TGL content is high in IDL particles. LPL and Hepatic lipase, convert them into LDL (rich in cholesterol). Only apolipoproteins E and C removed.This IDL particles have shorter life span as they are intermediate products of VLDL and LDL. Cholesterol measurements are not significantly impacted by cholesterol and triglyceride contents. In IDL particles, cholesterol circulates less than 5%, except for rare dyslipidemias. IDL particles are cleared from circulation and are converted to LDL receptor and LDL.
LDL penetrates into subendothelial tissue contributing to the development of atherosclerosis. LDL particle penetrates more into subendothelial tissue, when its smaller. Cholesterol gets deposited outside the cell, when there is excessive circulation of LDL cholesterol. This deposition of LDL cholesterol causes plaque formation in the endothelium and narrowing of Coronary Arteries. According to recent developments, CHD risk is highly found in two specific types of LDL particles-1.lipoprotein(a) protein.
2.atherogenic lipoprotein phenotype B, which is quite dense. This subclass has high risk of CHD and is found in approximately 30% of the population.
involved in transport of cholesterol from intestine to liver and has antiatherogenic potential. Cholesterol that are deposited within arterial wall might be removed or
prevented by HDL. Other benefits of HDL are: FIG 6: FUNCTIONS OF HDL
Works as anti-oxidant and prevents LDL oxidation.
Reduces aggregation and activation of platelets by producing more prostacyclin. Facilitates fibrinolysis by stabilizing prostacyclin levels in serum. Competitively inhibits the LDL uptake by endothelium..
Aggregation and uptake of LDL by macrophages are prevented. Production of cholesterol and foam cell is reduced.
Transportation of cholesterol to the liver from the periphery involves two key enzymes and they are eliminated by HDL particles.
IDL and VLDL are eliminated through liver.
The three lipoproteins play a role in peripheral utilization of TGL and cholesterol from the liver and vice versa for elimination.
Insufficient requirement of cholesterol by the cell will increase the production of LDL receptor and this will moves to the area on the cell surface called coated pits, where the cells identify lipoproteins which contain apo E or B present in VLDL, IDL and LDL .The binding affinity for LDL receptors are more for VLDL and IDL. Because it contains both Apo B and E. when binding occurs on the surface, internalization of the lipoprotein by cell occurs, action of liposomes takes place where it is broken down and used by the cell. The LDL receptor protein again returns comes back to the surface of the cell and the process continuously repeated.
Cholesterol in HDL
through LCAT
cholesterol esters
RELATIONSHIP BETWEEN CHOLESTEROL AND CHD
The relationship between lipids and lipoproteins with coronary disease is still in controversy and research .The initiating factors of plaque formation are 1. The entry of LDL and Lp(a) into the sub-endothelial space 2. oxidatively modified free radicals produced by smooth muscle cells,
3.activated macrophages 4. Vascular endothelial cells.
These lipoproteins are oxidatively modified. It is taken up by the macrophages via scavenger receptor pathway. this process yields foam cells which are rich in lipids.
The next step is the fatty streak formation.It is formed of oxidatively modified lipoproteins and the foam cells. The muscle cells moves to subendothelial space and its proliferation occurs within the intima, ultimately leading to atherogenesis.lesions continue to grow by increased smooth muscle and collagen synthesis.At one point, foam cell undergo necrosis and extracellular lipid core forms, it triggers an autoimmune response, causing T lymphocyte infiltration into advential layer of blood vessel.this completes the process of atherogenesis,the main factor involved in CHD.
CAUSE OF ALTERED LIPID METABOLISM By excessive secretion of VLDL
Secondary causes-liver disorders, drugs, hypothyroidism nephritic syndrome, autoimmune diseases, malnutrition, anorexia nervosa,diabetes mellitus type-2, obesity, menopause, stress, pregnancy, renal failure, acromegaly, cushing’s syndrome, glycogen storage disease, acute intermittent porphyria.
SUBCLINICAL HYPOTHYROIDISM AND DYSLIPIDEMIA
Various randomized studies observe rise in total cholesterol, LDL and serum triglyceride in subclinical hypothyroid patients. This association is more strongly found in females, with increasing age and those with baseline TSH >12 mlU/ L. It also associated with increased intima and media thickness, endothelial dysfunction, systolic and diastolic dysfunction leads to cardiovascular risk. Coronary heart diseases are more with TSH >10mlU/ L24.
The American Thyroid Association has set guidelines for evaluation of patients with symptoms and with known thyroid problems.
Screening is suggested for 1. Women from the age of 35,
2. at 5-year intervals, for individuals with a strong family history of thyroid disease,
3. Elderly
4. Women at 4-8 weeks postpartum 5. Patients with autoimmune illnesses.
The American College of Physicians guidelines for screening thyroid disease recommends TSH levels monitoring only in women over 50 years. Because in younger population, the prevalence of asymptomatic thyroid is low. It recommended treatment only in symptomatic and hyperlipidemic patients, with 2 to 5 yearly follow up.
CARDIOVASCULAR DISEASES AND STROKE IN WOMEN
Estrogens and androgens have major effects on the cardiovascular system and metabolism of lipids.
Estrogens-increases high-density lipoprotein lowers low-density lipoprotein (direct vasodilator effects on the vascular endothelium,
enhances insulin sensitivity antioxidant and anti-inflammatory)26
common presentation of MI in women is cardiac arrest or cardiogenic shock. In men, it mostly presents as ventricular tachycardias.
Younger women has higher mortality rates than with men of similar age. This mortality gap has greatly fallen because of the advent of percutaneous transluminant coronary angioplasty. There are lower rate of restenosis and a better long term outcome.
RISK FACTORS FOR CHD IN MEN AND WOMEN: Elevated cholesterol levels,
Low HDL cholesterol, Obesity,
Smoking,
Lack of physical activity,
Hypertension and diabetes mellitus
IMPORTANT RISK FACTORS IN WOMEN:
Total triglyceride levels are an independent risk factor. Low HDL cholesterol
Diabetes mellitus
According to National Health and Nutrition Survey(NHANES), prevalence rates both coronary heart disease and stroke have increased in the 1994-2004 compared to the 1988-1994 NHANES, whereas prevalence rates have decreased or remained unchanged in men. These increases were paralleled by an increasing prevalence of abdominal obesity and other components of metabolic syndrome.
CLASSIFICATION OF DYLIPIDEMIA
Dyslipidemia may be caused by primary genetic predisposition or by secondary causes and most of the times the combination of both. There are three major forms of dyslipidemia-
Hypercholesterolemia, Hypertriglyceridemia and Mixed (combination of both)
Familial Hypercholesterolemia (FH):
FH is characterized by- elevated LDL-C with normal TGL leading to premature coronary atherosclerosis ,tendon xanthomas. The elevated levels of LDL-Chloesterol in FH is due to increased synthesis and decreased catabolism of LDL. There were two mutated LDL receptor alleles Homozygote and Heterozygote. In this FH Heterozygote are less affected than FH Homozygote. According to LDL-receptor activity they can be classified into receptor negative (<2% of normal LDL receptor activity), receptor defective (2-25% of LDL receptor activity).
In Homozygote FH, total cholesterol levels are usually >500 mg/dl and even >1000 mg/dl. FH causes atherosclerosis in early life, leading to vascular diseases and death in childhood. Atherosclerosis initially develops in one of the aortic root leading to valvular stenosis and it can extends into ostia of the coronary vessels, which leads to stenosis.
In Heterozygous FH, hypercholesterolemia presents since birth, but it cannot be detected until adulthood. It produces corneal arcus, tendon xanthoma and CAD. The tendon xanthomas present over the elbows, knees, dorsum of the hands and over the Achilles tendons in~75% of patients.
atherosclerotic heart disease is late in women with FH, coronary heart disease(CHD) is significantly more commen in women with FH in the Female population. No specific diagnostic is not available to detect heterozygous FH.
Hypertriglyceridemia produced by elevated levels of VLDL or chylomicron particles. It can be 1.Primary hypertriglyceridemia by the excessive production from diet
2. Secondary hypertriglyceridemia, following obesity , diabetes and other chronic medical diseases.
Hypertriglyceridemia is not an isolated one it can associated with low HDL and elevated LDL can lead to accelerated atheroscelerotic deposition in the vascular endothelium.
Mixed hyperlipidemias - most common forms of dyslipidemia presented with both triglyceride and cholesterol in high levels.
Mixed hyperlipidemia
deficiency.It has reduced delipidization of VLDL and chylomicrons and causes elevated triglyceride which leads to increased risk of pancreatitis.
treatment should be to reduce triglyceride
DYSLIPEDEMIA IN DIABETES
[image:45.612.127.502.272.556.2]Diabetes produces the following changes in the vascular endothelium
FIG 7: ROLE OF DIABETES MELLITUS IN ATHEROSCLEROSIS
Diabetic dyslipidemia can be diagnosed by lipid profile after 10
fasting. It is characterized small dense LDL. ApoB level is more informative but its estimation is not readily available in most of the hospitals. Non HDL cholesterol estimation can be used in such situations.
Accelerated atheroscelerosis , accumulation of oxidised LDL Oxidative stress, LDL oxidation
Increased production of glycated end products and reactive oxygen species Genetic expression of various genes
Activation of nuclear factor (NF
ixed hyperlipidemia also has familial lipoprotein lipase(LPL) enzyme reduced delipidization of VLDL and chylomicrons and causes elevated triglyceride which leads to increased risk of pancreatitis.The aim of
reduce triglyceride level and prevention of pancreatitis.
DYSLIPEDEMIA IN DIABETES MELLITUS.
Diabetes produces the following changes in the vascular endothelium
FIG 7: ROLE OF DIABETES MELLITUS IN ATHEROSCLEROSIS
Diabetic dyslipidemia can be diagnosed by lipid profile after 10
fasting. It is characterized small dense LDL. ApoB level is more informative but its estimation is not readily available in most of the hospitals. Non HDL
n be used in such situations.
Accelerated atheroscelerosis , accumulation of oxidised LDL Oxidative stress, LDL oxidation
Increased production of glycated end products and reactive oxygen species Genetic expression of various genes
Activation of nuclear factor (NF-kB)
Hyperglycemia
also has familial lipoprotein lipase(LPL) enzyme reduced delipidization of VLDL and chylomicrons and causes The aim of pancreatitis.
Diabetes produces the following changes in the vascular endothelium
FIG 7: ROLE OF DIABETES MELLITUS IN ATHEROSCLEROSIS
Diabetic dyslipidemia can be diagnosed by lipid profile after 10-12hours of fasting. It is characterized small dense LDL. ApoB level is more informative but its estimation is not readily available in most of the hospitals. Non HDL
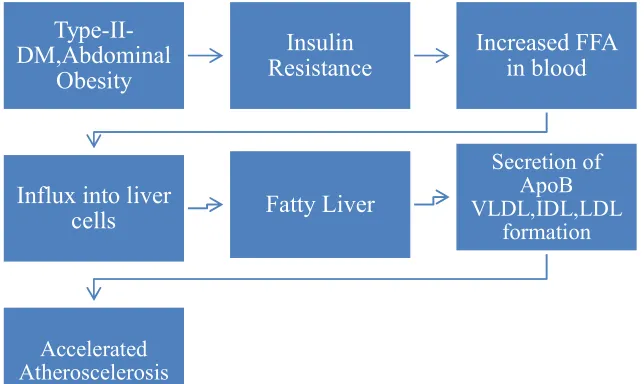
Action of Insulin on lipids
[image:46.612.163.485.204.396.2]Physiologically, insulin inhibits lipolysis. In insulin deficiency/resistance the following changes takes place leading to atherosclerotic disorders
FIG 8:ROLE OF INSULIN IN ATHEROSCLEROSIS
Type-II-DM,Abdominal
Obesity
Insulin Resistance
Increased FFA in blood
Influx into liver
cells Fatty Liver
Secretion of ApoB VLDL,IDL,LDL
formation
HYPERDLIPEDEMIA IN HYPERTENSION:
In hypertensive patients the following changes takes place which leads to deposition of cholesterol in blood vessels.
[image:47.612.155.428.154.538.2]
Fig : Role of Hypertension in Atherosclerosis
(microvascular), made difficulty in evaluation. Advantages of female sex can be eliminated by diabetes,obesity and distribution of fat in women can also risk factor for CAD. According to NCEP ATP III,guidelines are formed to identify and manage hyperlipidemia.
PREVENTION AND CONTROL OF OBESITY AND DYSLIPIDEMIA
According to WHO expert committee 1995 maintaining weight by prevention of weight gain of more than 5kg in all people. In those who are already overweight, 5-10% of body weight reduction is the initial goal. Prevention should begin in early childhood. It is difficult to treat obesity in adults than in children. This can be achieved by (a) life style management, (b) pharmacotherapy.
Life Style Management 1. Diet therapy:
• Diet rich in fruits, vegetables, fibers and whole grain. Two servings of fish rich in omega-3 fatty acids per week.
• Reducing sodium < 2300mg/day.
• 45-65% of calories from carbohydrates 20-35% of daily calories from fat and (saturated fats to <10% of the daily calories) and 10-35% from protein.
• Types of energy reduced diets: 1.Very low calorie diet - provides <800kcal/day, liquid meal fortified with minerals. It is recommended for morbidly obese and those who need rapid weight loss. 2. Low calorie diet – supplies 1200-1600kcal/day. It consists of traditional low calorie diet, prepackaged foods fortified with minerals. It provides nutritionally balanced low fat, low energy meal.5555
• Special nutrients – 1.Oat fibre, 2.Conjugated linoleic acids – decreasing lipid synthesis, increasing lipolysis 3. Whey protein – rich in essential, branched chain aminoacids.
1. Physical activity:
According to Physical activity 2008 guidelines, 150 minutes /week of moderate exercises or 75 minutes /week –vigorous ,aerobic exercises.
2. Behaviour therapy:
Stress management, avoid eating in front of television, introducing new diet/physical exercises.
3. Medical management:
Lorcaserin,Orlistat,Phenttermine,Rominabsnt,Sibutramine and Tesofensine(under trial),
2. High and moderate intensity statin therapy. High intensity statin
therapy
Moderate intensity statin therapy
Daily dose lowers LDL-C on average by approximately > 50%
Daily dose lowers LDL-C on average by approximately 30
-50%
Atorvastatin – 40-80mg Rosuvastatin – 20-40mg
[image:50.612.136.491.178.480.2]Atorvastatin – 10-20mg Rosuvastatin – 5-10mg Simvastatin – 20-40mg Pravastatin – 40-80mg Lovastatin – 40mg Pitavastatin – 2-4mg
TABLE 6: STATIN THERAPY
4. Alternative medicine:
Green tea contains catechine, (antiobesogenic), hydrocitric acid present in Indian fruit Garcinia cambogia61.
5. Surgical management:
Indications: BMI >40kg/m2 or BMI >35 kg/m2 with comorbidities such as Hypertensive, hyperlipidemia severe arthrosis and DM31.
BARIATRIC SURGERIES
FIG 10: VARIOUS BARIATRIC SURGERIES
Bariatric procedures
Restrictive procedures
Laproscopic adjustable gastric band
Laproscopic sleeve gastrectomy
Malabsorbtive procedures
Biliopancreatic diversion BPD with duodenal
switch Combined
procedures
STUDIES STUDY 1: TABLE 7
STUDIED BY Ghosh A et al32
TOPIC Corelation between WHR and
TC,FPG,FTGL STUDY
POPULATION
130 bengalee
WHR <0.95( CENTRALLY NON OBESE-CNO)
N=47
Higher TC(p<0.05) FPG (p < 0.01) and FTG (p < 0.05)
WHR>0.95(
CENTRALLY OBESE-CO) N=83
RESULT CO status had a significant effect (p < 0.05) on TC, VLDL-C, FPG and FTG.
STUDY 2: TABLE 8
STUDIED BY Asha Mahilmaran et al33
TOPIC Corelation between BMI,WHR,TC
with age STUDY
POPULATION
2318 people above 20 years at apollo hospital Chennai
Total cholesterol (TC) >200mg/dl was present in 36%, HDL,<40mg/dl (males), <50mg/dl (females) in 37%, LDL> 130mg/dl in 25%, triglyceride(TGL) > 150mg/dl in 41 % of the people. (p-0.001)
RESULT Significant increase in BMI, WHR
Mohan V et al34 conducted a study on 1167 subjects residing in the residential areas of 2 industries (Indian Airlines and Integral Coach Factory) in Chennai in southern India. Diabetes was found in 11.9%; hypertension in 25.4%; dyslipdemia in 40.2%; hypertriglyceridemia in 28.3%; overweight (body mass index > or = 23 kg/m2) in 60.2%; and metabolic syndrome in 34.1%. Use of tobacco in any form was present in 22.9% of men and 0.5% of women.
STUDY 3: TABLE 9
STUDIED BY Gupta R et al35
TOPIC Prevalence (%) of cardiovascular
risk factors in men and women had the habit of smoking/tobacco use
STUDY POPULATION
1091
Prevalence (%) of cardiovascular risk factors in men and women had the habit of smoking/tobacco use in 37.6 and 11.6,
hypertension in 37.0 and 37.6%, overnight and obesity in 37.8 and 50.3, truncal obesity in 57.3 and 68.0,
high cholesterol > or = 200 mg/dl in 37.4 and 45.8, high triglycerides > or = 150 mg/dl in 32.3 and 28.6
metabolic syndrome in 22.9 and 31.6 percent.
RESULT Significant increase in
STUDY 4: TABLE 10
STUDIED BY Gupta R et al36
TOPIC Prevalence of dyslipidemia
STUDY POPULATION
234 physicians
Prevalence of high total cholesterol levels > or = 200 mg/dl was in 91 (44.8%) males and 10 (32.3%) females.
High LDL cholesterol level (> or = 100 mg/dl) was in 144 (70.9%) males and 22 (70.9%) females.
LDL levels > or 130 mg/dl in 70 (34.5%) males and 9 (29.0%) female physicians.
High triglyceride levels (> or = 200 mg/dl) were in 38 (18.7%) males and 4 (12.9%) female.
RESULT Significant prevalence of
STUDY 5: TABLE 11
Arijit De et al38 conduted a population-based study on 1005 persons. A total of 280 (27.9%) persons from the study population, were found to be hypertensive, of which 151(54%) persons were found to be dyslipidemic. Both males ans females hypertensives had significantly higher values of total cholesterol, TG, LDL-C as compared to control(p<0.001).
STUDIED BY Misra A et al37
TOPIC Correlation ofBMI, WHR with
lipid profile
STUDY POPULATION
532 subjects
high waist-hip ratio (WHR) in 9.4% (95% CI 5.4-14.8) of males, 51.1% (95% CI 45.8-56.3) of the females
STUDY 6: Table 12
STUDIED BY Chadha DS et al39
TOPIC Correlation BMI,WHR and lipid
profile STUDY
POPULATION
From aug 2005 to Jan 2006 at the Air Force Central Medical Establishment, New Delhi.
Hypertriglyceridemia (36%) was the commonest abnormality noted followed by low HDL-C levels (18%). Lipid subfraction analysis revealed that cholesterol and LDL-C correlated to BMI(r=0.2,p=0.002) and body fat% (r=0.16,p=0.020). in older men, BMI correlated positively with elevated cholesterol (r=0.36,p<0.001) while WHR correlated positively with triglycerides (r=0.42,p=0.001).
RESULT Combination of anthropometric
STUDY 7: TABLE 13
STUDIED BY AM Savant et al40
TOPIC Correlation BMI,WHR and lipid profile STUDY
POPULATION
1085, a retrospective study in 2006 at P.D.Hinduja National Hospital and Medical research Center, Mumbai, India. TC concentration 200 mg/dl, 38.7% were males and 23.3% were females. HDL-C was abnormally low in 64.2% males and 33.8% in females.
RESULT The increase of prevalence of hypercholesterolemia and
STUDY 8: TABLE 14
STUDIED BY Latheef SA et al41
TOPIC Correlation hypertension,obesity and lipid profile
STUDY POPULATION
1519
urban population of Tirupati
central obesity- 1003 (66%) [male 320 (59.4) and females 683 (41.12%)],
Low HDL cholesterol -709 (46.67%) [male 284 (52.69%) and females 425 (43.36%)], High triglyceride levels (>or= 150 mg/dl) 444 (29.2%)[(males 173 (32.09%) and females 272 (27.75%),
high cholesterol levels (>or=200 mg/dl) [(males 127 (23.56%) and females 278 (28.36%)
hypertension 396 (26.06%) [males 149 (27.64%) and females 247 (25.20%)].
STUDY 9:TABLE 15
STUDIED BY Chow CK et al42
TOPIC Mean levels of total, LDL, HDL-cholesterol and triglycerides in population if Asian definitions are used. STUDY
POPULATION
4535
rural Andhra Pradesh
mean levels of total, LDL, HDL-cholesterol and triglycerides were 4.5 (4.4-4.6) mmol/L, 2.8 (2.7-2.9) mmol/L, 3.0 (3.0-3.1) mmol/L, 1.2 (1.16-1.22) mmol/L, 1.3 (1.2-1.4) mmol/L for women.
18.4% of men and 26.3% of women were overnight rising to 32.4% of men and 41.4% of women if ‘Asian’ definitions were used.
Criteria for NCEP-ATPIII metabolic syndrome were met by 26.9% of men and 18.4% of women with figures of 32.5% and 23.9%, respectively, if ‘Asian’ waist cut-offs were substituted.
STUDY 10: TABLE 16
STUDIED BY Gupta R et al43
TOPIC Correlation between
STUDY POPULATION
1123 adults aged >20 years in an urban Indian population in Jaipur Heart watch study-2.
Obesity, body mass index > or = 27 kg / m2 was present in 135 males (24.5%) and 173 females (30.2%). Truncal obesity (waist :hip > 0.9 males, >0.8 females) was found in 316 males (57.4%) and 392 females (68.4%).
The most comman dyslipidemia in both males and females was low HDL-cholesterol (<40 mg/dl: males 54.9%, females 54.2%). High total cholesterol levels of > or = 200mg/dl (males 37.4%, females 54.2%).
High LDL-cholesterol levels of > or =130 mg/dl (males 37.0%, females 45.8%) and high levels of triglycerides > or = 150 mg/dl (males 32.3%, females 28.6%) were also seen in a significant number.
Waisr JS et al44 studied 2050 adult Asian Indian subjects residing in two metropolitan cities and found that hypertriglyceridemia (>150 mg/dl) in 20.2% and low levels of HDL-C (<40 in males; <50 mg/dl in females) in 55%.
Gupta A et al45 studied 1091 urban Indian population aged 20 years and above, and it was found that among men and women high triglycerides in 32.1 and 28.6%, low HDL cholesterol in 54.9 and 90.2%; central obesity in 21.8 and 44.0% of individuals.
Gupta A et al46 studied 1127 adults aged >20 years and found that among men and women obesity (BMI>or=25 kg/m2) in 303 (54.5%) and 350 (61.3%), truncal obesity (high WHR) in 339 (61.0%) and 310 (54.30%), hypertension in 322 (57.9%) and 279 (48.9%), high total cholesterol>or=200 mg/dl in 111 (32.6%) and 120 (39.5%), low HDL cholesterol<40mg/dl in 103 (30.3%) and 83 (27.3%), high triglycerides>or=150mg/dl in 146 (42.9%) and 132 (43.4%).
Gupta R et al47 studied 1091 adults > 20 years in Indian urban population, central obesity (waist, men > 102 cm, women >88cm) was found in 116 (25.6%) and 246 (44.0%); low HDL cholesterol (men,40mg/dl, <1.0mmol/l), women<50 mg/dl, <1.3mmol/l) in 292 (54.9%) and 504 (90.2%); high triglycerides >/=150 mg/dl (>/=1.7mmol/dl) in 172 (32.3%) and 160 (28.6%).
lipoprotein cholesterol in 169 (74.8%) and 155 (66.8%),among men and women. There was significant linear relationship of body mass index with prevalence of hypercholesterolemia.
Gupta R et al49 studied (in 1995)2212 subjects and 1123 subjects(in 2002) in an Indian urban population and found that , In men, high total cholesterol > or = 200mg/dl was in 24.6% vs. 37.4%, high LDL cholesterol > or = 130 mg/dl in 22.1 vs. 37.0%, high triglycerides > or = 150 mg/dl in 26.6 vs. 30.6% and low HDL cholesterol < 40 mg/dl in 43.2 vs. 54.9%; while in women these were in 22.5 vs. 43.1%, 28.6 vs. 45.1%, 28.6 vs. 28.7% and 45.9 vs. 54.2% respectively.
METHODOLOGY
Design and Data collection
This was a cross sectional study. The study was undertaken on the female subjects approaching the outpatient department of the Coimbatore Medical College Hospital, Coimbatore between September 2014 – August 2015. The study is proposed to be conducted after obtaining consent from the subjects.
Inclusion criteria
• Healthy female subjects without comorbid illness • Age group between 25-60yrs
Exclusion criteria
• Diabetes mellitus • Hypertension
• Ischemic heart disease • Chronic renal disease
• Chronic liver disease • Hypothyroidism
Information was collected about demographics (age, gender and occupation), anthropometric measurements (body Wt, Ht, BMI, WC, hip circumference and WHR), personal habits of dietary pattern (veg/mixed), alcohol intake(quantity), tobacco chewing and smoking and clinical parameters (BP, FBS, ECG) ,previous drug intake and F/H of diabetes, hypertension, ischemic heart disease). Blood collected by puncturing vein after 8-10 hours of overnight fasting.It was collected in red topped plain tubes for analysis. Routine urine analysis was carried out on the same day and ECG was taken for those who were found to be dyslipidemic.
Patients were interviewed as per the prepared Proforma and then complete clinical examination was done.
Blood Glucose and lipid subfraction Analysis
Definitions and Cut off points of hyperlipidemia
According to NCEP- ATP III Guidelines ,serum lipid fractions are categorized into:1.Hypercholesterolemia defined as TC > 200mg/dl
2 LDL-C as > 100mg/dl,
3. Hypertriglyceridemia as TGL > 150mg/dl
According to ADA,.FBS > 126mg/dl /on anti diabetic drugs were considered as Diabetes Mellitus.
Statistical Analysis
Age, Anthropometric measurements, Serum Lipid subfraction and fasting glucose levels measured were calculated by using -mean + SD. The data collcted were again categorized according to two age groups .By using Chi square test, Unpaired t test was applied in comparisons of independent and dependent proportions. A p value <0.05 was considered deemed significant. Results were expressed as percentages.
RESULTS
[image:67.612.121.510.211.457.2]The study population was comprised of 100 asymptomatic females aged between 25-40years.
TABLE 17: DEMOGRAPHIC AND CLINICAL CHARACTERISTICS OF THE STUDY POPULATION
Parameter Means SD+ P Value
Age 30.76 4.73 -
Weight 59.43 7.67 >0.05
Height 158.23 5.88 >0.05
BMI 23.69 2.69 <0.01
WC 78.82 2.71 <0.01
WHR 0.87 0.05 <0.05
Systolic BP 117.70 9.23 -
Diastolic BP 78.08 5.90 -
Unpaired t test was applied P < 0.05 is significant
TABLE 18: BIOCHEMICAL CHARACTERISTICS OF THE STUDY
POPULATION
Parameter Means SD+ P Value
TC 169.54 24.33 >0.05
TGL 134.27 19.73 >0.05
LDL 103.85 24.45 >0.05
HDL 39.85 5.91 >0.05
VLDL 24.52 14.16 0.02
FBS 98.99 12.04 >0.05
TABLE 19: DISTRIBUTION OF LIPID PROFILE AMONG
ASYMPTOMATIC FEMALES
Lipid profile
Dyslipidemia
FIG 11
Among 100 asymptomatic females, 43% were found to be dyslipidemic. Remaining 57% were normolipidemic.
: DISTRIBUTION OF LIPID PROFILE AMONG
ASYMPTOMATIC FEMALES
Lipid profile No
Normal 57
Dyslipidemia 43
Total 100
11: DISTRIBUTION OF LIPID PROFILE
Among 100 asymptomatic females, 43% were found to be dyslipidemic. Remaining 57% were normolipidemic.
57 43
Lipid profile
Normal
Dyslipidemia : DISTRIBUTION OF LIPID PROFILE AMONG
Among 100 asymptomatic females, 43% were found to be dyslipidemic. Normal
[image:69.612.155.510.291.497.2]TABLE 20: DISTRIBUTION OF BMI AMONG ASYMPTOMATIC
BMI
Obesity Overweight
Normal
FIG
Among 100 asymptomatic females 41 were found to be were obese, 33 were found to be over weight.
: DISTRIBUTION OF BMI AMONG ASYMPTOMATIC
FEMALES
<30Yrs 31 to 40Yrs
11 15
21 12
29 12
FIG 12: DISTRIBUTION OF BMI
Among 100 asymptomatic females 41 were found to be normal BMI, 26 were obese, 33 were found to be over weight.
BMI
Obesity
Overweight
Normal : DISTRIBUTION OF BMI AMONG ASYMPTOMATIC
normal BMI, 26 Obesity
Overweight
TABLE 21: DISTRIBUTION OF WC AMONG ASYMPTOMATIC
WC
Abnormal Normal
Among 100 asymptomatic females, 76 were Circumference, 24 were found to be abnormal.
: DISTRIBUTION OF WC AMONG ASYMPTOMATIC
FEMALES
<30Yrs 31 to 40Yrs
Abnormal 9 15
52 24
FIG 13: DISTRIBUTION OF WC
Among 100 asymptomatic females, 76 were found to be normal Waist Circumference, 24 were found to be abnormal.
WC
Abnormal
Normal : DISTRIBUTION OF WC AMONG ASYMPTOMATIC
found to be normal Waist Abnormal
[image:71.612.142.507.260.473.2]TABLE 22: PATTERN OF DYSLIPIDEMIA IN ASYMPTOMATIC Parameter TC>200 TGL>150 LDL>100 HDL<40 FIG 14
In 100 asymptomatic females studied, the HDL was <40mg/dl is 55, followed by TGL >150mg /dl in 25, the TC >200mg/dl and LDL >100mg/dl were 16 each. 16 TC>200 0 10 20 30 40 50 60
: PATTERN OF DYSLIPIDEMIA IN ASYMPTOMATIC
FEMALES
Parameter No P value
16 >0.05
TGL>150 25 >0.05
LDL>100 16 >0.05
HDL<40 55 >0.05
14: PATTERN OF DYSLIPIDEMIA
In 100 asymptomatic females studied, the HDL was <40mg/dl is 55, followed by TGL >150mg /dl in 25, the TC >200mg/dl and LDL >100mg/dl were
25
16
55
TGL>150 LDL>100 HDL<40
Dyslipidemia
Dyslipidemia : PATTERN OF DYSLIPIDEMIA IN ASYMPTOMATIC
In 100 asymptomatic females studied, the HDL was <40mg/dl is 55, followed by TGL >150mg /dl in 25, the TC >200mg/dl and LDL >100mg/dl were
[image:72.612.145.504.350.563.2]TABLE 23 : DISTRIBUTION OF BMI AND DYSLIPIDEMIA
DYSLIPEDEMIA TOTAL
YES NO
No. % No. % No. %
BMI
Obese (>25) 24 92.3 2 7.7 26 100.0 Over wt
(22.5-25)
7 21.2 26 78.8 33 100.0
Normal
(<=22.5)
13 31.7 28 68.3 41 100.0
TOTAL 44 44.0 56 56.0 100 100.0
TABLE 24 :DISTRIBUTION OF WC AND DYSLIPIDEMIA
DYSLIPEDEMIA TOTAL
YES NO No. %
No. % No. %
WC
Above Normal
(>80)
22 91.7 2 8.3 24 100.0
Normal (<=80) 22 28.9 54 71.1 76 100.0
TOTAL 44 44.0 56 56.0 100 100.0
TABLE 25: DISTRIBUTION OF DYSLIPIDEMIA
BASED ON AGE
Parameter
Age
<30Yrs 31 to 40Yrs
No % No %
TC 8 13.1 8 13.1
TGL 13 21.3 12 30.8
LDL 8 13.1 8 13.1
HDL 31 50.8 24 61.5
TABLE 26: INCIDENCE OF DIABETES AND IMPAIRED FASTING
GLUCOSE IN ASYMPTOMATIC FEMALES
Age TOTAL
30 YRS OR
BELOW
31-40 YRS
No. %
No. % No. %
FBS
>126 2 3.3 3 7.7 5 5.0
110-126 3 4.9 3 7.7 6 6.0
<110 56 91.8 33 84.6 89 89.0
0 20 40 60 80 100 120 No. %
30 YRS OR BELOW
[image:77.612.132.474.135.343.2]Age
FIG 15: INCIDENCE OF DIABETES AND IMPAIRED FASTING
Out of 100 asymptomatic females studied,
Among them 3.3 percent were below 30 years,7.7 percent were in 31 group. However there was no statistical
No. %
31-40 YRS No. %
Age TOTAL
FBS >126
FBS 110-126
FBS <110
TOTAL
: INCIDENCE OF DIABETES AND IMPAIRED FASTING GLUCOSE
asymptomatic females studied, Diabetes was found in 5 percent. Among them 3.3 percent were below 30 years,7.7 percent were in 31
group. However there was no statistical significance (P value >0.05). 126 : INCIDENCE OF DIABETES AND IMPAIRED FASTING
TABLE 27: AGE SPECIFIC DISTRIBUTION OF CORONARY RISK FACTORS AMONG STUDY POPULATION
Characteristics
Age group
P Value <30Yrs (61) 31 to 40Yrs (39)
Hypercholesterolemia (>200mg/dl)
8(13.1) 8(20.5) >0.05
Hypertriglyceridemia (>150mg/dl)
13(21.3) 12(30.8)
>0.05
High LDL (>100mg/dl)
8(13.1) 8(20.5) >0.05
Low HDL (<40mg/dl)
31(50.8) 24(61.5)
>0.05 High FBS
(>126mg/dl)
2(3.3) 3(7.7) >0.05
High WC (>80cm) 9(14.8) 15(38.5) <0.05
High W/H Ratio (>0.80cm)
61(100) 39(100) -
High BMI (>25kg/m2)
11(18) 15(38.5) >0.05
High BP
(>130/85mmHg)
TABLE 28: CORONARY RISK FACTORS AND HABITS
Parameter Tobacco chewer (n=26)
Non tobacco
chewer(n=74) P Value
TC>200 9 7 <0.01
TGL>150 16 9 <0.01
LDL>100 9 7 <0.01
HDL<40 6 49 <0.01
WC>80cm 15 9 <0.01
WHR>0.7 26 74 -
BMI>25 17 9 <0.01
Parameter Alcoholic n=8
Non alcoholic
n=92 P Value
TC>200 4 12 <0.05
TGL>150 6 19 <0.01
LDL>100 4 12 <0.05
HDL<40 1 54 <0.05
WC>80cm 8 16 <0.01
WHR>0.7 8 92 -
Parameter Veg n=16
Mixed
n=84 P Value
TC>200 7 9 <0.01
TGL>150 11 14 <0.01
LDL>100 7 9 <0.01
HDL<40 4 51 <0.01
WC>80cm 10 14 <0.01
WHR>0.7 16 84 -
BMI>25 11 15 <0.01
In 100 asympyomatic females,26 were chewing tobacco,8 were alcoholic,16 were vegetarians.Dyslipidemia was found to be significant in tobacco chewers (P value <0.01) and alcoholic (P value <0.05) .BMI and WC were higher in tobacco chewer ( P value <0.01).
TABLE 29: PEARSON CORRELATION COEFFICIENT ANALYSIS OF
VARIABLES OBESITY AND DYSLIPIDEMIA
DYSLIPIDEMIA
BMI Pearson Correlation 0.393**
WC Pearson Correlation 0.549**
WHR Pearson Correlation 0.260*
**.Significance at 0.01 level. *Significance at 0.05 level.
TABLE 30: PEARSON CORRELATION COEFFICIENT ANALYSIS
OF VARIABLES OBESITY AND LIPID PROFILE
TC TGL LDL HDL
BMI
Pearson Correlation
.396** .597** .421** -.330**
WC
Pearson Correlation
.646** .664** .703** -.529**
WHR
Pearson Correlation
.204* .369** .236* -.268**
** Significance at 0.01 level. * Significance at 0.05 level.
Pearson correlation coefficient analysis showed significant correlation between BMI with TGL(P<0.01), LDL(P<0.01), HDL(P<0.01). Waist Circumference had significant correlation with TC(P<0.01), TGL(P<0.01), LDL(P<0.01).
TABLE 31: PEARSON CORRELATION COEFFICIENT ANALYSIS OF
LIPID SUBFRACTIONS TO VARIABLES OF OBESITY IN VARIOUS
AGE GROUPS
Variables <30yrs 31-40yrs
Total cholesterol
BMI 0.323* 0.451**
WC 0.734** 0.551**
WHR 0.196 0.161
Triglycerides
BMI 0.530** 0.690**
WC 0.789** 0.690**
WHR 0.349** 0.382*
LDL
BMI 0.349** 0.482**
WC 0.789** 0.626**
WHR 0.247 0.185
HDL
BMI -0.212 -0.606**
WC -0.430** -0.743**
DISCUSSION
In our study ,a step towards evaluating the blood level of lipids and
glucose in asymptomatic females in urban population and identifying these
coronary risk factors by anthropometric variables. The study identifies the
pattern of dyslipidemia such hypercholesterolemia, hypertriglyceridemia and
abnormally high Low Density Lipoprotein cholesterol(LDL) and low High
Density Lipoprotein cholesterol (HDL) levels in all age groups, which are
well known risk factors for CardioVascular Diseases.
Overall prevalence of dyslipidemia was ranged from 10-73% in
various studies37.In our study43% of asymptomatic females were found to be
dyslipidemic.Our results are consistent with the previous cross sectional
study conducted among Sudanese women in Khartoum state25 and across
sectional study conducted at Tirupathi41 wherein increased prevalence of
dyslipidemia in young females was found to be one of the major contributor
Our study which showed that elevated lipid levels were prominent in
31-40year age group as compared to <30 years,which means the risk of
dyslipidemia increases as the age advances .In our study, fasting blood sugar
found to be more in 31-40 year age group and of these 7.7%were found to be newly diagnosed Diebetes Mellitus.The remaining subjects with impaired
fasting blood sugar levels (6%) are on their way to become Diabetic in
future, which is an important risk factor for CAD.Enas et al,in Coronary
artery disease in Indians (CADI) study reports the prevalence of diabetes
mellitus to be three to six times higher among south Asians than Europeans,
Americans and other Asians45. In our study,Dyslipidemia was found
significant among tobacco chewers and alcoholics (P value<0.01).This is
consistence with the study done by Gupta BK et al50.
In our study , the most common dyslipidemic pattern observed was
low HDL cholesterol(61.5%). These finding is consistant with Jaipur Heart
Watch-251,Jaipur Heart Watch-347 studies and cross sectional study which
was conducted at Tirupati41.In our study,low HDL cholesterol was not
differs significantly between the age group <30 years(50.84%) and
31-40years(61.5%)37.HDL cholesterol particles are mainly involved in reverse
cholesterol transport,leading to antiatherogenic effect.HDL is more specific
wall52.Low HDL cholesterol levels are stronger predictor of premature and
severe Coronary Artery Disease(CAD) and Stroke and its
recurrence.54Increased prevalence of low HDL cholesterol was reported in
earlier study by Enas et al,who found that only 5% of Asian Indian women
had optimal HDL levels53.
In the process of Atherosclerosis,high LDL cholesterol and its
oxidation has been recognized as primary risk factor for Coronary Artery
Disease by National Cholesterol Education Programme(NCEP) Adult
Treatment Plan(ATP)-III.53In our study,low LDL cholesterol was found
20.5% in31-40 years age group,13.1% among <30 years because of
unhealthy food habits and life style modifications.
In our study,the second common lipid subfraction contributing to
dyslipidemia was hypertriglyceridemia which was 30.8% in the age group of
31-40 years,21.3% among <30 years.The hypertriglyceridemia,
hypercholesterolemia and high LDL is a major risk factor of concern in the
age group of 31-40 years. When compared to western population ,Indians
had relatively low serum cholesterol predispose them to CAD.55In Chennai
based hospital study,the threshold for the TC levels posses the risk for CAD
was<200mg/dl and 75% of Myocardial Infarction(MI) patients had less