Connecting with the Y Generation: an Analysis of
Factors Associated with the Academic
Performance of Foundation IS Students
Rohan Genrich, Dave Roberts, Aileen Cater-Steel, Ee Kuan Low
University of Southern Queensland, Toowoomba, QLD, Australia
Rohan.Genrich@usq.edu.au
roberts@usq.edu.au
caterst@usq.edu.au
eekuanlow@usq.edu.au
Abstract
A strategy to overcome challenges associated with teaching a foundation Information Systems (IS) course to large cohorts of Business students has been highly successful. To further refine the strategy, a survey was conducted to better understand attitudes and computer experience of the students. This study revealed that factors such as gender, age, study mode, type of secondary school attended, level of previous computing studies, perceived knowledge, frequency of use and attitudes towards using computers did not predict academic performance. Academic performance and characteristics of students belonging to the Y Generation were also compared with those of the Older Generation. Differences between these generations were found to exist in relation to perceived knowledge, level of previous computing studies, and experience of formal computing studies. It is imperative that educators be aware of the characteristics of the growing Y Genera-tion students. This research has raised critical curriculum issues for the development of founda-tion IS pedagogy.
Keywords: IS Education; Y Generation; Mature Age Students; Empirical Study; Academic Per-formance Determinants
Introduction
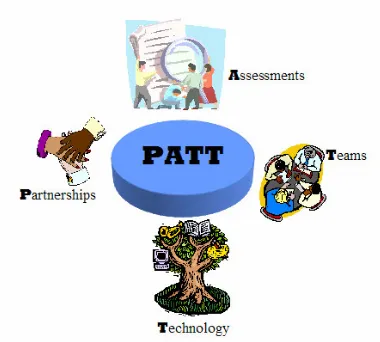
In the year 2000, a strategy was developed and adopted to overcome identified challenges associ-ated with the characteristics of the current cohort of students undertaking the foundation Informa-tion Systems (IS) course. The strategy incorporated four elements: Publisher Partnerships, A s-sessment Styles, Team Teaching and Internet Technology (PATT). The aim of this research is to evaluate the success of the PATT strategy, whilst exploring the differences between Y Generation and Older Generation students; and also to analyze the association between academic perform-ance and perceptions and characteristics of students in the IS foundation course.
This paper begins by defining the characteristics of the Y Generation, describes the evolution of the PATT strategy and states the research questions addressed. Then the main elements of the
methodology are described and the results of the analysis presented. Fi-nally, implications of the findings are discussed and opportunities for further research are identified.
Background
A major concern experienced by all universities in Australia and overseas is the challenge posed by characteristics of the current and future cohorts of students (Lynch & Collins, 2001). This challenge includes issues such as increased emphasis on flexible delivery,
technology-experienced students, competition for technology and faculty resources, dynamic nature of course content, and students’ expectations in teaching technology. In light of this, a literature review suggested various guidelines to overcome the challenges identified. A four-pronged strategy (PATT) was derived and has been implemented over the last three years. This strategy has been modified in response to both qualitative and quantitative analyses of survey responses from stu-dents who undertook the course during Semester 1, 2002.
The students involved in this study are all business faculty undergraduates enrolled in this com-pulsory foundation IS course. These students are working towards qualifications in a program of Accounting, Finance, Business, Information Technology (IT), or Economics. Within the program, students choose one major, or a combination of two major areas of study. The most popular ma-jors offered by the Faculty of Business include Computer Software Development; IT Manage-ment; Marketing; Human Resources ManageManage-ment; e-Technologies; e-Commerce; Accounting; Law; and Economics and Resource Management. Over a period of 12 weeks, students in the foundation IS course covers the following concepts: fundamentals of computing, application software, computer hardware components, networking and communications, databases and in-formation systems, multimedia, systems analysis, Internet technologies, and social and ethical implications of the computer age.
Previous Research
Before stating the research questions, a brief introduction is provided to the key components of the research area. Related research about the characteristics of the Y Generation is now presented, followed by a description of earlier work undertaken to formulate the PATT strategy.
The Y Generation
The Y Generation is defined as those born between 1979 and 1994. They are known by a number of labels: Generation Y, Echo Boomers, or Millennium Generation (Neuborne & Kerwin, 1999). It is only recently that students of this generation have entered higher education. Hence, there is currently little formal academic research pertaining to higher education of Y Generation students. Research from Monash University, as early as 1998, highlighted the differences between the per-ceptions of academic performance of school leavers and mature age students. This indicates the possibility of differences between the Y Generation (current school leavers), and the X Genera-tion and Baby Boomers (mature age students).
The Y Generation is more racially diverse; there is an increasing number that live in single-parent households; and more have working mothers compared to the older generation (Neuborne & Kerwin, 1999). Neuborne and Kerwin (1999) go on to assert that one important difference is that while baby boomers are still mastering Microsoft Windows and its associated applications, their children are and have been using computers in primary school. The Y Generation comprise a sub-stantial and growing proportion of the population: for example, in Queensland, there are currently almost 1.3 million people who were born since 1979, which is 35 percent of the population of the State (ABS, 2001).
develop-ment years have been accompanied by rapid technological advances. They are goal-oriented, re-wards-oriented and seek the shortest path to personal success (Flanagan, 2003).
The PATT Strategy
The PATT strategy (see Figure 1) was derived using the research based on that by Roberts (1991), Bates (1994), Nunan (1996), Moran (1996), and Hanlon and Thomas (1999). This has been further extended upon by the re-search done more recently regarding the Y Generation as reported by McCowan, a careers and employment counselor, (personal commu-nication, 19 May 2003), Walsh (2002), Flanagan (2003) and Sweetman (2003). These authors sought to identify a set of guidelines for optimizing the learning experience of the Y Generation. These guidelines, adapted to suit the foundation IS course, include: Y Gen-eration students absorb everything in short segments; they tend to have short attention spans and must be entertained; it is important
to provide them with challenging work that really matters; they must be allowed some flexibility in scheduling their study; assessment must be thoroughly balanced, clearly delegated assignments with some freedom and flexibility; the focus still must be on study, but lecturers should be per-sonable and show a sense of humor; students should be encouraged to establish mentoring rela-tionships (e.g. with tutors and proctors); staff should consistently provide constructive feedback in tutorials and assignments; and staff should create a comfortable, low stress environment in the classroom.
In the next section, the four prongs of the PATT strategy are described.
Publisher Partnerships
Collaboration with publishers is leveraged to provide access to state-of-the-art information and up-to-date textbooks. Feedback to the text author through the publisher allows for continuing en-hancements to existing textbooks. Teaching support components form useful tools to assist course developers by reducing staff workload and enhancing the learning experience for foundation IS students. The texts used in Semester 1, 2002 were Discovering Computers 2001: Concepts for a Connected World (Shelly, Cashman, Vermaat, & Walker, 2000) and Exploring Microsoft Office 2000 Professional Volume 1 (Grauer & Barber, 1999). These texts are supported by professional web sites provided by the publishers. These web resources are useful for students and instructors and include current news articles, movie and animation clips, MS PowerPoint slides, exercises and chapter summaries.
Assessment Styles
[image:3.612.302.492.138.309.2]According to Sweetman (2003) and Walsh (2002), Y Generation students view life through a prism of self-interest. They change courses regularly; one in seven students switch courses within the first six weeks of university, and tend to take in course content in short segments. At the same time, Y Generation students are best motivated by balancing clearly defined assignment parame-ters with freedom and flexibility (Flanagan, 2003). Assessment styles employed by lecturer and tutors target teaching at an appropriate level of students’ skills and experience. In conjunction
with learning centers located within the University, a collaborative team was formed in which syllabus writers of the learning centers liaised with the teaching team to ensure that pre-university computing courses lead into foundation IS courses. This is in alignment with the thrust of re-source-based learning that enables students to achieve competence in a manner which is relevant to their own intellectual and social circumstances (Moran, 1996).
In previous offerings of this course, on-campus students were given a choice of submitting six out of 10 assignments. This was abandoned to standardize assessment across students of both on-campus and external students. Due to the large cohort, it was found un-manageable to allow for choice in assignment submissions. In the semester under study, there are three assignments form-ing a linked series of activities related to a sform-ingle simulated business scenario.
Team Teaching
A teaching team approach was chosen for the PATT strategy because it was recognized (and later confirmed by Sweetman 2003) that Y Generation students have short attention spans and must be entertained. The need for a focus on work, with some personality and sense of humor, has also been flagged recently by Flanagan (2003). A team teaching approach ensures continuity of course development; supports collaborative teaching; offers complementary skills and different personal-ity traits. This is one way to reduce the burn-out syndrome experienced by teaching staff of entry-level IS courses. It also allows teaching staff to strike a balance between teaching and other aca-demic and scholarship pursuits.
An interactive teaching and learning approach is undertaken in lectures and tutorials. These ses-sions use elements of technology and entertainment such as games, debates on contemporary IS issues, role-plays, student presentations in both learning and as an integral part of assessment, and real-life focused case studies. Assignments are integrated to form a realistic business application, using various software packages, and combining these technical skills with a systems analysis and business information systems flavor. This interactive approach has been used successfully for teaching English as a second language (Schwarzer, Kahn, & Smart, 2000) and the benefits of this approach at the tertiary level are expounded by Hanlon and Thomas (1999).
Internet Technology
Internet technology is used as an information dissemination tool. It is recognized by Sirkemaa (2003) that the ‘learning environments have an important role in integrating the media and tech-nology’. Information pertaining to the study module and to the upcoming lecture is provided to students via the Web. Discussion groups are used as a means to facilitate discussion and encour-age active participation. The use of an online assessment engine allows students to self-evaluate their skills and knowledge, and at the same time, course coordinators are able to use statistics of access habits and assessment results to track student participation levels and identify weak knowledge areas. These assessment engines feature increased access and improved learner con-trol over the education and learning process (Nunan, 1996). This aligns with Flanagan’s view (2003): Y Generation students achieve more in a comfortable, relatively low-stress environment.
Research Questions
of student attendance, student academic performance and faculty satisfaction, the PATT strategy returned positive results. However, it was found that understanding the characteristics, attitudes and expectations of the diverse, technology-smart entry-level cohort is a critical factor in develop-ing and deliverdevelop-ing IS courses to first year business students. This view is supported by Bates (1994) who argues that peoples’ attitudes towards IT and their access to it will be influenced by educational experiences and technologies used in work and leisure.
According to McCaslin (1995), six major factors impact on evaluation efforts: decreased financial resources; increased public dissatisfaction; changed management approaches; enhanced evalua-tion methods and procedures; redesigned organizaevalua-tions; and increased privatizaevalua-tion efforts. De-creased financial resources, changed management approaches, and enhanced evaluation methods and procedures have all played a role in the development of the educational program and evalua-tion methods in the foundaevalua-tion computing course at the university under study. In regards to en-hanced evaluation methods and procedures, the following testing and surveying methods were implemented within the foundation computing course at the university:
• Outcomes assessment – the process of determining the results of education at the univer-sity, program and student level (Bragg, 1992);
• Performance assessment and measurement – the process of estimating or describing, the value of the performance attributes or products created by individuals or groups (Wheeler & Haertel, 1993); and
• Value-added assessment – the positive difference that an educational experience makes in a student’s knowledge, attitudes and skills (Northeast Missouri State University, 1984). This study was undertaken to understand the characteristics and attitudes of the current cohort of the foundation IS course by addressing the following three research questions:
1. Has the proportion of students who fail the course declined since the introduction of the PATT strategy?
2. Does gender, secondary school education, perceived knowledge, frequency of use, atti-tude to using computers, and academic performance differ amongst Y Generation stu-dents and Older Generation stustu-dents?
3. Is academic performance associated with age, study mode, gender, secondary school edu-cation, perceived knowledge, frequency of use, and/or attitude to using computers?
Methodology
The approach taken involved the use of a web-based survey. This was conducted early in the se-mester to determine students’ perceptions about using computers. This questionnaire also col-lected data about the breadth and depth of students’ expertise with a range of computer applica-tions, and how frequently they used the applications. In the third week of the semester, an e-mail was sent to all enrolled students (internal and external) advising the URL of the questionnaire and requesting their participation. Student participation in the survey was voluntary. Students were encouraged to respond but no recompense was offered. After two weeks, a follow-up email was sent to all students to urge those who had not responded to do so.
global standard for tertiary entrance, this study extended previous research by using factors other than tertiary entrance scores.
The questionnaire included four demographic questions, four questions relating to secondary school education, five questions about previous use of computers, 16 statements probing per-ceived computer application skills, 16 statements about the frequency of use of applications, and 15 questions to determine the attitude towards using computers. A copy of the questionnaire is available at URL
http://web.usq.edu.au/course/material/cis1000/survey/Survey75001/Survey75001_2.asp In an effort to understand the students enrolled in the course, the following data were obtained: age; gender; whether the students had formal classes with computers at secondary school; type of school they attended; whether they owned a computer; when they first purchased a computer; the number of hours spent working on the computer; their self-rated skills in different computer ap-plications (perceived knowledge); and the frequency of use of the different apap-plications (fre-quency of use); and their attitude to using computers.
Personal particulars were measured across four variables. Student identification number was re-quested even though confidentiality was recognized as an important ethical consideration, but anonymity was sacrificed as the student number was necessary to allow the survey responses to be linked to student academic performance. Although the web program did not validate the stu-dent number against the University’s files, duplicate stustu-dent numbers were rejected. The current study mode was measured as follows: 1: Day (on-campus); 2: External; 3: Online. Students were asked their age in years. Gender was coded as 1: Male; 2: Female.
Secondary School Education was measured across four variables. The type of school attended was coded as either 1: Public; 2: Private. Students were asked if they had attended formal secon-dary computing classes 1: Yes; 2: No. The highest level of formal computing class attended was also measured 1: Junior Secondary Computing Studies; 2: Senior Secondary Computing Studies; 3: Senior Secondary Business / Secretarial Studies; 4: Senior Secondary Software Development Studies; 5: Other Computing Studies.
Perceived Knowledge was measured on a six point Likert scale: 0: No Experience; 1: Limited Expertise; 3: Moderate Expertise; 5: Expert; over a diverse range of 14 computer applications. However, it was decided to focus on four applications: word processing, database, spreadsheet, and browser. In this study these were selected as they were deemed more relevant to the course content and assessment. An overall score of perceived knowledge for each respondent was ob-tained by aggregating responses for these four applications.
choice, I prefer to use a computer for some tasks; educational curricula should make maximum use of computers; I enjoy using a computer; and, owning a computer is highly desirable.
A second source of data used in this research came from the University’s files of students’ results for the course from 1998 to 2002. Academic performance, the dependent variable, was measured as an aggregate of results obtained in all three assignments and the examination. Academic per-formance was measured on two scales, firstly as a total result out of a possible 100 marks (inter-val type scale), also as academic grades using an ordinal scale: high distinction (HD); distinction (A); credit (B); pass (C); and fail (F).
Analysis of Results
The data collected through the online survey were merged with student results extracted from the University’s database. The merge was performed on the basis of the student identification number to enable statistical analysis to be performed in SPSS.
Effect on Failure Rate
It had been noticed by the foundation IS lecturers that many students approached the course in an over-confident manner, and were then disappointed when they failed the course. Table 1, com-piled from University results files, shows the number of students and the failure rate from 1998, prior to the introduction of the PATT strategy, and then corresponding data from subsequent years after the strategy was implemented. The importance of the PATT strategy becomes more apparent considering the associated challenges posed by the large class sizes. A dramatic decline in the failure rate is evident since the introduction of the PATT strategy. Other factors that could have impacted upon the failure rate are considered in the Discussion section of this paper. The PATT strategy was phased during 2000-2001.
During the implementation of the PATT strategy, the assessment structure adopted has been modified to comprise of three assignments and a final examination. The three assignments en-tailed a linked series of activities related to a simulated business scenario. The first assignment (worth 10 percent) required students to use analysis, synthesis, evaluation, and research skills to prepare a formal report using advanced word-processing features. In the second assignment (worth 20 percent), students were required to create a database, then query it and export the data into a spreadsheet for subsequent statistical analyses and reports involving formulae and multiple-worksheets. The final assignment carried 10 percent and involved creating a prototype store-front web site for the business, and the use of MS PowerPoint to develop a business presentation of the findings from the first assignment. The examination (weighted as 60 percent) included two parts: short answer questions relating to information systems content; then a test of technical skills in spreadsheets and databases.
Comparison of Y Generation and Older Generation
Researchers have previously identified differences between school leavers and mature age stu-dents. For example, a study conducted at Murdoch University, Australia (1998) found evidence
Table 1: Percentage failure rate for foundation IS course
1998 S1 1998 S2 1999 S1 1999 S2 2000 S1 2000 S2 2001 S1 2001 S2 2002 S1 Number of students
completed course 516 316 542 388 525 307 595 442 557
Percentage of
that mature age students underestimate their academic potential as compared to their younger counterparts. However, recent articles in popular press promote the idea that school leavers today are different in many ways to those of previous generations (Sweetman, 2003). This claim pro-vided motivation for this study.
Prior to undertaking the analysis of the survey conducted in semester one of 2002, responses were sight checked and 15 responses with invalid student numbers were deleted. 197 usable responses were received from a total population of 557 students, yielding a response rate of 35 percent. The proportions of respondents in terms of gender, age and academic performance were checked against the population and considered to be a reasonable representation. The enrolments were in the proportion of 43 percent males to 57 percent females. The survey respondents were 45 percent males to 55 percent females. As far as academic performance, the means were 58.1 percent for the population and 58.3 percent for the sample; for age, the population mean was 26.2 years and the sample mean was 25.2 years.
The data were partitioned into two groups on the basis of age. Students born after 1979, compris-ing 55 percent of the respondents, were deemed to belong to the Y Generation, as per Neuborne and Kewin’s definition (1999). The remaining students were grouped as the Older Generation. To compare the characteristics of the two groups, a t-test was used. However, prior to performing the t-test, following advice from Coakes and Steed (1996), Levene’s test was used to check that equal sample variances could be assumed. In all cases, the test was non-significant with a prob-ability greater than 0.05. This indicated that for perceived knowledge, frequency of use, attitude towards computers and overall academic performance, it can be assumed that there were no sig-nificant differences between the variances of the two groups.
A 2-tail t-test was then performed to compare the difference in perceived knowledge. The differ-ence in perceived knowledge was found to be significant (p = .000). As shown in Table 2, Y Generation students think they know more about computer applications (word processor, spread-sheet, database and browser) than the Older Generation.
Similar tests were also performed to compare the two groups with regards to frequency of com-puter use, attitude towards using comcom-puters, level of previous computing studies, and academic performance. It was found that there was no significant difference in the frequency of use and attitude towards using computers between the Y Generation and Older Generation students. Ex-amination of the responses revealed that all the students who selected the final option other to the question about level of previous computer studies had commented (in the text box provided) that they had undertaken higher level computer studies than those offered in secondary schooling (e.g. TAFE course). Therefore, the variable, level of previous computing studies, can be considered ordinal. As shown in Table 2, Y Generation students exhibited a higher level of previous
comput-Table 2: Comparison of means: perceived knowledge, frequency of use, attitude towards using computers, level of previous computing studies, and academic performance [* significant at .05]
Factors Y Gen Mean Older-Gen Mean t Df Sig. (2-tailed)
Perceived Knowledge* (range 0-20) 13.44 11.28 4.038 192 .00 Frequency of Use (range 0-16) 6.22 7.15 -1.733 181 .08 Attitude Towards Using Computers (range
0-40) 31.29 31.51 -.226 187 .82
Level of previous computing studies*
(range 1-5) 2.80 2.00 2.29 83 .02
[image:8.612.110.538.459.596.2]ing studies than the Older Generation (p=0.02). Most importantly, there was no significant differ-ence in the academic performance achieved between these two groups. So, while the Y Genera-tion students believe that they have a higher level of knowledge, and they have had formal studies to support their claim, their performance is matched by their older counterparts.
A chi-square test (Table 3) was used to compare the two groups as a nominal scale was used in measuring the variables: gender, type of school, computer ownership and formal computing stud-ies.
As shown in Table 3, of the four variables compared, the only one with a significant difference between Y-Generation and Older Generation students was experience of formal computing stud-ies. There was a slight difference in the means between the first two: gender and type of school, but the association was not significant. Therefore, to answer the second research question, the data show that there is a significant difference between the generations with regards to perceived knowledge, level of previous computing studies and the experience of formal computing studies, but not for gender, frequency of use, attitude to using computers, and academic performance.
Academic Performance
In the earlier test, the academic performance variable was measured on a scale of zero to 100 per-cent. Here, to enable cross-tabulation analysis, final grade from the university results file was used to measure academic performance. Table 4 shows how the grades were distributed in terms of gender, type of school, formal computing experience, study mode and age (generation). Re-sponses indicate nearly double the number of students attended public schools than private schools. Given that computers have been in schools since 1980, it was expected that most secon-dary school students would have taken formal computing studies. However, 51 percent of
re-Table 3: Comparison of means: gender, school type, computer ownership, formal computing studies [* significant at .05]
Factors Y-Gen mean Older-Gen mean 2 Sig. (2-tailed)
Gender (1:Male; 2:Female) 1.60 1.65 .54 .46
[image:9.612.86.478.193.293.2]Type of school (1:Public; 2:Private) 1.41 1.30 2.9 .09 Ownership of a computer (1:Yes; 2:No) 1.07 1.07 .02 .89 Formal computing studies* (1:Yes; 2:No) 1.42 1.77 25.2 .00
Table 4: Comparison of academic performance with gender, school type, formal computing studies, study mode, age
Grad
e Gender Type of School Formal Comput-ing Studies Ex-perience
Study Mode Age
Male Female
Pub-lic Private Yes No Day Exter-nal Y-Gen Older
HD 3% 2% 3% 3% 3% 2% 4% 1% 2% 3%
A 5% 16% 16% 6% 12% 10% 10% 12% 10% 12%
B 10% 12% 15% 7% 12% 11% 10% 13% 14% 8%
C 7% 8% 8% 6% 9% 5% 7% 7% 10% 5%
F 19% 17% 22% 14% 13% 23% 20% 16% 22% 14%
[image:9.612.72.506.551.720.2]spondents indicate no formal computing classes at school. Recent research shows that three per-cent of the X Generation population in Australia are in full-time study, nine perper-cent in part-time study, and with one-third achieving their first qualification since leaving school (AMP NATSEM, 2003). Therefore, it is not surprising that a substantial proportion (42%) of the respondents is from the Older Generation.
In Table 5 the distribution of grades is compared with the level of formal pre-university comput-ing studies for the 73 students who answered Yes to formal computing studies experience. Only some of the students enrolled in this foundation course have selected IS as their major. Many stu-dents (27%) have not undertaken computing studies beyond Junior Secondary level. Note also that respondents were only given one choice and the data represented the highest level of formal computing classes participated. It is interesting to note that those who have undertaken any of the
senior secondary computing or TAFE studies did not exhibit an advantage with regards to aca-demic performance in this course.
Correlations of academic performance with the other variables are presented in Table 6. As the variables included both nominal and ordinal data, non-parametric measures of correlation were used (as advised by Siegel, 1956). This table reports correlations (using Spearman’s rho) of aca-demic performance grade with age, attitude to using computers, frequency of computer use, per-ceived knowledge, gender, school type, study mode, and previous computing studies. All the cor-relations are very weak.
It was expected that the students’ attitude towards using computers, their previous formal com-puting studies, and their frequency of computer use would be associated with academic perform-ance. However, the results of the analysis did not confirm the association. In the next section, the implications from the analysis are presented with consideration to possible explanation of results.
Discussion
[image:10.612.108.542.239.420.2]In general, the empirical results of the current study provide partial support for the research ques-tions. In this section the implications of the results from the survey and analysis of students’ re-sults are discussed.
Table 5: Comparison of academic performance grade by highest level of formal computing classes (for students who answered Yes to formal computing studies experience)
Level of Formal Pre-University Computing Studies Grade
Junior
Secon-dary Senior Sec-ondary ness/Secretarial Busi-Senior Secondary
Software Develop-ment Senior
Secon-dary
Other (e.g. TAFE)
HD 3% 0% 0% 3% 0%
A 4% 5% 7% 5% 1%
B 11% 5% 1% 4% 1%
C 1% 4% 4% 7% 4%
F 8% 10% 1% 5% 3%
Success of PATT Strategy
In considering potential contributing factors, it must be noted that the assessment format, standard of assessment and grading rules have not been changed since the year 2000. Furthermore, ethical standards were not compromised to achieve the observed improvements. Therefore, the PATT strategy is considered to be the major reason for the decline in the failure rate of students (as shown in Table 1).
As well as a decline in the failure rate, success of the strategy was evidenced by positive unsolic-ited feedback about the course. Students specifically commended the real-world orientation; the practical value gained from assessment; the edutainment nature of the study materials and lec-tures; the interactive telephone tutorials; residential school classes; and online discussion group. One element of the PATT strategy is the development of teaching teams. This has contributed to a rise in morale of the teaching team which may explain the decline in failure rate. By recogniz-ing the importance of continuity, staff turnover within the team has been reduced. The course leadership role has been rotated and opportunities for further development provided to staff. Therefore the lecturers, tutors, markers and proctors have developed expertise and confidence; this has resulted in a focused effort to continue improvements to the course.
Other explanations for the decline of failure rate could include differences in student cohorts across semesters; differences in assessment items over time; variances in grading behavior of staff; effects of normalizing grades that will obscure actual performance levels; and variation of effectiveness of teaching staff. These may explain differences between one semester to the next, but do not provide reasonable explanation for the trend from 1998-2002, as identified in this study.
Y Generation Implications
[image:11.612.79.495.96.301.2]There was a difference between the Y Generation and the Older Generation in that the Y Genera-tion students had formal computing educaGenera-tion and at a higher level, although none of the other factors identified shows any correlation with academic performance. It is reassuring to know that the Older Generation students are not disadvantaged even though they did not have the same op-portunities at secondary school to study computing.
Table 6: Correlation analysis of academic performance grade against student characteristics
Factors Spearman Rank
Correlation Coeffi-cient
Sig. (2-tailed) N
Academic performance grade 1.000 . 147
Age (1:Y-Gen; 2:older generation) .113 .172 147
Attitude towards using computers (range 0-40) -.083 .326 142
Frequency of use (range 0-16) .003 .975 135
Perceived knowledge (range 0-20) .008 .925 145
Gender (1:male; 2:female) .140 .092 147
Type of school (1:public; 2:private) -.041 .619 147
Study mode (1: day; 2: external) .057 .497 147
As shown in Table 4, 58 percent of the survey respondents belong to the Y Generation. What does this mean for the future? Will more students be overconfident and likely to underestimate the work required? Surely the growth in the number of Y Generation students must warrant a radical shift in our educational paradigms.
Not surprisingly, the school curriculum has changed in the last decade providing more opportuni-ties for Y Generation students to undertake formal classes in computer studies at secondary school than their older counterparts. Consistent with this is that the level of computing studies undertaken was also found to be significantly different, with the Y Generation students having a higher level of previous computing studies. The number of respondents for the level of computing studies was small, and some caution should be exercised with these results. Perhaps the respon-dents could not identify with the wording of the survey item. The wording of the item was aligned with recent curriculum choices in Queensland, with which many older students, interstate stu-dents, and international students may not identify.
Academic Performance Predictors
The study did not confirm an association between academic performance and any of the factors examined. The strongest association was with experience of previous formal computing studies, followed by gender, but neither of these associations is statistically significant. Other factors to be considered in future studies have been suggested and include intelligence quotient (IQ), emo-tional quotient (EQ), and personality type (e.g. Meyers-Briggs Type Indicator).
It is interesting to compare the results of this study with that reported by Bryant, Campbell and Kerr (2001). Their study was conducted in Queensland and involved students undertaking an in-troductory IS course within a Bachelor of Business degree. Bryant et al. (2001) adapted and op-erationalized a construct named microcomputer playfulness which incorporates a mixture of computer attitude, computer anxiety, computer competence and computer efficacy beliefs. The dimensions of the computer playfulness measure (developed by Webster & Martocchio, 1992) correspond to the variables in this study in the following manner: the variable attitude to using computers includes anxiety; frequency of use relates to their measure of computer competence; and perceived knowledge is similar to their variable efficacy. It was suggested that student’s fa-miliarity with technology through constant use is a predictor of academic performance. However, now that many students are using computers more, it may be less useful as a predictor as there is less variation of computer use within current cohorts. In their study, Bryant et al. (2001) claimed that computer playfulness was found to be associated with only one of the three assessment items, the concept test (p = .049). In reference to earlier research, it should be noted that students who participated in these prior studies are unlikely to be students of the Y-Generation. Therefore, these earlier studies need to be assessed to establish if such findings are still valid for students of the Y Generation students.
Anecdotal evidence suggests that there is a tendency for students with a high perceived knowl-edge to become overconfident and consequently perform poorly, possibly because they think they have an adequate grasp of the foundation IS content. There is no correlation between the per-ceived knowledge and the actual performance: students with high perper-ceived knowledge did not necessarily gain high academic results. Perceived knowledge is not a reliable determinant of aca-demic performance.
Curriculum Issues
through to TAFE certificate. Therefore, it is imperative that the foundation IS course caters for the array of skills that students possess. The fact that many students have completed computing courses at secondary school raises two issues which need to be addressed. Should these students be exempted from the Foundation IS course? Also, how can the course leaders ensure that the Foundation course content is not repeating the content of their previous courses? It is important that the course leader is aware of the secondary school curriculum so students are motivated by the foundation IS curriculum. Would it be effective for foundation IS course leaders to participate on Government curriculum authorities? Should IS departments follow other disciplines such as Physics and Accounting in providing exemptions for those who have completed senior secondary courses?
Limitations of the Study
One of the acknowledged difficulties with the use of self-administered surveys is the lack of con-trol by the researcher in the environment in which the respondent completes the survey. However, this was overcome by encouraging students to complete the instrument by keeping the survey instrument as short as possible. No personal rewards were offered and it was not compulsory for students to participate. Also, it is recognized that due to differences in population, curriculum, assessment structure and policy, the results obtained may not be generalizable to other universi-ties.
Further Research
To explore and investigate the underlying causes of attitude variation, consideration has been given to using focus groups. It is thought that by measuring the student’s attitude more fre-quently, a pattern of fluctuations in attitude may be discerned.
The PATT strategy described in this paper has recently evolved to include a fifth element: Link. Link involves showing students how the content of the modules relates to a broader body of knowledge within the IS discipline. Guest information systems lecturers who are experts in their fields present mini-lectures to the students. For example, a network/telecommunications expert presents current trends and issues in the field of wireless communications as part of the study module on Network and Communications. As well as reducing course leader’s workload, this is an opportunity to showcase the expertise of IS staff that business students would not normally have the opportunity to experience unless they selected an IS major. Hopefully, this will ensure that every business student realizes that IS plays an integral part in their future careers, regardless of their area of interest.
Conclusion
Educa-tors will only be able to connect with the Y Generation by taking into account the characteristics which set these students apart from the Older Generation students.
References
ABS. (2001). Australian Bureau of Statistics: 2001 Census Basic Community Profile and Snapshot. Re-trieved 19 November, 2003, from
http://www.abs.gov.au/Ausstats/abs%40.nsf/46d1bc47ac9d0c7bca256c470025ff87/0d7dc5fe918eb e65ca256d420082e3b3!OpenDocument
AMP NATSEM. (2003, November 2003). Income and Wealth of Generation X: Generation Xcluded. Na-tional Centre for Social and Economic Modelling (NATSEM). Retrieved 18 November, 2003, from
http://www.amp.com.au/au/3column/0,2338,CH5273,00.html
Bates, A. (1994). Educational multimedia in a networked society. Paper presented at the World Conference
on Educational Multimedia, Vancouver.
Bragg, D. D. E. (1992). Alternative approaches to outcomes assessment for postsecondary vocational edu-cation. Berkeley: University of California at Berkeley, National Centre for Research in Vocational Education.
Bryant, K., Campbell, J. A., & Kerr, D. (2001). Flexible learning and academic performance in information systems. Paper presented at the 12th Australian Conference on Information Systems, Coffs Harbour, NSW.
Coakes, S. J., & Steed, L. G. (1996). SPSS for Windows: Analysis without anguish: Jacaranda Wiley. Cullen, M., Harriott, V., Knox, S., Whelan, M., Saenger, H., & Brooks, L. (1996). The effect of gender, age
and prior achievement in determining success in an environmental sciences course. Retrieved, from
http://www.herdsa.org.au/confs/1996/cullen.html
Flanagan, R. (2003, 24 Jan). Are you a new age manager? The Scotsman.
Grauer, R. T., & Barber, M. (1999). Exploring Microsoft Office 2000 Professional, Vol 1. New Jersey: Prentice Hall.
Hanlon, T. L., & Thomas, C. (1999, 11 June 2002). Integrating environmental science and the humanities
through team teaching. Ferrum College. Retrieved 10 November, 2003, from
http://www.ferrum.edu/thanlon/ecology/teamteach.htm
Low, E. K., Genrich, R., & Cater-Steel, A. (2001). A strategy to overcome challenges in teaching an intro-ductory MIS course. Paper presented at the Proceedings of 16th Annual Conference of the
Interna-tional Academy for Information Management, New Orleans.
Low, E. K., Genrich, R., Cater-Steel, A., & Roberts, D. (2002). Understanding and managing expectations of foundation MIS students. Paper presented at the Proceedings of 17th Annual Conference of the
In-ternational Academy for Information Management, Barcelona.
Lynch, J., & Collins, F. (2001, Dec). From the horse's mouth: Factors inhibiting and driving innovation in ICT education. Paper presented at the Australian Association for Research in Education, Fremantle, WA.
McCaslin, N. L. (1995). Evaluation: An imperative for public education and training programs. Dept of Agricultural Education, Ohio State University, Columbus.
Moran, L. (1996). Quality guidelines for resource-based learning: Working party on resource-based learn-ing, National Council for Open and Distance Education.
Murdoch University. (1998). Survey of first year students at Murdoch University, 1998. Retrieved, from
http://www.tlc.murdoch.edu.au/eddev/evaluation/firstyear/environment.html
Neuborne, E., & Kerwin, K. (1999, 15 Feb). Generation Y. Retrieved 5 May, 2003, from
Northeast Missouri State University. (1984). In pursuit of degrees with integrity: A value added approach
to undergraduate assessment. Washington, DC: American Association of State Colleges and
Universi-ties.
Nunan, T. (1996). Flexible delivery - What is it and why is it part of current educational debate? Paper pre-sented at the Higher Education Research and Development Society of Australasia Annual Conference, Perth, Western Australia.
Roberts, D. (1991). Attitudes of pre-service teachers to computers. MSc Dissertation. Curtin University, Perth, Western Australia.
Schwarzer, D., Kahn, R. E., & Smart, K. (2000). Learning contracts and team teaching in a university ESL writing class. The Internet TESL Journal, VI (10).
Shelly, G. B., Cashman, T. J., Vermaat, M. E., & Walker, T. J. (2000). Discovering computers 2001:
Con-cepts for a connected world. Cambridge, MA: International Thomson.
Siegel, S. (1956). Nonparametric statistics: For the behavioral sciences. Tokyo: McGraw-Hill.
Sirkemaa, S. (2003, June). Learning environment in the digital age: Supporting the student. Retrieved 10 November, 2003, from http://ecommerce.lebow.drexel.edu/eli/2003Proceedings/docs/020Sirke.pdf
Sweetman, T. (2003, 05Jan2003). A generation of spoilt brats. The Sunday Mail Qld.
Walsh, K. (2002, 29 Dec). Meet Generation Y – Young, self-absorbed and bred for success. The Sunday Mail Qld.
Webster, J., & Martocchio, J. J. (1992). Microcomputer playfulness: development of a measure with work-place implications. MIS Quarterly, 16(2), 201-226.
Wheeler, P., & Haertel, G. D. (1993). Resources handbook on performance assessment and measurement: A tool for students, practitioners, and policy makers. Berkeley, CA: The Owl Press.
Wolburg, J., & Pokrywczynski, J. (2001). A psychographic analysis of Generation Y college students.
Journal of Advertising Research, 41 (5).
Zmud, R. W., & Boynton, A. C. (1991). Survey measures and instruments in MIS: Inventory and appraisal. In K. Kraemer (Ed.), The Information Systems Research Challenge: Survey Research Methods (pp. 149-180). Boston: Harvard Business School.
Biographies
The authors are lecturers of the Department of Information Systems in the Faculty of Business at the University of Southern Queensland.
Rohan Genrich is currently the course leader for Introduction to Computing, which is the foun-dation computing course for the Faculty of Business. He holds a M.Ed, a GradDip in Secondary Education and a Bachelor’s degree in computing. Currently he is undertaking a Master of Infor-mation Technology, researching students’ computing anxiety and self-efficacy.
Dave Roberts is currently the Head of the Information Systems Department. He teaches mainly in the areas of systems analysis and design, as well as supervising postgraduate research students. Dave holds a M.AppSc which focused on students’ attitudes towards using computers. For the last 14 years, he has organized the Australian Computing Society’s (ACS) computer competition. He selects and trains teams to represent Australia at the South-East Asian Regional Computer Confederation (SEARCC) programming competition. Dave is currently completing a PhD in the area of adoption of software upgrades.
![Table 2: Comparison of means: perceived knowledge, frequency of use, attitude towards using computers, level of previous computing studies, and academic performance [* significant at .05]](https://thumb-us.123doks.com/thumbv2/123dok_us/340876.65738/8.612.110.538.459.596/comparison-perceived-knowledge-frequency-computers-computing-performance-significant.webp)
![Table 3: Comparison of means: gender, school type, computer ownership, formal computing studies [* significant at .05]](https://thumb-us.123doks.com/thumbv2/123dok_us/340876.65738/9.612.72.506.551.720/table-comparison-gender-computer-ownership-computing-studies-significant.webp)


