I
NFORMATION
Q
UALITY
F
UNCTION
D
EPLOYMENT
(Practice-Oriented)Latif Al-Hakim
University of Southern Queensland [email protected]
Abstract: This research maps the information quality (IQ) process and finds that the control constituent of the process comprises two types of factors: IQ dimensions and IQ indicators. The later forms an information performance measure known as ‘information orientation’ that measures the capability of an organisation to effectively manage and use information. It stressed that the consistency between the two types of factors will improve the IQ function. Based on a case study from the healthcare industry, the research employs a modified quality function deployment (QFD) procedure in an attempt to match IQ dimensions with the IQ indicators in order to identify the most important factors affecting the IQ function deployment. The research is in its initial stage and may include subjective results. However, the methodology used could be further enhanced for more impartial outcomes.
Key Words: Information quality, information orientation, QFD.
INTRODUCTION
Eighteen months after having a common bowel operation, an X-ray revealed a pair of 15cm surgical scissors, slightly opened, lodged between a patient's lower bowel and her spine. The hospital explained it did not count scissors after the surgery because they were considered too large to lose [25]. On another occasion, it was reported that two women with the same first name attended a hospital in the same day to have a breast biopsy. One had breast cancer. One did not. It was discovered that the biopsy results had been mixed up and the patient without breast cancer had endured months of chemotherapy and was minus a breast [25]. The woman with the breast cancer died after nine months. Though many factors contributed to these hospital errors, certainly one of these factors is related to quality of data or information that was received or generated. Poor information quality is not only prevalent in non-profit and business organisations, it can also be behind decisions at national or even international levels. Fisher and Kingma [7] reveal that one main factor behind the explosion of the NASA space shuttle Challenger on 28 January 1986, and the shooting of an Iranian Airbus by the US Navy Cruiser USS Vincennes on 3 July 1988, was poor quality information. This is also the case with the allegations, in 2003, regarding the existence of weapons of mass destruction in Iraq.
noted for using leading-edge technologies that enable better cures and new scientific discoveries but has been slow in adopting technologies that focus on information systems to enable better management and administrative needs [7, 28]. Mandke et al [21 - in 7] state that poor information quality is a major contributor to the large number of medical errors. Lorence and Jameson [19] conclude that the quality of information maintained by healthcare organisations becomes a critical factor in the ultimate delivery of care. These authors emphasise the need for more rigorous system-based quality assessment methodologies.
This paper identifies the dimensions of information quality (IQ) systems and attempts to match these dimensions with the information system (IS) performance indicators and measures. Based on a case study, the present paper uses quality function deployment (QFD) methodology with some modification. The research study is in its initial stage and may include subjective results. However, the methodology used could be further enhanced for more general outcomes.
INFORMATION QUALITY
Meade and Sarkis [24] emphasise that, in an agile environment, skills, knowledge and information are no longer enough for achieving or enhancing competitiveness when lacking the ability to convert the knowledge, skill and information into products. “Ability to convert” is what companies are really relying on to achieve customer satisfaction [2]. Such ability is the combined result of the two prerequisites of information process, that is, experience and technology. “Ability to convert” should be maintained via continual process improvement and learning. Wang [31] takes a step beyond the work of Meade and Sarkis, and finds an analogy between quality issues in product manufacturing and those in information manufacturing, and further asserts that information manufacturing can be viewed as processing system acting on raw data to produce information products. Wang urges organisations to manage information as they manage products if they want to increase productivity.
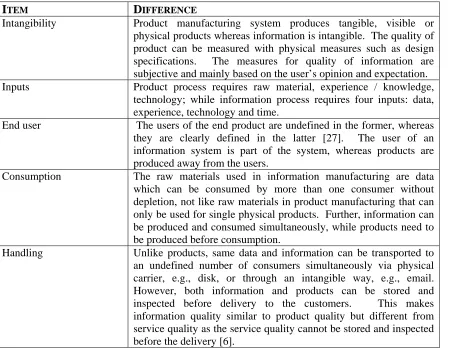
There are differences between product manufacturing and information manufacturing that can be classified under five main headings: intangibility, input, users, consumption and handling (Table 1). However, from the quality perspective, the differences listed in Table 1 will not affect the analogy proposed by Wang [31] between products and information.
Customers view quality in relation to differing criteria based on their individual roles in the production-marketing chain [6]. Thus it is important to understand the various perspectives from which IQ is viewed. Like product quality, information quality can be viewed by information consumers from various perspectives: as “fitness for intended use,” or as “meeting or exceeding customer expectations”. Sen [27] emphasises the importance of applying total quality management (TQM) to the production of information. Sen argues that the zero defects goal of TQM becomes particularly relevant to data and information producing entities to avoid undesired consequences. Based on the principles of TQM, Wang [31] and Huang et al. [13] address total data management quality (TDQM). Further, Wang et al. [30] emphasise the criticality of having tools and techniques to manage the life cycle of the information product and stress the importance of developing a mechanism for producing the Information Product Map (IPMap), just like a blueprint for an assembly line that produces a physical product. Wang et al. [32] introduce total information awareness. Further, Lee et al. [16] develop a methodology for IQ assessment and benchmarking considering IQ dimensions that covers aspects of IQ that are important to information consumers.
I
TEMD
IFFERENCEIntangibility Product manufacturing system produces tangible, visible or physical products whereas information is intangible. The quality of product can be measured with physical measures such as design specifications. The measures for quality of information are subjective and mainly based on the user’s opinion and expectation. Inputs Product process requires raw material, experience / knowledge,
technology; while information process requires four inputs: data, experience, technology and time.
End user The users of the end product are undefined in the former, whereas they are clearly defined in the latter [27]. The user of an information system is part of the system, whereas products are produced away from the users.
Consumption The raw materials used in information manufacturing are data which can be consumed by more than one consumer without depletion, not like raw materials in product manufacturing that can only be used for single physical products. Further, information can be produced and consumed simultaneously, while products need to be produced before consumption.
[image:3.612.70.520.121.469.2]Handling Unlike products, same data and information can be transported to an undefined number of consumers simultaneously via physical carrier, e.g., disk, or through an intangible way, e.g., email. However, both information and products can be stored and inspected before delivery to the customers. This makes information quality similar to product quality but different from service quality as the service quality cannot be stored and inspected before the delivery [6].
Table 1. Main differences between product manufacturing and information manufacturing.
IQ DIMENSIONS
Dimension’s Measures from Selected Literature
Dimension
Implication /
Definition*
Delone and McLean (1992)* - in [17]
Goodhue [10] Wang and Strong [33] Strong et al [29] Jarke and Vassiliou (1997)* - in [17] Intrinsic Information
has quality in its own right.
Accuracy, precision, reliability, freedom from bias. Accuracy, reliability. Accuracy, believability, reputation, objectivity. Accuracy, objectivity, believability, reputation. Believability, accuracy, credibility, consistency, completeness.
Contextual DQ must be
considered
within the context of the task. Importance, relevance, usefulness, content, completeness, currency, sufficiency. Currency, level of detail. Value-added, relevance, completeness, timeliness, appropriate amount. Relevancy, value added, timeliness, completeness, and amount of data.
Relevance, usage, timeliness, source, currency, data warehouse currency, non-volatility. Accessibility Useableness, quantitativeness, convenience of access. Accessibility, assistance, ease of use, location.
Accessibility, ease of operations, security. Accuracy and access security. Accessibility, system availability, transaction availability, privileges . Representation Information is interpretable, easy to understand and manipulate. Information is represented concisely and consistently. Understandability, readability, clarity, format, appearance, conciseness, uniqueness, comparability. Compatibility, meaning, presentation, lack of confusion Understandability, interpretability, concise representation, consistent representation, arrangement, readable, reasonable. Interpretability, ease of understanding, concise representation, consistent representation. Interpretability, syntax, version control, semantics, aliases, origin.
* Adopted from Lee et al. [17]
[image:4.612.77.753.83.399.2]# Adopted from Turban and Aronson [30].
IQ PROCESS
Langefors [15, p. 248 - in 20] formulates the process of obtaining information to be I= i(D, S, t), where I is the information obtained from the interpretation process i of data D, with pre-knowledge or user’s life experience S at a certain time t. According to Langefors, a certain set of Data could be interpreted differently by persons with different experiences or at different times. With the recent explosion of information technology, the absolute user’s experience in most business environments is no longer enough for the purpose of interpretation of data while relying on the developed technologies. Accordingly, data, experience, technology and time form prerequisites or inputs for information process. The formulation of Langefors [15], and the addition of technology to Longefors’s equation make information process definition more consistent with the requirement of product manufacturing systems if we consider the raw material in production to be equivalent to data in information systems. The constraints and environment required by the product system is part of the knowledge. In this regard, the information system requires additional input, that is, time.
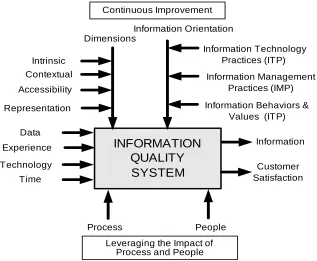
An IQ system, similar to other quality systems, has inputs and outputs. The inputs to an IQ system are the prerequisites for the information process: data, pre-knowledge and time. The output of an IQ system is information with the focus on customer satisfaction.
The IQ system involves the process of planning and administering the activities and functions necessary to achieve a high level of performance in the process of translating data into useful information. Process alone can not achieve the performance intended from the process without the involvement of employees. Goldman et al. [8] recognise the significance of employees as a company asset, and emphasise the importance of leveraging the impact of people and information for an agile enterprise. Evans and Lindsay [5] show direct correlation between employees’ satisfaction and customer satisfaction and argue that ‘people’ are the only organisation asset that “competitors cannot copy; and the only one that can synergize, that is, produce output whose value is greater than the sum of its parts”. Meade and Sarkis [22] state that people are the most valued resources. It follows that the mechanism which converts the input of an IQ system to its output, that is, customer satisfaction, includes two main constituents: process and people. In an analogy with agile enterprise dimensions of Goldman et al. [9], the leading mechanism for an IQ system is leveraging the impact of process and people.
To realise customer satisfaction, everyone should consider continuous process improvement as a key management practice [6]. As part of this strategy, process and people are no longer enough for achieving the required output without the continuously improved procedures, policies and regulations that control the conversion process.
The dimensions of IQ are useful in ensuring coverage of the IQ concepts. They comprise measures that are useful to scales and benchmark characteristics of information, but are not as useful for deciding what to do to improve IQ [16]. In other words, improving the quality of information requires identification of factors affecting information production process in addition to IQ dimensions. IQ improvement has, accordingly, two sets of elements. These are IQ dimensions and IQ factors. To be comprehensive, the IQ factors should measure the interaction of information users, information system outputs and technology. Factors significantly affecting the success of IQ systems are referred to as critical success factors.
referred to as ‘information orientation’ or (IO), which measures a company’s capabilities of effectively managing and using information [21]. However, the measures indicated by Marchand et al. is more useful at the macro analysis of the system and could be considered as an umbrella that may accommodate additional factors and measures at micro analysis of the system. The measures and indicators mentioned by Marchand et al could comprise further indicators and measures at the micro analysis level, and accordingly the work of Marchand et al. could be considered as an umbrella that accommodates the work of other researchers who studied factors affecting the information quality or information systems from the micro analysis viewpoint. For instance, the factors mentioned by Guynes and Vanecek [11] could be used as sub-factors to determine the ‘organisation’ measure of the IMP indicator in Marchand et al’s work. Table 2 illustrates the measures and indicators of Marchand et al. Figure 1 models the constituents of the IQ system environment.
INFORMATION
QUALITY
SYSTEM
People Process
Leveraging the Impact of Process and People Continuous Improvement
Dimensions
Data
Time Experience
Customer Satisfaction
Information Information Orientation
Information Technology Practices (ITP)
Information Management Practices (IMP)
Information Behaviors & Values (ITP) Accessibility
Contextual Intrinsic
Representation
[image:6.612.73.390.223.484.2]Technology
Figure 1. Environment of IQ system; input, output, mechanism and control.
Function Deployment (QFD) technique. QFD is a structured approach originated in 1977 at the Mitsubishi shipyard [6].
Q
UALITY
F
UNCTION
D
EPLOYMENT
(QFD)
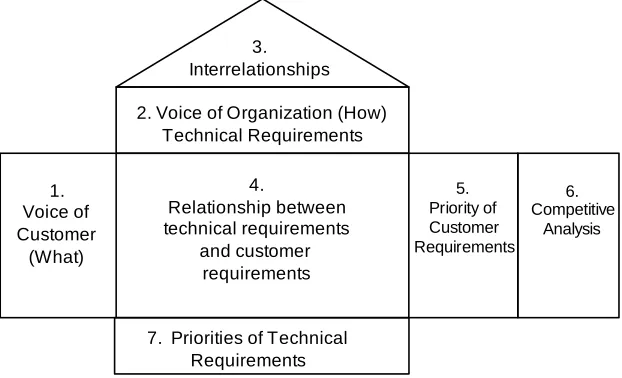
QFD is driven by what the customer wants and not just by technological innovation and is considered as a means translating the ‘voice of the customer’ into specific, measurable product and process characteristics [5, 12]. The matrix representing QFD is often called the ‘House of Quality’. The general format of the House of Quality matrix is made up of seven major components as shown in Figure 2.
3. Interrelationships
2. Voice of Organization (How) Technical Requirements
1. Voice of Customer
(What)
4.
Relationship between technical requirements
and customer requirements
6. Competitive
Analysis 5.
Priority of Customer Requirements
[image:7.612.90.401.219.408.2]7. Priorities of Technical Requirements
Figure 2. The House of Quality.
The QFD process is structured and could be iterated from macro to micro levels of analysis. The objective is to determine which technical requirements to deploy in order to meet customer requirements. However, the research follows a procedure which is different from the traditional one in constructing the house of quality, as illustrated in the pilot study.
CASE STUDY
Importance-performance analysis was first introduced by Martilla and James [23]. A gap
between the perceived performance and the expected importance of a dimension may provide
some indication about the criticality of the dimension [3].
One important issue that emerged during the discussion with the medical professionals was that the importance-performance gap difference for one dimension may not have the same weight for the same gap for another dimension, even though the two dimensions may have the same expectation rating. For instance, any gap difference for the ‘accuracy’ dimension is very costly in comparison to a wider gap for other highly important dimensions. To achieve an adequate weighting for the gap analysis, this research study considers a scale of multiples of 3, that is, 81, 27, 9, 3, and 1, to weight the gaps. The gap weighting of 81 should only be assigned to a dimension in which a gap is absolutely not acceptable. The gap weighting of a dimension represents the average of gap weightings assigned by respondents for the dimension. The total weighting of a dimension is equal to the product of the gap by its gap weighting. There was a suggestion to allocate more weighting to the ratings of medical professionals’ responses, but this suggestion was countered by the fact that most IT users are not medical professionals. Table 3 illustrates the responses of IT users in term of expectation, performance and gap weighting.
All IT users emphasised that the ‘accuracy’ dimension of the IQ system was absolutely important and had a weighting of 27 allocated for its gap. However, the users stated that the IT system generated some inaccurate information resulting mainly from data collection or incorrect input. The medical professionals emphasised that the ‘relevancy’, ‘completeness’ and ‘timeliness’ dimensions of IQ should be ranked as high as the ‘accuracy’ dimension. The IT users did not assign a high rating for ‘believability’, reputation’ and ‘objectivity’ dimensions because theses dimensions were already implied the integral framework of the ‘accuracy’, ‘relevance’, completeness’ and ‘timeliness’ dimensions. The ‘value-added’ dimension has a high rating with a high gap weighting. However, the IT users emphasised that this factor is a reflection of the association of ‘accuracy’, ‘relevancy’ and ‘timeliness’. This information will have a value when it is accurate, relevant, and not out of date. ‘Security’ is another dimension that receive a very high rating and gap weighting by IT users. Apparently, the IT users are not fully convinced that their IT system provides a very high security level equivalent to their expectation. Nurses and registry staffs stressed that accessibility and ease of operations were important dimensions and emphasised their gap weighting. All IT users emphasised the arrangement and consistency dimensions of the IT output. Registry staff pointed to some difficulties in interpreting the information. Other dimensions received less rating and weighting. Either they are implied in other dimensions, irrelevant to the interest of IT users such as ‘reasonable’ representation are or inapplicable such as with the readability dimension.
Table 3 indicates that the ‘security’ dimension is the highest concern of the IT users (with total weighting of 20.16), followed by ‘accuracy’. Other dimensions with high total weightings are ‘completeness’, ‘relevance’, ‘timeliness’ and added’ dimensions. Considering the issues related to the ‘value-added’ dimension stated above, this issue was dropped from further consideration.
Group Dimension
Importance Perfor
mance
Gap Gap weighting Total Weighting
Accuracy 10 9.13 0.7 27 18.9
Believability 7.5 7.5 0.00 7.5 0.00
Reputation 6.63 6.5 0.15 7.5 1.13
Intrinsic
Objectivity 7.63 6.75 0.88 8.25 7.26
Value-added 8 6.75 1.25 10.13 12.81
Relevance 9.13 8.38 0.75 20.25 15.9
Completeness 8.88 7.75 1.13 15.75 17.80 Contextual
timeliness 8.88 7.5 1.38 11.25 15.53
Accessibility 6.88 6.25 0.63 8.25 5.20 Ease of Operations 6.88 5.88 1.00 8.5 8.50 Accessibility
Security 9 7.88 1.12 18 20.16
Understandability 6.13 5.25 0.88 5.25 4.62 Interpretability 6.25 5.13 1.12 6.75 7.56
Concise 4.75 4.5 0.25 5.25 1.31
Consistent Representation
6.75 6.34 0.41 5.25 2.15
Arrangement 6.13 5.88 0.25 6 1.5
Readability 3.38 3.38 0.00 3.75 0.00
Representation
[image:9.612.60.447.69.411.2]Reasonable 2.5 2.5 0.00 3.85 0.00
Table 3. IT users’ responses on expectation, performance and gap weighting of IQ dimensions.
ITP IMP IBV
Dimension Measure Operational Process Innovatio
n
Management Sensing Collecting Organising Processing Maintaining Integrity Formality Control Sharing Transparency Proactiveness
Intrinsic Accuracy ● ● ◊ ● ◊ ◊
Relevance ● ● ◊ ◊
Completeness ● ○ ◊
Contextual
timeliness ● ○ ○ ◊
Accessibility Security ● ○ ◊ ○
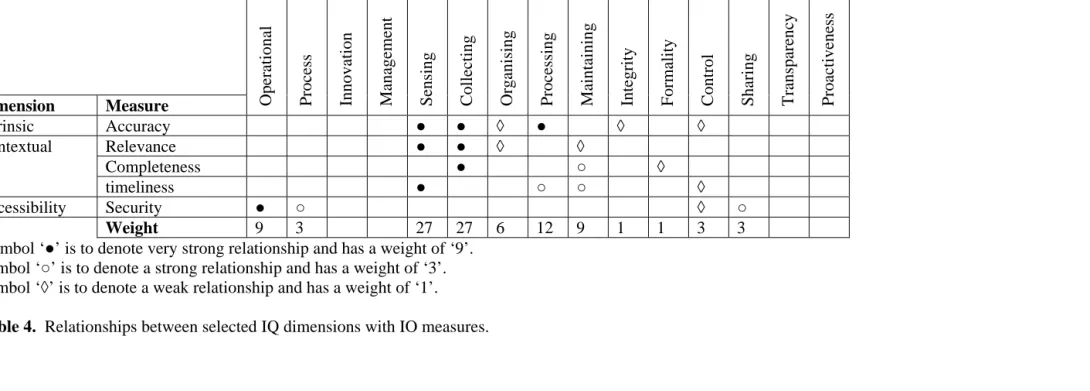
Weight 9 3 27 27 6 12 9 1 1 3 3 Symbol ‘●’ is to denote very strong relationship and has a weight of ‘9’.
[image:10.612.67.643.106.301.2]Symbol ‘○’ is to denote a strong relationship and has a weight of ‘3’. Symbol ‘◊’ is to denote a weak relationship and has a weight of ‘1’.
Table 4. Relationships between selected IQ dimensions with IO measures.
ITP IMP IBV
Weight - (Table 4) Process Innovatio
n
Management Organising Processing Integrity Formality Control Sharing Transparency Proactiveness
ITP Operational 9 ◊
Sensing 27 ○ ○ ● ◊ ◊ ● ● ◊
collecting 27 ◊ ◊ ● ◊ ●
Processing 12 ● ○ ○
IMP
Maintaining 9 ○ ○ ○ ○ ● ○
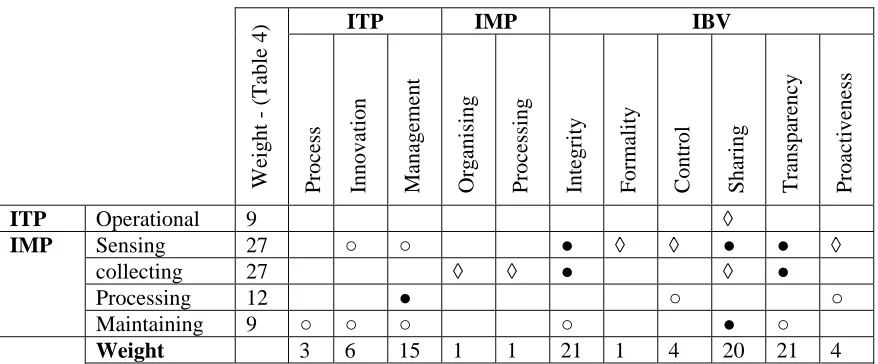
[image:11.612.85.524.81.263.2]Weight 3 6 15 1 1 21 1 4 20 21 4
Table 5. Relationships between various IO measures
Taking into consideration the weightings shown in Table 5, there only five IQ measures that have weightings of 20 or more. These measures are sensing, collecting, integrity, sharing and transparency. It can be argued that the hospital management should pay more attention to theses five IO measures in order to achieve an improved information quality.
The selection of the five IO measures requires more analysis at the micro analysis level. The next stage of this research is to consider the five IO measures as customer requirements and to attempt to allocate the technical requirements for these IO measures. This is part of the future study.
CONCLUSION
Information quality (IQ) becomes a critical issue of the hospitals’ strategies and their ultimate delivery of care. This research maps the IQ process and defines its four constituents: input, output, mechanism and control. The research identifies two types of factors affecting the IQ process. These are the IQ dimensions and IQ indicators. IQ dimensions are classified into four categories. These categories are contextual, intrinsic, accessibility and representation. IQ indicators form an information performance measure referred to as information orientation (IO) which measures an organisation’s capability of effectively managing and using information. IO is classified into three groups of indicators: information technology practices (ITP), information management practices (IMP) and information behaviours and values (IBV).
REFERENCES
[1] Abbott, J. “Data data everywhere- and not a byte of use?” Qualitative Market Research, 4(3). 2001. pp.182-192.
[2] Al-Hakim, L. “Web-based supply chain integration model.” In J. Mariga (Ed.), Managing e-commerce
and mobile computing technologies. Hershey, PA: IRM Press. 2003.
[3] Al-Hakim, L., and Xu, H. “On work alignment: Do IT professional think differently? In A. Sarmanto (Ed.), Issues of Human Computer Integration. Hershey, PA: IRM Press. 2004.
[4] Bedian, AG, and Zammuto, RF. Theory and Design. Dryton Chicago, IL., 1991.
[5] Bosset, JL. Quality Function Deployment. A Practitioner’s Approach. ASQC Quality Press, Milwaukee, WI., 1991.
[6] Evans, JR., and Lindsay, WM. The Management and Control of Quality, (5th edn). South-Western, Thomson Learning, Cincinnati: Ohio. 2002.
[7] Fadlalla, A., and Wickramasinghe, N. “An integrative framework for HIPAA-Compliant I*IQ healthcare information systems.” International Journal of Health Care Quality Assurance, 17(2). 2, 2004. pp.65-74.
[8] Fisher, CW., and Kingma, BR. “Criticality of data quality as exemplified in two disasters.”
Information & Management, 39. 2001. pp.109-116.
[9] Goldman, S.L., Nagel, R.N., and Preiss, K. Agile Competitors and Virtual Organisations, Strategies for Enriching the Customer. Von Nostrand Reinhold, NY., 1995.
[10] Goodhue, D.L. “Understanding user evaluations of information systems.” Management Science, 41(12). 1995. pp.1827-1844.
[11] Guynes, C., and Vanecek, M. “Critical success factors in data management.” Information & Management, 30(4). 1996. pp.201-209.
[12] Han, SB, Chen, SK., and Sodhi, MS. “A conceptual QFD planing model.” International Journal of Quality & Reliability Management, 18(8). 2001. pp.796-812.
[13] Huang, K-T., Lee, Y.W., & Wang, R.Y. Quality information and knowledge. Prentice-Hall PTR. NJ., 1999.
[14] Jiang, JJ., Klien, G., Roan, J., and Lin, JTM. “IS service performance: self-perceptions and user perceptions.” Information & Management, 38(8). 2001. pp.499-509.
[15] Langefors, B. Theoretical Analysis of Information Systems, (4th edn). Studentlitteratur: Lund. 1973. [16] Li, N.Y., Tan, K.C., and Xie, M. “Factor analysis of service quality dimension shifts in the information
age.” Managerial Auditing Journal, 18(4). 2003. pp.297-302.
[17] Lee, W.Y, Strong, D.M., Beverly, K., & Wang, R.Y. “AIMQ: A methodology for information quality assessment.” Information & Management, 40(2), 2002. pp.133-146.
[18] Linberg, KR. “Software developer perception about software project failure: a case study.” Journal of Systems and Software, 49. 1999. pp.177-192.
[19] Lorence, DP., and Jameson, R. “Adoption of information quality management practices in US healthcare organisations: a national assessment.” International Journal of Quality & Reliability Management, 19(6). 2002. pp. 737-756.
[20] Malmsjo, A., and Ovelius, E. “Factors that induce change in information systems.” Systems Research and Behavioral Science, 20. 2003. pp.243-253.
[21] Mandke, V., Bariff, M., and Nayat, M. “Demand for information integrity in healthcare management.” Proceedings, The Hospital of the Future Conference. 2003.
[22] Marchand, DA., Kettinger, WJ., and Rollins, JD. “Information orientation: people, technology and the bottom line.” Sloan Management Review, Summer 2000, pp.69-79.
[23] Martilla, J.A., and James, J.C. “Importance-performance analysis” Journal of Marketing, 41, pp. 77-79.
[24] Meade, L.M., and Sarkis, J. “Analyzing organisational project alternatives for agile manufacturing processes: An analytical network approach.” International Journal of Production Research, 37(2). 1999. pp.241-261.
[26] Rampersad, H. “75 painful questions about your customer satisfaction.” The TQM Magazine, 13(5). 2001. pp.341-347.
[27] Sen, K. “Does the measure of information quality influence survival bias?” International Journal of Quality and Reliability Management, 18(9). 2001. pp.967-981.
[28] Stegwee, R., and Spil, T. Strategies for Healthcare Information Systems. Idea Group Publishing, Hershey, PA., 2001
[29] Strong, D.M., Lee, Y.W., and Wang, R.Y. “Data quality on context.” Communication of the ACM, 40(5). 1997. pp.103-110.
[30] Turban, E., & Aronson, J.E. Decision support systems and intelligent systems (3rd ed.). Upper Saddle River, Prentice-Hall, Inc. NJ., 2001.
[31] Wang, R.Y. “A product perspective on total data quality management.” Communications of the ACM, 41(2), 1998. pp.58-65.
[32] Wang, RY, Allen, T, Wesley, H, and Madrick, S. “An information product approach for total information awareness.” IEEE Aerospace Conference. 2003. Via http://web.mit.edu/tdqm/www/publications.shtml. Viewed on 1 June 2004.
[33] Wang, R.Y., and Strong, D.M. “Beyond accuracy: What data quality means to data consumers.”
Journal of Management Information Systems, 12(4). 1996. pp. 5-34.