arXiv:0907.0286v1 [astro-ph.SR] 2 Jul 2009
The chromospheric emission of solar-type stars in the
young open clusters IC 2391 and IC 2602
S. C. Marsden,
1,2⋆, B. D. Carter
2⋆and J.-F. Donati
3⋆1Anglo-Australian Observatory, PO Box 296, Epping, NSW 1710, Australia
2Faculty of Sciences, University of Southern Queensland, Toowoomba, QLD 4350, Australia 3Laboratoire d’Astrophysique, Observatoire Midi-Pyr´en´ees, F-31400 Toulouse, France
ABSTRACT
In this paper we present chromospheric emission levels of the solar-type stars in the young open clusters IC 2391 and IC 2602. High resolution spectroscopic data were obtained for over 50 F, G, and K stars from these clusters over several observing campaigns using the University College London Echelle Spectrograph on the 3.9-m Anglo-Australian Telescope. Unlike older clusters, the majority (28/52) of the solar-type stars in the two clusters are rapid-rotators (vsini > 20 km s−1) with five of
the stars being classified as ultra-rapid rotators (vsini>100 km s−1). The emission
levels in the Calcium infrared triplet lines were then used as a measure of the chro-mospheric activity of the stars. When plotted against Rossby number (NR) the star’s chromospheric emission levels show a plateau in the emission for Log(NR)
∼
<-1.1
in-dicating chromospheric saturation similar to the coronal saturation seen in previously observed X-ray emission from the same stars. However, unlike the coronal emission, the chromospheric emission of the stars show little evidence of a reduction in emission (i.e. supersaturation) for the ultra-rapid rotators in the clusters. Thus we believe that coronal supersaturation is not the result of an overall decrease in magnetic dynamo efficiency for ultra-rapid rotators.
Key words: stars : rotation – stars : activity – stars : late-type – open clusters and associations: individual: IC 2391, IC 2602
1 INTRODUCTION
Solar-type stars of spectral types F, G and K arrive on the ZeAge Main-Sequence (ZAMS) with a wide range of ro-tation rates, with many stars experiencing extremely rapid rotation (projected rotational velocities,vsinivalues, of 200 km s−1 or more). As angular momentum loss is believed to be dependent upon the rotation rate of a star through magnetic braking (e.g. Mestel & Spruit 1987), such rapid rotators pose something of a problem as such stars should lose angular momentum much faster than they appear to do.
In order to account for these rapid rotators, dynamo theories of young solar-type stars have used dynamo satu-ration to slow the angular momentum loss of rapidly rotat-ing stars (e.g. Irwin et al. 2007; Krishnamurthi et al. 1997; Barnes & Sofia 1996). Below a critical rotation rate (the sat-uration velocity) the strength of a star’s magnetic dynamo is believed to be related to the star’s rotation rate. How-ever, for stars rotating more rapidly than this it is theorised
⋆
Email: [email protected] (SCM); [email protected] (BDC); [email protected] (J-FD)
that the strength of the star’s magnetic dynamo is no longer dependent upon stellar rotation. As a result, the loss rate of angular momentum due to magnetic braking should not increase for solar-type stars with rotation rates greater than the saturation velocity.
The main observational evidence for dynamo saturation comes from the coronal X-ray emission (LX/Lbol, the star’s X-ray luminosity divided by the star’s bolometric luminos-ity) of young solar-type stars. When Log(LX/Lbol) is plotted against a measure of rotation rate, such asvsini, it is seen to initially increase withvsiniuntil reaching a value of∼-3.0 when a plateau in emission level is observed for stars rotat-ing more rapidly thanvsini∼>20 km s−1. Such saturation is also seen in other activity indicators, such as Hαand Cal-cium emission (e.g. Soderblom et al. 1993) and this would appear to be consistent with the effect of dynamo satura-tion (Stauffer et al. 1997; Patten & Simon 1996). However, the mechanism causing this saturation (or even if it is dy-namo saturation) remains unknown.
Furthermore, for extremely rapid rotators (vsini∼>100 km s−1) the Log(L
effect has been dubbed supersaturation by Prosser et al. (1996b).
Although the mechanisms causing both saturation and supersaturation are yet to be determined, some sugges-tions have been put forward, such as centrifugal stripping (Jardine & Unruh 1999), and the complete filling of emit-ting regions (St¸epie´n, Schmitt, & Voges 2001). In order to better constrain both saturation and supersaturation ob-servationally we need to determine what activity indicators show signs of these effects and measure the rotational veloc-ities at which they occur (if at all).
The Calcium II emission of solar-type stars is an ex-cellent diagnostic of chromospheric emission. Traditionally the Ca II H and K resonance lines at 3968˚A and 3934˚A have been used as chromospheric diagnostics and have been employed by Noyes et al. (1984) to look at the relationship between chromospheric emission and rotation rate for solar-type field stars. However observations of the Ca II H and K lines of faint stars can be difficult, due to often low stel-lar flux in the blue, and the relatively poor blue response of many CCD detectors. In contrast, there have been sev-eral studies (e.g. Chmielewski 2000; James & Jeffries 1997; Soderblom et al. 1993; Foing et al. 1989; Linsky et al. 1979) involving the use of the Calcium II infrared triplet (IRT) lines at 8498˚A, 8542˚A, and 8662˚A, as chromospheric di-agnostics. These lines are strong and their location in the red makes them more suitable for CCD observations. The strongest of the IRT lines, the 8542˚A line, is relatively free from blends, and is largely uncontaminated by telluric lines, although Chmielewski (2000) shows that there is some small contamination in the wings of the 8542˚A line, but not the core. The IRT lines have the same upper levels as the Ca II H and K resonance lines, but the lower levels are populated radiatively and are not collisionally controlled like the H and K lines (Mallik 1997).
Chromospheric emission in the 8542˚A line has previ-ously been studied by Soderblom et al. (1993) (with the data also presented in Krishnamurthi et al. 1998) for young solar-type stars in the Pleiades cluster (age 130±20 Myrs; Barrado y Navascu´es, Stauffer, & Jayawardhana 2004) and by James & Jeffries (1997) for the intermediate-age (∼220 Myrs) open cluster NGC 6475. Both results show chromo-spheric saturation occurring in the rapidly rotating stars with a saturation level in the 8542˚A line of Log(R′
8542) ∼ -4.2, where R′
8542 is the flux in the 8542˚A line divided by the star’s total bolometric luminosity, see § 5.4. However, due to the lack of ultra-rapid rotators in both these stud-ies, there is no way of telling if the chromospheric emission shows evidence of supersaturation akin to that of the X-ray data. To further the results of Soderblom et al. (1993) and James & Jeffries (1997) this paper determines the chromo-spheric emission in the Calcium II infrared triplet lines for the solar-type stars in two younger clusters (IC 2391 and IC 2602) containing a higher proportion of rapidly rotating stars, including a number in the supersaturation regime.
2 THE OPEN CLUSTERS IC 2391 AND IC 2602
The young open clusters IC 2391 and IC 2602 are both southern targets located near the galactic plane. Their
HIP-PARCOS distances of ∼145 pc (van Leeuwen 1999) makes them among the closest young open clusters.
The age of the two clusters is given by Stauffer et al. (1997) as 30±5 Myrs. This age is based on both compar-isons to evolutionary isochrones as well as the upper main-sequence turnoff age of the clusters. More recent work by Barrado y Navascu´es et al. (2004) has given an age for IC 2391 of 50 ± 5 Myrs, based on the lithium depletion of fainter members of the cluster. This has yet to be done for IC 2602.
Given the ages of these two clusters the solar-type stars in IC 2391 and IC 2602 should be on, or in the last phase of evolving to, the ZAMS. At this age, the solar-type stars should not have undergone any significant magnetic braking and thus show a large range of rotational velocities including some stars with ultra-rapid rotation rates (vsini ∼>100 km s−1) placing them within the supersaturation regime. This makes IC 2391 and IC 2602 ideal targets for the study of saturation and supersaturation.
Photometric work on IC 2602 was done by Braes (1962) and Whiteoak (1961), while similar observations were un-dertaken for IC 2391 by Hogg (1960), Buscombe (1965), Perry & Hill (1969), and Perry & Bond (1969) among oth-ers. In the past decade or so there has been renewed interest in these two clusters with ROSAT X-ray obser-vations (Randich et al. 1995; Patten & Simon 1996) along with XMM-Newton observations (Marino et al. 2005), as well as a spectroscopic survey by Stauffer et al. (1997) and rotation period determinations for a number of IC 2602 stars by Barnes et al. (1999) and for some IC 2391 stars by Patten & Simon (1996).
The metallicities of the two clusters has been deter-mined by Randich et al. (2001) and D’Orazi & Randich (2009) to be close to solar with [Fe/H] = 0.00 ±0.01 and [Fe/H] = -0.01±0.02 for IC 2602 and IC 2391 respectively. The designations of the cluster stars used throughout this paper are as follows. For IC 2391, VXR: designation from Patten & Simon (1996), H: from Hogg (1960), L: from Lyng ˙a (1961), and SHJM: from Stauffer et al. (1989). For IC 2602, R: designation from Randich et al. (1995), B: from Braes (1962), and W: from Whiteoak (1961). Many of the stars have multiple designations and where possible the des-ignations from Patten & Simon (1996) and Randich et al. (1995) have been used for the stars in IC 2391 and IC 2602 respectively.
For stars in IC 2391 the quoted photometry is from Patten & Simon (1996), Lyng ˙a (1961), Hogg (1960), and Stauffer et al. (1989). The rotational periods are from Patten & Simon (1996) and the previousvsini val-ues are from Stauffer et al. (1989) and Stauffer et al. (1997). For IC 2602 the photometry is taken from Prosser, Randich & Stauffer (1996a), Randich et al. (1995), and Barnes et al. (1999). The rotational periods are from Barnes et al. (1999) and the previousvsinivalues are from Stauffer et al. (1997).
Because of the similarities between the two clusters, in age, distance, metallicity, etc., and the relative paucity of stars in the clusters (compared to say the Pleiades), IC 2391 and IC 2602 are treated as one cluster. We present the results from both clusters together, although stars from each cluster are represented by different symbols.
positions, colours, etc., for the stars in the two clusters can be found in the WEBDA database1.
3 SELECTION OF TARGETS
Potential members of IC 2602 were identified by Randich et al. (1995) from ROSAT X-ray data, with a num-ber of active low-mass candidate memnum-bers of the cluster found. A similar approach was taken by Patten & Simon (1996) for the members of IC 2391. Prosser et al. (1996b) and Stauffer et al. (1997) then carried out photometric and spectroscopic confirmation of membership studies (along withvsini measurements), and a list of active low-mass members of the clusters was produced. The listing that Stauffer et al. (1997) gives for IC 2391 is not as complete as that given by Patten & Simon (1996) so we have added some of the Patten & Simon (1996) stars to the list of potential members. This list is still not a complete census of the solar-type members in the two clusters, because, as Stauffer et al. (1997) points out, in neither cluster does the ROSAT sur-vey used to determine membership cover the entire area of the sky over which cluster members are likely to occur. Stauffer et al. (1997) argue that although the list is incom-plete it should not be overly biased (towards active stars) by the selection process (using X-ray emission to determine membership) for at least the G dwarfs in the two clusters. For the K dwarfs they believe that any bias should not be a large effect. A more comprehensive explanation of their selection process along with estimates of the completeness of the sample is given in Stauffer et al. (1997).
To the Stauffer et al. (1997) list (along with additional stars from Patten & Simon (1996)), we have added further stars from the Braes (1962) and Whiteoak (1961) photomet-ric studies of IC 2602, as well as some IC 2391 stars from Hogg (1960), Lyng ˙a (1961), and Stauffer et al. (1989), again not observed by Stauffer et al. (1997). The IC 2602 photo-metric studies by Braes (1962) and Whiteoak (1961) only went as deep as V ∼ 11, meaning that stars added to the list from these studies were predominantly late-F/early-G stars.
With the possible exception of the above mentioned ad-ditional stars, we believe that most of the stars in our target list should be cluster members. However a further member-ship determination was made based on radial velocity and Lithium line strength, see§5.2.
For this study as many of the solar-type stars in our target list were observed as possible in the time available, without biasing the observations through colour selection effects. This was achieved with observations of all of the se-lected stars in both IC 2391 and IC 2602 with 0.4≤(V-IC)0
≤1.4, corresponding to∼early-F to∼mid-K stars. Due to time constraints and the wish not to bias the observations by only obtaining data on a few lower-mass stars, all stars with (V-IC)0 ∼> 1.4 were excluded. Thus the observations should constitute a relatively unbiased sample of solar-type stars from early-F through to mid-K. In IC 2391 32 stars were observed from the target list, while in IC 2602 51 stars were observed from the target list.
1 WEBDA database - http://www.univie.ac.at/webda/
A list of the stars with 0.4≤(V-IC)0≤1.4 observed in IC 2391 and IC 2602 are given in Tables 1 and 2 respectively.
4 OBSERVATIONS
The spectroscopic data for this project were collected over 3 separate observing campaigns at the 3.9-m Anglo-Australian Telescope (AAT) located at Siding Spring Observatory in New South Wales, Australia. The 3 observing runs consisted of 3, 3, and 2 nights in March 2000, January 2001, and Febru-ary 2001, respectively.
The spectroscopic data were obtained using the Uni-versity College London Echelle Spectrograph (UCLES). The detector used for the first two runs (March 2000 and January 2001) was the Deep Depletion MITLL3 CCD with 2048 × 4096 15µm square pixels. This chip was chosen for its excel-lent red response and low fringing. For the third run (Febru-ary 2001), the chip used was the lumogen coated MITLL2A CCD, again with 15µm square pixels. This chip does not have the improved red response of the MITLL3, however the MITLL3 chip was unavailable at the time.
Since both of the chips are larger than the unvignetted field of the UCLES camera, a smaller window format (2048 × 2896 pixels) was used to reduce read out time. Using the 31.6 gr/mm grating, 57 orders (#55 to #111) could be fitted onto the detector window. Only 49 (#63 to #111) were reduced (the remaining orders had little or no signal in them) giving full wavelength coverage from ∼5000˚A to ∼9000˚A. While the actual wavelength range varied slightly from run to run, this variation was minimal.
With a slit-width of ∼1 arcsecond the spectral reso-lution varied from ∼44,000 to∼46,000 during the 3 runs, giving a velocity resolution of∼6.8 km s−1 to∼6.5 km s−1. Several exposures were taken consecutively for each star and added together to improve the signal-to-noise and also in case cosmic rays affected the IRT lines. The raw frames were then reduced and converted into wavelength calibrated spectra using the ESpRIT (Echelle Spectra Reduction: an Interactive Tool) optimal extraction routines of Donati et al. (1997).
5 RESULTS
5.1 Measuring Rotational and Radial Velocities
The major part of this study involves investigating the re-lationship between chromospheric activity and the rotation rates of solar-type stars in IC 2391 and IC 2602. Although many of the stars in the observation list have previousvsini
values measured by Stauffer et al. (1989, 1997), a number of stars still had none. To have a consistentvsinidetermination for the entire observation list, it was decided to re-determine the values ofvsiniof all the observed stars. In order to do this the Least-Squares Deconvolution (LSD) profiles for the stars were extracted from the spectrum of each star using the routines of Donati et al. (1997).
Table 1.
Table 2.
of the S/N in the 8542˚A line, depending on the spectral type of the star observed. The LSD profiles of three low activity stars of differing spectral types were also produced from the observations. These stars were HD 16673, αCen A, andα Cen B, with spectral types of F6V, G2V and K1V respec-tively.
Based on the colour of the target star an inactive star of similar spectral type was then rotationally broadened to match the target star’s LSD profile. Given the high S/N of the LSD profiles (from∼300 to∼900) the fit to the rotation-ally broadened profile could usurotation-ally be found to within±1 km s−1. This error is based on internal consistency within the method by observing the same star over several epochs. Thevsini values of α Cen A and α Cen B are given by Valenti & Fischer (2005) as 2.3 km s−1 and 0.9 km s−1 respectively. Given the instrumental resolution of the ob-servations (6.5 to 6.8 km s−1) we estimate that the lower vsinilimit we could determine for our stars was∼7 km s−1 when using α Cen A or B as a template. This is not the case for HD 16673. Thevsinivalue for this star is given by Nordstr¨om et al. (2004) as 8 km s−1. This means that for those stars using HD 16673 as a template the lowervsini
limit was 11 km s−1. However, no slowly-rotating stars de-termined to be cluster members used HD 16673 as a temple star. The LSD profile of one of the target stars and the fit to a rotationally broadened low activity star is given in Figure 1(a). A list of thevsinivalues for the observed stars, determined using this LSD method (along with comparisons to previous measurements) is given in Tables 1 and 2.
Using those single stars from Tables 1 and 2 that have previously had theirvsini values determined, the relation-ship between thevsinimeasured here using the LSD profiles and previous measurements (from Stauffer et al. 1989, 1997) was determined. This relationship is shown in Figure 2 and using a linear fit was found to be (with 1σerrors):
vsiniLSD= (1.04±0.03)×vsiniprevious−(1.34±1.63). (1)
Along with being a useful technique for the measure-ment of rotational broadening, the high S/N of the LSD profile also makes it a good way to determine if a star is a double-lined spectroscopic binary. Tables 1 and 2 also note those stars suspected of being double-lined binaries based on their LSD profiles. The LSD profile of one of these binaries is given as an example in Figure 1(b).
All single members of a cluster are expected to have a similar radial velocity. During the fitting of the LSD profiles of the inactive stars to the target stars in IC 2391 and IC 2602 we have also determined the radial velocity of our tar-get stars. These are heliocentric radial velocities which have then been shifted to match the centroid of the LSD profile of the telluric lines in each spectrum to account for any changes in temperature or pressure experienced by the spectrograph during the coarse of the observations. This should give a zero point error of∼ ±0.3 km s−1for both the target and inactive stars. Thus given an estimated error of∼ ±1 km s−1for the method we estimate that the radial velocity measurements are accurate to∼ ±1.5 km s−1. The radial velocities of the observed stars measured through this technique are again given in Tables 1 and 2. The mean and standard deviation of the radial velocities for the two clusters (measured from those stars given a M membership classification, see§ 5.2)
−100 −50 0 50 100
Velocity (km s−1)
0.92 0.94 0.96 0.98 1.00
Normalised Intensity (a)
−100 −50 0 50 100
Velocity (km s−1)
0.85 0.90 0.95 1.00
[image:6.612.304.542.99.432.2] [image:6.612.307.540.552.717.2]Normalised Intensity (b)
Figure 1.LSD profiles for (a) VXR66 (from IC 2391) and (b) R46 (from IC 2602). The profiles have been zeroed to (a) the radial velocity of VXR66, 15 km s−1and (b) the average cluster
velocity of IC 2602, 17.4 km s−1. The dashed line in (a) shows the
LSD profile of the inactive comparison star HD16673, rotationally broadened to match thevsiniof VXR66 (vsini= 52 km s−1). The
asymmetric bumps in the bottom of the LSD profile of VXR66 are most likely due to spots on the star’s photosphere. R46 is most likely a double-lined spectroscopic binary.
0 50 100 150 200
vsiniprevious (km s −1
) 0
50 100 150 200
vsin
iLSD
(km s
−1 )
Figure 2.Comparison ofvsinimeasurements for the stars in IC 2391 and IC 2602 (excluding those stars withvsini≤7 km s−1).
was found to be 15.9±0.7 km s−1 and 17.4±1.0 km s−1 for IC 2391 and IC 2602 respectively.
5.2 Cluster Membership
As mentioned in § 3, we believe that most of the stars in out target list should in fact be cluster members, based on previous selections. However, we have made a further deter-mination of the cluster membership based on the strength of the star’s Lithium 6708˚A line in our observations and our determination of the radial velocity of the star. The strength of the Lithium line was only determined approximately with respect to the strength of the nearby Ca 6717˚A line, and given as Strong, Weak, or None. A more detailed study of the Lithium in the two clusters has been undertaken by Randich et al. (1997), Randich (2001), and Randich et al. (2001).
Most of the single stars in Tables 1 and 2 with strong Lithium appear to have radial velocities around 16 km s−1 for IC 2391 and 17 km s−1 for IC 2602. Thus in order to qualify as a member of the cluster (M classification) stars have to be single (i.e. no evidence of a binary in their LSD profile), have strong Lithium, and have a radial velocity of 16 ±2 km s−1for IC 2391 stars and 17±2 km s−1for IC 2602. Stars which are classified as probable members (denoted by a ? classification) have a strong Lithium feature and are either binary or if single have a radial velocity of 16±9 km s−1for IC 2391 stars or 17±9 km s−1for IC 2602 stars. All other stars are classified as non-members (N classification). This membership is given in Tables 1 and 2. In our analysis of the chromospheric emission of the stars (§ 5.4) we have included all single stars with either M or ? classifications.
Since these observations there have been other determi-nations of cluster membership, such as that by Platais et al. (2007) for IC 2391. The membership list of Platais et al. (2007) contains a number of new IC 2391 members not con-tained in our list, however this was published too late for our study. The Platais et al. (2007) list also has member-ship determinations for the stars in our list. The determi-nation of membership agrees reasonably well with our list. In addition, Platais et al. (2007) list several IC 2391 stars as single-lined spectroscopic binaries that we treat as single, however, the contribution from the secondary to the chro-mospheric emission should be minimal so we have included them. Table 3 gives a list of differences between our designa-tions and that of Platais et al. (2007). Stauffer et al. (1997) list the star R80 (IC 2602) as a possible non-member. Based on our measurement of its radial velocity and Lithium we feel it is consistent with membership, and hence we have included it as such.
5.3 Stellar Parameters
[image:7.612.330.518.153.356.2]The effective temperatures of the stars given in Tables 1 and 2 were calculated from (V-IC)0 colours and the colour vs. Teff relationships of Bessell, Castelli & Plez (1998). If no (V-IC)0 measurement was available for the star then (B-V)0 was used. The (V-IC) and (B-V) values were converted to unreddened values by using the reddening parameters for the clusters. E(B-V) = 0.04 for IC 2602 from Braes (1961) and E(B-V) = 0.006 (rounded to 0.01) for IC 2391 from
Table 3.List of differences in determination of cluster member-ship and binarity between our work and Platais et al. (2007) for the solar-type stars IC 2391. M: cluster member, N:, non-member, ?: probable member, B: Binary.
Star Our Platais et al. (2007)
Name designation designation
L32 M M + B
VXR02B N M
VXR05 ? + B M + B
VXR07 ? M + B
VXR08 N M + B
VXR11 ? + B M + B
VXR30 N M + B
VXR31 ? N
VXR35A M ?
VXR44 ? M + B
VXR45A M ?
VXR50A ? N
VXR52 M M + B
VXR62A ? M
VXR67A ? M + B
VXR70 ? M
VXR78 ? N
Patten & Simon (1996). The E(V-IC) values for the two clusters were found by multiplying the E(B-V) values by 1.25 as given in Pinsonneault et al. (1998), thus giving val-ues of E(V-IC) = 0.05 and E(V-IC) = 0.0075 (rounded to 0.01) for IC 2602 and IC 2391 respectively.
The luminosities of the target stars were calculated from:
Mbol= BCI+ I = 4.74−2.5log( L L⊙
) (2)
where 4.74 is the Mbol for the Sun (Bessell et al. 1998) and BCIis the bolometric correction in the I band calculated us-ing Bessel & Strus-ingfellow (1993). The distance moduli used for the clusters were 5.82 and 5.81 for IC 2391 and IC 2602 respectively taken from the HIPPARCOS distances of van Leeuwen (1999). If no (V-IC)0 value was available then:
Mbol= BCV+ V (3)
was used instead, with the BCV calculated from Bessell et al. (1998).
Masses of the observed stars were estimated from D’Antona & Mazzitelli (1997) isochrones to the nearest 0.1 solar mass (see Figure 3). Radii were then calculated from Equation 2 and:
Mbol= 4.74−2.5log( T4
effR2 T4
eff⊙R2⊙
) (4)
5.4 Measuring Chromospheric Emission
3.85 3.80 3.75 3.70 3.65 3.60 Log(Teff) [K]
-1.0 -0.5 0.0 0.5 1.0 Log(L/L O • ) L32 02A 03A 07 12 14 22A 31 35A 44 45A 50A 52 62A 66 69A 70 72 76A 77A 78 80A 16A 67A (a)
3.85 3.80 3.75 3.70 3.65 3.60
Log(Teff) [K]
[image:8.612.42.281.75.433.2]-1.0 -0.5 0.0 0.5 1.0 Log(L/L O • ) 1 7 8A 10 15A 29 35 42C 43 45A58 59 66 68 70 72 79 80 83 85 88A 92 95A 96 14 52 89 W79 (b)
Figure 3. Evolutionary plots for the stars in (a) IC 2391 and (b) IC 2602. Only those stars which we determined as single and either classified as a member or a probable member (i.e. M or ? in Tables 1 and 2) have been included. The VXR and R has been removed from the star name. Evolutionary tracks and Isochrones of D’Antona & Mazzitelli (1997) are shown. The solid lines are evolutionary tracks for 0.8 M⊙ to 1.5 M⊙ (with the thick line
representing 1.0 M⊙). The dashed lines are age isochrones for 1,
10, 20, 30, 50, and 100 Myrs (with the thick dashed line repre-senting 30 Myrs).
were first removed from both the target and inactive star spectra.
As mentioned previously there have been several stud-ies involving the use of the IRT lines as chromospheric di-agnostics, however the studies have adopted slightly differ-ent methods of determining the chromospheric activity of the stars, employing various bandwidths to measure chro-mospheric emission. The method we have adopted is that used by Soderblom et al. (1993) in their measurement of the 8542˚A line of solar-type stars in the Pleiades, whereby the chromospheric emission is calculated from the emission pro-file of the star.
For all three of the IRT lines the spectrum of an in-active star of similar spectral type was rotationally broad-ened to match that of the target star. The inactive star’s spectrum was then shifted to match the radial velocity of the target star and was fitted to the target star’s spectrum by matching the wings of the IRT line being examined, as the chromospheric emission should be limited to the core of
8530 8535 8540 8545 8550 8555
Wavelength (Å) −1.5 −1.0 −0.5 0.0 0.5 1.0 1.5 Intensity
Figure 4.The emission profile for the 8542˚A line of R89 (IC 2602). The dashed line is the fitted inactive star (αCen B in this case) rotationally broadened to match the target star. The emis-sion profile (Target - Inactive) is shown shifted by -1.0 for display purposes. The shaded area is the measured emission equivalent width.
8490 8495 8500
0.0 0.2 0.4 0.6 0.8 1.0 1.2 Normalised Intensity 8498Å R15A VXR12 R92 VXR52 8540 8545 Wavelength (Å) 8542Å
8660 8665 8670
[image:8.612.305.542.98.264.2]8662Å
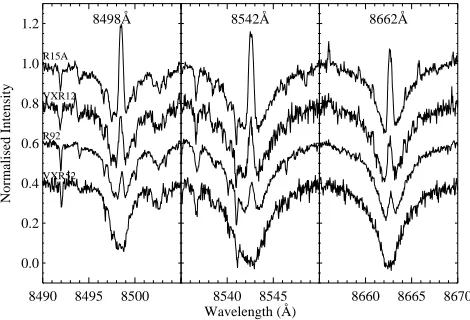
Figure 5.Examples of the Calcium infrared triplet lines for stars of decreasing activity. The stars were chosen to have similarvsini
values and the profiles have been shifted down in 0.2 steps for display purposes.
the lines. The spectrum of the inactive star was then sub-tracted from the target star to produce an emission profile. To measure the chromospheric emission from the IRT lines, the area under the emission profile was calculated to pro-duce an emission equivalent width. The process is outlined in Figure 4 for the 8542˚A line while Figure 5 gives exam-ples of the emission in the IRT lines for a sample of stars of differing activity levels.
[image:8.612.307.542.358.518.2]αCen B (K1V). These stars have near solar-metallicity (HD 16773: [Fe/H] = -0.11, αCen A/B: [Fe/H] = 0.12 accord-ing to Nordstr¨om et al. (2004)). Although these inactive stars are not zero-age main-sequence stars (it is virtually impossible to get an inactive zero-age main-sequence star for comparison) the differences in surface gravity between these stars and those of IC 2391/2602 should have mini-mal effect on the chromospheric measurements, particularly for rapidly-rotating stars where rotational broadening will dominate the line profile.
To measure the chromospheric emission of the IRT lines we have determined the chromospheric emission ra-tio (R′
IRT) for each of the IRT lines. This gives the fraction of each star’s bolometric luminosity that is emitted from the chromosphere in the IRT line. This is analogous to the chromospheric emission ratio R′
HK derived from Ca II H and K observations described by Noyes et al. (1984), where the prime signifies that the photospheric emission has been removed. R′
8542, the chromospheric emission ratio in the 8542˚A line, has been used previously by Soderblom et al. (1993) and James & Jeffries (1997).
To calculate R′
IRT for each of the lines, the emission equivalent widths were first converted into the surface flux emitted by the IRT lines (F′
IRT). Using the effective tem-peratures of the target stars from Tables 1 and 2, the surface flux per ˚Angstrom was calculated for each star by interpo-lating between model atmospheres from Kurucz (1993). This was then multiplied by the star’s Emission Equivalent Width to give the surface flux in each of the IRT lines (F′
IRT). In order to remove the dependence of the surface flux upon the star’s colour, the chromospheric emission ratio in the IRT lines (R′
IRT) was then calculated for each star. This is de-fined as the ratio of the surface flux in the IRT line to the star’s total bolometric emission.
R′
IRT= F′IRT/σT4eff, (5)
with F′
IRTin W m−2 and Teff in K.
The chromospheric emission ratios, emission equivalent widths, and surface fluxes, for single members of the two clusters are given in Tables 4 and 5.
5.4.1 Errors in Chromospheric Emission Measures
Possible errors in the measurement of the chromospheric emission come from a number of sources; errors in the mea-surement of the emission equivalent width, errors in de-termination of effective temperature, a mismatching of the spectral-type of the inactive stars to that of the target stars, and lastly the intrinsic variability of the chromospheric emis-sion of the star’s themselves. Errors in effective temperature determinations of±100 K are likely to produce errors of less than 10% in the measurement of the chromospheric emission ratios, while Soderblom et al. (1993) found no perceptible differences in the infrared triplet lines of the inactive field stars they studied which cover a similar colour range to our data, thus a mismatch of the spectral-type of the inactive template star should have minimal effect of the results. Thus the most likely sources of error to affect our results are er-rors in the measuring of the emission equivalent width and the intrinsic variability of the stars themselves. Although Tables 1 and 2 show that multiple observations were taken
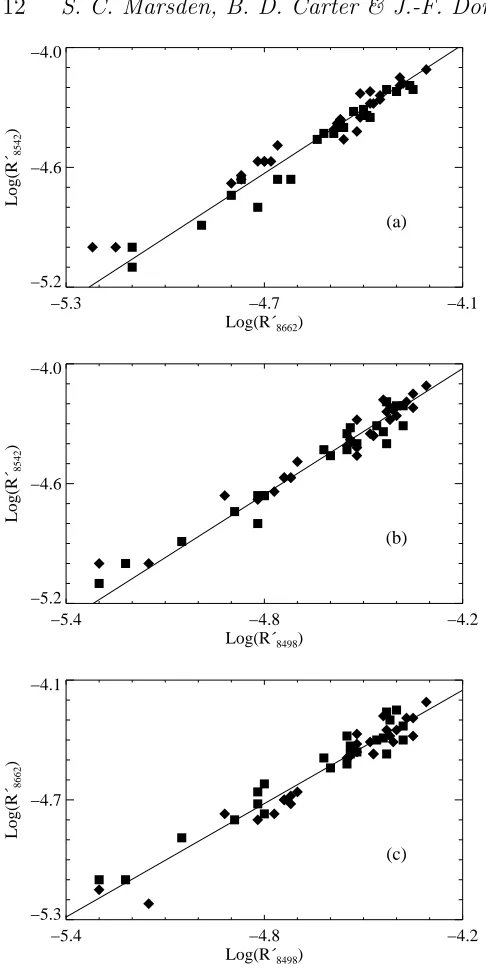
of each star these were mostly taken consecutively, so un-fortunately cannot be used to determine any measure of the intrinsic variability of the stars. In order to determine the error in the measurement of the emission equivalent width on the chromospheric emission ratios of these stars we have plotted a comparison of the chromospheric emission ratios for the three infrared triplet lines (see Figure 6). We have then fitted simple linear fits to the data and determined the following relationships:
Log(R′8542) = 1.07×Log(R ′
8662) + 0.42 (6)
Log(R′8542) = 1.05×Log(R ′
8498) + 0.40 (7)
Log(R′8662) = 0.95×Log(R′8498)−0.17 (8)
Looking at the scatter around these lines of best fit it can be seen that the error in Log(R′
8542) when plotted against Log(R′
8662), i.e. comparing the two strongest lines, is smaller for more active stars than for inactive stars and varies from<±0.1 for active stars up to∼ ±0.2 for the inac-tive stars in the sample. This error is actually a cumulainac-tive measure of the error in both of the lines plotted and thus the measurement error in each individual line is most likely less than this. However, taking into account possible errors in the effective temperature we believe that±0.1 is a rea-sonable estimate of the error in our Log(R′
IRT) values. An error of ±0.1 in Log(R′
IRT) appears to hold even for the ultra-rapid rotators in the clusters, however the fitting of the inactive star spectrum is difficult due to the rotationally broadened width of the chromospheric lines in these stars, and thus based on fitting errors we believe that the error in Log(R′
IRT) for the ultra-rapid rotators may be slightly higher than this at±0.15.
5.5 Activity versus Rotation
As mentioned previously the coronal X-ray emission of young active solar-type stars show a saturation of activity for rapid rotation, with the emission showing a further su-persaturation effect for ultra-rapid rotation. Figure 7 plots the Log of the coronal X-ray emission (divided by the star’s bolometric luminosity) and the Log of the chromospheric emission ratio for the strongest of the IRT lines, 8542˚A, againstvsini for the observed single stars in IC 2391 and IC 2602. The coronal X-ray data for IC 2391 and IC 2602 are taken from Patten & Simon (1996) and Stauffer et al. (1997) and were not taken simultaneously with the chorom-spheric results presented here. This means that variabil-ity and flaring may influence the scatter in these plots (and those in Figures 9 and 11). Thevsini values used in Figure 7 are those measured in this study. The coro-nal data for the Pleiades were taken from Stauffer et al. (1994) and Micela et al. (1999) while the chromospheric data were taken from Soderblom et al. (1993). For NGC 6475 both the coronal and chromospheric data were taken from James & Jeffries (1997).
Table 4.
Table 5.
−5.3 −4.7 −4.1 Log(R´8662)
−5.2 −4.6 −4.0
Log(R´
8542
)
(a)
−5.4 −4.8 −4.2
Log(R´8498)
−5.2 −4.6 −4.0
Log(R´
8542
)
(b)
−5.4 −4.8 −4.2
Log(R´8498)
−5.3 −4.7 −4.1
Log(R´
8662
)
(c)
Figure 6. Comparison of the chromospheric emission ra-tios for the three infrared triplet lines, (a) Log(R′
8542) vs
Log(R′
8662), (b) Log(R′8542) vs Log(R′8498), and (c) Log(R′8662)
vs Log(R′
8498). As in Figure 2, squares represent stars from IC
2391 and diamonds IC 2602. The lines are simple linear fits to the data and are given in Equations 6, 7, and 8.
The Log of the chromospheric emission ratio versusvsinifor these two lines is given in Figure 8.
Both the chromospheric (in all three of the IRT lines) and the coronal emission show a saturation for rapid rota-tors. The coronal emission shows supersaturation for ultra-rapid rotators. However, the chromospheric emission shows little (if any) decrease for the ultra-rapid rotators (although the 8662˚A line appears to show a possible slight decrease).
In order to remove both the uncertainty in the incli-nation angle as well as any mass dependency in the ve-locity at which saturation starts (the saturation veve-locity),
0 50 100 150 200 250 300
vsini (km s−1)
−5.0 −4.5 −4.0 −3.5 −3.0 −2.5
Log(L
X
/L
bol
)
(a)
0 50 100 150 200 250 300
vsini (km s−1)
−5.0 −4.5 −4.0
Log(R´
8542
)
[image:12.612.41.284.79.568.2](b)
Figure 7.(a) The Log of the coronal X-ray emission divided by the star’s bolometric luminosity and (b) the Log of the chro-mospheric emission ratio in the 8542˚A line, both versusvsini
for the observed single members of IC 2391 and IC 2602. Again squares represent stars from IC 2391 and diamonds IC 2602. Filled and open symbols represent stars with (V-IC)0 >0.6 and
(V-IC)0<0.6 respectively. Included in the plot are results from the Pleiades (crosses) and NGC 6475 (pluses). For (b) all stars with Log(R′
8542)≤-5.0 are not plotted (all such stars have (V-IC)0 <0.6).
Noyes et al. (1984) plotted activity against a value called the Rossby number (NR) as a measure of a star’s rotation rate. Rossby number is defined as the star’s rotational pe-riod divided by a measure of the star’s convective turnover timescale (τc). Noyes et al. (1984) determinedτc based on the (B-V) colour of the target star.
A number of the stars in Tables 1 and 2 have period determinations. The Rossby number for these stars has been calculated usingτcfrom Noyes et al. (1984) Equation 4:
log(τc) =
1.362−0.166x+ 0.025x2−5.323x3 x >0
1.362−0.14x x <0 (9)
[image:12.612.306.542.97.431.2]val-0 50 100 150 200 250 300
vsini (km s−1)
−5.2 −4.7 −4.2
Log(R´
8498
)
VXR02A
VXR45A
(a)
0 50 100 150 200 250 300
vsini (km s−1)
−5.1 −4.6 −4.1
Log(R´
8662
)
[image:13.612.306.543.99.435.2](b)
Figure 8.The chromospheric emission ratio in (a) the 8498˚A line and (b) the 8662˚A line versusvsinifor our IC 2391/2602 stars. As with Figure 7 all stars with log(R′
8498) and log(R′8662)≤-5.2
and -5.1 respectively, are not shown. Again all these stars have (V-IC)0<0.6. The symbols are the same as in Figure 7.
ues are used, Figure 9 remains fundamentally unchanged except that the Rossby numbers are all shifted to lower val-ues and the saturation occurs at Log(NR)∼-1.5 rather than the Log(NR)∼-1.0 shown in Figure 9. We have decided to use the Noyes et al. (1984) values as many of the previous observations of saturation and supersaturation have used them (e.g. Soderblom et al. 1993; Patten & Simon 1996; Stauffer et al. 1997).
For those stars in Tables 1 and 2 that do not have measured rotational periods, we have used the method of Soderblom et al. (1993) to estimate the Rossby number from thevsiniof the star. The equation used is:
NR= 2πR τcvsini
(10)
where R is the stellar radius (in km),vsini is in km s−1, andτc(in seconds) is calculated from Equation 9. Assuming that stellar inclination angles are randomly distributed, then <sini>should be 0.785, so we have multiplied Equation 10 by this amount. We have also done this for the calculated Rossby numbers for the Pleiades and NGC 6475 which we have plotted.
Figure 9 plots the Log of the coronal X-ray emission (divided by the star’s bolometric luminosity) and the Log of
−2.5 −2.0 −1.5 −1.0 −0.5 0.0 0.5 1.0 Log(NR)
−7.0 −6.5 −6.0 −5.5 −5.0 −4.5 −4.0 −3.5 −3.0 −2.5
Log(L
X
/L
bol
)
(a)
−2.5 −2.0 −1.5 −1.0 −0.5 0.0 0.5 1.0 Log(NR)
−6.5 −6.0 −5.5 −5.0 −4.5 −4.0
Log(R´
8542
)
(b)
Figure 9.(a) The Log of the coronal X-ray emission divided by the star’s bolometric luminosity, and (b) the Log of the chromo-spheric emission ratio in the 8542˚A line, versus the Log of the Rossby number (NR) for the single observed members of IC 2391
and IC 2602. Again results from the Pleiades (crosses) and NGC 6475 (pluses) are included and squares represent stars from IC 2391 and diamonds IC 2602. Filled and open symbols represent stars with known periods and stars whose Rossby number had to be estimated from Equation 10, respectively. The black line is just an estimate of the saturation level for Log(NR) <-1.1,
while for Log(NR)>-1.1 the line is a simple linear fit to the IC
2391/2602 data points with a fixed endpoint of Log(NR) = -1.1
and Log(R′
8542) = -4.2
.
the chromospheric emission ratio for 8542˚A line against the Log of the Rossby number for our stars in IC 2391/2602 with Figure 10 showing how the chromospheric emission changes with colour (unsurprisingly showing that redder stars are more active). Again, in both Figures, the coronal X-ray data for IC2391/2602 are from Patten & Simon (1996) and Stauffer et al. (1997), the coronal and chromospheric data for the Pleiades are from Stauffer et al. (1994), Micela et al. (1999), and Soderblom et al. (1993), and the NGC 6475 data are from James & Jeffries (1997).
[image:13.612.41.281.100.431.2]−4.8 −4.6 −4.4 −4.2 −4.0
Log(R´
8542
)
−4.8 −4.6 −4.4 −4.2 −4.0
Log(R´
8542
)
−2.5 −2.0 −1.5 −1.0 −0.5
Log(NR)
−5.0 −4.8 −4.6 −4.4 −4.2 −4.0
Log(R´
8542
)
−2.0 −1.5 −1.0 −0.5 0.0
Log(NR)
Figure 10.The Log of the chromospheric emission ratio in the 8542˚A line, versus the Log of the Rossby number (NR) for the
single observed members of IC 2391 and IC 2602, separated into colour bins. Only those stars with (V-IC)0 ≥ 0.6 have been
in-cluded. The symbols are the same as in Figure 9, however the scale of the plots is different.
Log(R′
8542)∼-4.2. This is similar to that shown in the Ca II 8542˚A emission for the Pleiades stars by Soderblom et al. (1993) and the NGC 6475 stars by James & Jeffries (1997). The scatter that the unknown inclination angle and esti-mated radius adds to Figure 9 for stars without a measured rotation period does not appear to be significant compared with the inherent scatter in the emission of the stars.
The onset of saturation appears to occur at around Log(NR) ∼ -1.0 for both the coronal and chromospheric emission. If saturation occurs at the same Rossby num-ber then the relationship between the coronal and chromo-spheric emission should be linear approaching saturation. Ig-noring those stars with activity around the saturation level (in either coronal or chromospheric emission), i.e. includ-ing only those stars in the box in Figure 11, there appears to be a change in the relationship between the two activ-ity indicators for the stars in this study, between stars with LX/Lbol∼<20 x 10−5(Log(LX/Lbol)∼<-3.7) and those stars above this value. This change occurs below both the coronal and chromospheric saturation level and could indicate that coronal and chromospheric emission have a slightly different relationship for stars with low activity than for more active stars, rather than indicating a change in the onset of
satu-0 20 40 60 80 100 120 140
LX/Lbol(x10 −5
) 0
1 2 3 4 5 6 7 8
R´
8542
(x10
−5
[image:14.612.43.280.79.437.2] [image:14.612.307.541.98.273.2])
Figure 11.Chromospheric emission ratio in the 8542˚A line ver-sus coronal X-ray activity. Again squares represent IC 2391 stars and diamonds IC 2602 stars. The dashed lines show the approx-imate saturation levels for the activity indicators. Open symbols represent stars with Log(NR)≤-1.14 and those symbols with a
plus sign inside represent those stars with Log(NR)≤-1.62.
ration. For stars more active than LX/Lbol∼20 x 10−5 the relationship between the coronal and chromospheric emis-sion (up to the saturation levels) could well be linear, but the scatter in the data is too large to determine if this is the case.
Ignoring the supersaturated stars, all but two of the stars within the box in Figure 11 (and two outside) have Log(NR)≥-1.14. This indicates that the Rossby number for the onset of saturation (for both coronal and chromospheric emission) is lower than Log(NR) = -1.0 indicated in Fig-ure 9 and is probably closer to Log(NR) = -1.1. In addition, Figure 11 shows that all but three stars with both a small Rossby number, Log(NR)≤-1.14, and low coronal activity, LX/Lbol≤60 x 10−5, (i.e. supersaturated) have Log(NR)≤ -1.62, with only one star having a “normal” saturated level of coronal activity and a Log(NR) ≤ -1.62. This appears to indicate that coronal supersaturation is occurring at a slightly higher Rossby number than shown in Figure 9(a), possibly closer to log(NR) = -1.6.
5.6 Colour and Age Effects
By the age of the Hyades∼625±50 Myrs (Perryman et al. 1998), the rotation rate of a solar-type star can be reason-ably determined based on its colour, with more massive stars showing higher rotation rates (Radick et al. 1987). However, due to the minimal amount of magnetic braking they have undergone, solar-type stars of the age of IC 2391 and IC 2602 should show a wide range of rotation rates for all colours. Figure 12 plotsvsiniagainst colour for the single stars in IC 2391 and IC 2602. As expected there is a wide range ofvsini
0.4 0.5 0.6 0.7 0.8 0.9 1.0 1.1 1.2 1.3 1.4 (V−IC)0
0 50 100 150 200 250 300
vsin
i (km s
[image:15.612.304.539.97.566.2]−1 )
Figure 12.Measuredvsinivalues versus colour. The symbols are the same as in Figure 2.
As stars age, their activity level falls as their rotation rate decreases through the loss of angular momentum via magnetic braking, i.e. Bouvier, Forestini & Allain (1997). Therefore it is expected that the overall activity levels of clusters should progressively shift to lower values for clus-ters of increasing age. There are two other young clusclus-ters for which the chromospheric emission ratio in the 8542˚A line has been measured, the Pleiades (Soderblom et al. 1993) at an age of 130 ± 20 Myrs according to the Lithium-depletion boundary method (Barrado y Navascu´es et al. 2004) and NGC 6475 (James & Jeffries 1997) at an age of∼220 Myrs. Figure 13 gives a histogram of the chromospheric emission ratios for IC 2391 and IC 2602, along with the ratios for the Pleiades and NGC 6475 clusters. The data for the Pleiades were taken from Soderblom et al. (1993) while the data for NGC 6475 were taken from James & Jeffries (1997). Most stars in IC 2391 and IC 2602 are seen to have a chromo-spheric emission level of around R′
8542∼2 to 5 x 10⁻⁵ com-pared to the Pleiades and NGC 6475, in which the peak is around R′
8542∼1 to 2 x 10⁻⁵. The median for IC 2391/2602 is R′
8542∼4.0 x 10⁻⁵, for the Pleiades the median is R′8542
∼2.2 x 10⁻⁵(although this may be skewed by the fact that no star has R′
8542<1.0 x 10⁻⁵) and the median is R′8542∼ 1.7 x 10⁻⁵for NGC 6475. As expected the median chromo-spheric activity level for the clusters drops with increasing cluster age, with IC 2391/2602 showing a much larger spread in chromospheric activity compared to the older clusters.
At the age of IC 2391 and IC 2602 the solar-type stars in the two clusters should have undergone no significant main-sequence braking and should represent the rotation rate with which they arrive (or will soon arrive) on the ZAMS. Fig-ure 14 is a histogram of the measFig-uredvsini values for the single stars observed in the two clusters in this study, along with thevsinidistributions for the Pleiades and NGC 6475. Again the Pleiades data are from Soderblom et al. (1993) and the NGC 6475 data are from James & Jeffries (1997). The number of slow rotators compared to fast rotators, us-ing the division ofvsini= 20 km s−1, is approximately even for IC 2391/2602 with 24 stars withvsini<20 km s−1 and 28 stars withvsini>20 km s−1. Thus ∼54% are rapid ro-tators. This is much the same as the similarly aged clus-ter NGC 2547 (lithium depletion boundary age = 35 Myrs,
0 2 4 6 8 10 12
N
(a)
0 5 10 15 20 25 30 35
N
(b)
0 1 2 3 4 5 6 7 8 9 10 11
R´8542 (x10
−5
) 0
2 4 6 8 10 12 14 16
N
(c)
Figure 13.Histogram of the distribution of chromospheric emis-sion ratios in the 8542˚A line for (a) the single members of IC 2391 & IC 2602, (b) the Pleiades, and (c) NGC 6475. The shaded data in (a) represents IC 2602 while the data with no shading represents IC 2391. Only stars with measuredvsini have been included.
[image:15.612.46.277.100.265.2]0 5 10 15 20 25 30
N
(a)
0 10 20 30 40 50 60 70
N
(b)
0 20 40 60 80 100 120 140 160 180 200 220 240 260
vsini (km s−1
) 0
5 10 15 20 25
N
[image:16.612.43.275.82.566.2](c)
Figure 14.Histogram of the distribution ofvsinifor the single members observed in (a) IC 2391 & IC 2602, (b) the Pleiades, and (c) NGC 6475. The shading and references are the same as in Figure 13. Only stars with R′
8542measures have been included.
has decreased significantly from that of IC 2391/2602, with the medianvsiniof IC 2391/2602 = 21 km s−1, the Pleiades = 9 km s−1, and NGC 6475 = 8 km s−1.
When looking at the difference between the G stars (0.6 ≤(B-V)0≤0.9) and the early-K stars (0.9≤(B-V)0≤1.2) in IC 2391/2602 the percentage of rapidly rotating G stars is 34% while for early-K stars it is 58%. For the Pleiades the percentages are 15% for the G stars and 29% for the early-K stars. In NGC 6475 the rapid rotators makeup 0% of the G stars, but 33% of the early-K stars. Thus between the ages of IC 2391/2602 and the Pleiades the proportion of rapidly rotating G and K stars drops by about half (with the propor-tion of rapidly rotating G stars dropping slightly more than
for the early-K stars). By the age of NGC 6475 there are no rapidly rotating G stars while the proportion of rapidly rotating early-K stars is similar to that of the Pleiades (al-though this may be influenced by the small number of early-K stars observed in NCG 6475; 2 of the 6 observed are rapid rotators).
The rotational evolution of cluster stars has been stud-ied by a number of people including a recent study by Irwin et al. (2007) which includes rotational periods for a number of young clusters of varying ages, including rota-tional data from IC 2391/2602 stars. The observations pre-sented in Irwin et al. (2007) show that the rotational period of G stars falls at a similar rate to that of K stars (from a peak around the IC 2391/2602 age) for clusters up to∼200 Myrs. After this age the observations show that the rotation rate of G stars falls quite dramatically compared to that for K stars. This is in good agreement with thevsini results from IC 2391/2602, the Pleiades, and NGC 6475.
Irwin et al. (2007) have also modelled the angular mo-mentum evolution of young clusters as they age, incorpo-rating dynamo saturation into the models. The results indi-cate that a mass-dependent saturation velocity is required to reproduce the observations (taken into account via the mass-dependency of the Rossby number in our results, see § 5.5). Additionally, Irwin et al. (2007) found that while solid-body rotation can explain the evolution of the fastest rotators, core-envelope decoupling (with different rotations in the stellar core and envelope) appears to be required to explain the evolution of the slowest rotators.
6 DISCUSSION
6.1 Chromospheric Saturation
Figure 9(a) gives the relationship between the coronal X-ray emission of the single solar-type stars in IC 2391 and IC 2602 and Rossby number. Figure 9(b) gives the same plot for the chromospheric emission ratio in the 8542˚A line. For stars with Log(NR) ∼<-1.1 there is a saturation in the chromospheric emission at a level of around Log(R′
8542) ∼ -4.2. This agrees well with the results of Soderblom et al. (1993) and James & Jeffries (1997), who found a saturation in the chromospheric emission ratio for solar-type stars in the Pleiades and NGC 6475 of a similar level. The saturation levels for the two other Calcium IRT lines at 8498˚A and 8662˚A are shown in Figure 8 and are Log(R′
8498) ∼ -4.4 and Log(R′
8662) ∼ -4.3. This confirms that, as expected, there is a saturation in the chromospheric emission of these cluster stars similar to that observed in the X-ray data from this and other clusters.
of saturation occurs around Log(NR)∼-0.7 (with a satura-tion level of Log(FMgII)∼6.3). Thus the onset of saturation for the Mg II emission appears to occur at a slightly higher Rossby number than what we find for the Ca II emission but may be within the error bars as Cardini & Cassatella (2007) calculated the Rossby number empirically themselves rather than using the Noyes et al. (1984) value. In other work, the measurement of stellar activity using ∆V (optical light curve amplitude, used as a proxy for covering frac-tion of starspots) by O’Dell et al. (1995), shows the onset of saturation only for Log(NR) ∼< -1.5, if at all (using the Noyes et al. (1984)τcvalues). This is long after both coronal and chromospheric saturation have set in, but more recent work by Krishnamurthi et al. (1998) has questioned the use of ∆V as an activity indicator.
Thus we conclude that both the chromospheric and coronal emission appear to be saturating at a similar Rossby number. This supports the idea that both coronal and chro-mospheric saturation are caused by the same mechanism.
What are the possible mechanisms behind saturation? Jardine & Unruh (1999) have suggested that the effect of saturation seen in X-ray emission could be the result of a reduction in the coronal X-ray emitting volume due to cen-trifugal stripping of the corona for rapid rotators. As ro-tation rate increases, the co-roro-tation radius of the star de-creases. Jardine & Unruh (1999) suggest that around the saturation velocity the co-rotation radius moves inside the X-ray emitting corona. The rise in gas pressure then breaks the magnetic loops to form open field regions that are dark in X-rays. As rotation increases the reduction in emitting vol-ume is balanced by a rise in the density of the corona leading to saturation. While this idea explains coronal (X-ray) sat-uration, it cannot be used to explain chromospheric satura-tion. To explain chromospheric saturation, Jardine & Unruh (1999) suggest that another mechanism, such as the en-hanced continuum emission proposed by Doyle (1996) may be responsible. However, if coronal and chromospheric sat-uration are controlled by two different mechanisms it would be unlikely (but not impossible) that they would saturate at the same Rossby number. Thus the Jardine & Unruh (1999) explanation would appear to be unlikely.
Another suggestion to explain coronal saturation has been put forward by St¸epie´n et al. (2001) who suggest that coronal saturation is the result of the coronal emitting re-gions of a star being completely filled. This, we assume, would similarly be happening to the chromospheric emis-sion regions to account for chromospheric saturation. In this scenario the onset of saturation could conceivably occur at similar Rossby number for both coronal and chromospheric emission, if both are caused by strong magnetic fields erupt-ing through the stellar surface and extenderupt-ing into the chro-mosphere and corona. However, as explained below, this idea appears to fall down when trying to explain supersaturation. Finally it should be noted that a different explanation for saturation (but not supersaturation) has been put for-ward by Barnes (2003). He argues that saturation is just the effect of a different dynamo in operation in rapidly-rotating stars, a convective rather than an interface dy-namo. Such an explanation is supported by the finding of large regions of azimuthal magnetic field on the surfaces of young rapidly-rotating solar-type stars (i.e. Donati et al. 2003; Marsden et al. 2006), which have been explained by
the operation of a dynamo distributed throughout the con-vection zone (Donati et al. 2003). Barnes (2003) claims that saturated stars should all be located on what he calls the convective sequence (see Barnes 2003, Figure 2). However, this is just saying that saturated stars are more rapidly-rotating than non-saturated stars (i.e. rapidly-rapidly-rotating stars are more active) which is obvious and thus our results pro-vide no way of determining if the Barnes (2003) explanation is correct.
6.2 Chromospheric Supersaturation?
A further complication to the problem of saturation is the effect of supersaturation. The X-ray emission from the IC 2391 and IC 2602 stars, when plotted against Rossby num-ber in Figure 9(a), shows the supersaturation effect occur-ring around Log(NR)∼-1.6. This has been seen in the X-ray emission of other young cluster stars (Pizzolato et al. 2003; Stauffer et al. 1997; Patten & Simon 1996; Randich et al. 1996; Prosser et al. 1996b), and has also been seen, to a lesser extent, in the X-ray emission of W UMa and M dwarf stars (St¸epie´n et al. 2001; James et al. 2000). This study in-cluded measurements of the chromospheric emission of 5 stars in IC 2391 and IC 2602 with (V-IC)0 >0.6 andvsini values>100 km s−1, including 3 stars withvsinivalues> 200 km s−1. The chromospheric emission for the IC 2391 and IC 2602 stars, Figures 7(b), 8, and 9(b), show little evidence of a decrease in chromospheric emission for stars withvsini
∼
>100 km s−1or Log(N
R)∼<-1.6. Thus, it would appear that either supersaturation does not exist for the chromospheric emission of ultra-rapid rotators, or it occurs at a rotation rate significantly greater than that for coronal emission.
It should be noted that due to the massive broadening of the spectral lines with such highvsinivalues, the accuracy of fitting of the inactive star to the target star can have an impact on the level of emission measured. However, a change of Log(R′
8542) from -4.2 to -4.5 (which would be required to have a similar supersaturation effect to that seen in the X-ray emission) is about twice what we estimate the error in Log(R′
8542) to be (see§5.4.1) which we consider unlikely. Our Calcium infrared triplet results are supported by the results of Randich (1998) which show no supersaturation in the Hα emission of ultra-rapid rotators in the 50-Myr oldα-Persei cluster. In addition, the Mg II study of cluster and field stars by Cardini & Cassatella (2007) also shows no evidence of supersaturation, however the lowest Log(NR) value they have for their stars is greater than -1.6, so they are not really within the supersaturation regime.
In contrast to our results, a study of a number of active stars of spectral type K2 or later by Scholz et al. (2007) has shown tentative evidence for supersaturation in the Hαemission of two stars withvsini values around 100 km s−1. However, these are true pre-main sequence objects and the swollen convection zone of such objects may act dif-ferently to that of more zero-age main-sequence stars we have studied. This is supported by Feigelson et al. (2003) and Preibisch et al. (2005) who find a changed (from that for ZAMS stars) X-ray activity - Rossby number relation-ship for the pre-main sequence stars in the Orion nebula.
ac-tive coronal regions, leaving the equator void of acac-tive re-gions and thus decreasing the coronal filling factor of the star. The fact that the chromospheric emission observed in this paper shows little evidence of supersaturation would count against this model being the mechanism for supersat-uration, as it would be expected that a poleward movement of active regions would also affect the chromospheric emis-sion.
Such a trend in the motion of active regions is also not evidenced in the Doppler imaging of spot topologies of young active stars. Many of the stars Doppler imaged show rather similar spot patterns often with polar or high latitude spots and some lower latitude features. Comparing the Doppler images of stars from IC 2391/2602 in both the saturation (R58,vsini = 92 km s−1) and supersaturation (VXR45A,vsini = 235 km s−1) regime show similar spot maps (Marsden et al. 2004) with no evidence of a further poleward migration of active regions for the supersaturated star.
The coronal stripping model of Jardine & Unruh (1999) discussed previously could account for supersaturation. As the co-rotation radius continues to decrease with an increase in rotation rate, eventually enough of the coronal volume is forced open and the X-ray emission falls with rotation rate. Jardine (2004) has used this model to explain both the modulation (observed by Marino et al. 2003) and supersat-uration of the X-ray observations of the ultra-rapid rotator VXR45A. If the coronal stripping model is correct then it would be unlikely that chromospheric emission would show any evidence of supersaturation as centrifugal stripping will only affect the coronae of these stars. Thus the observations presented in this paper, showing no chromospheric supersat-uration, are consistent with the coronal stripping model of Jardine & Unruh (1999). Unfortunately, as mentioned pre-viously, the fact that both the chromospheric and coronal emission show the onset of saturation at a similar Rossby number would appear to count against this model.
Thus the mechanisms causing both saturation and su-persaturation remain elusive.
7 CONCLUSIONS
In this paper we have reported on the chromospheric emis-sion levels of over 50 solar-type F, G, and K stars in the young open clusters IC 2391 and IC 2602. Due to their youth, IC 2391 and IC 2602 contain a number of star that can be classified as ultra-rapid rotators (vsini>100 km s−1) and thus are excellent targets to determine if chromospheric emission shows signs of supersaturation.
We have redeterminedvsini values for all our targets in both clusters and determinedvsini values for a number of targets (especially those ultra-rapid rotators) for the first time. The clusters show a wide range ofvsinivalues for most colours studied (0.4 < (V-IC)0 < 1.4) although there is a deficit of rapid rotators around (V-IC)0 ∼ 0.8, which we believe has just occurred by chance.
We have shown that chromospheric emission saturates for stars with Log(NR) ∼<-1.1. The saturation levels found are Log(R′
8542)∼-4.2, Log(R′8498)∼-4.4, and Log(R′8662)
∼ -4.3, for the three Calcium IRT lines at 8542˚A, 8498˚A, and 8662˚A respectively. The chromospheric saturation level
in the 8542˚A line agrees well with that for two older clus-ters, NGC 6475 and the Pleiades (James & Jeffries 1997; Soderblom et al. 1993). Both activity indicators appear to be saturating at a similar Rossby number which lends weight to the saturation seen being caused by a single mechanism, which remains unknown.
Significantly, chromospheric emission from these stars shows little evidence of the effect of supersaturation seen in the coronal X-ray emission of the same stars. Thus we be-lieve that X-ray supersaturation is not a result of an overall decrease in the efficiency of the magnetic dynamo in ultra-rapid rotators.
ACKNOWLEDGMENTS
The observations for this paper were taken with Anglo-Australian Telescope. We would like to thank the techni-cal staff of the Anglo-Australian Observatory for their ex-cellent assistance during these observations. We would also like to thank the referees (Rob Jeffries and an anonymous referee) for their comments that helped greatly improve this manuscript. SCM was funded by a University of Southern Queensland PhD scholarship during the course of this work. This research has made use of the WEBDA database, op-erated at the Institute for Astronomy of the University of Vienna.
REFERENCES
Barnes S., 2003, ApJ, 586, 464
Barnes S., Sofia S., 1996, ApJ, 462, 746
Barnes S. A., Sofia S., Prosser C. F., Stauffer J. R., 1999, ApJ, 516, 263
Barrado y Navascu´es D., Stauffer J. R., Jayawardhana R., 2004, ApJ, 614, 386
Bessell M. S., Stringfellow G. S., 1993, in Burbidge G., Layzer D., Sandage A., eds., Annual Review of Astron-omy and Astrophysics, Vol. 31, Annual Reviews Inc., Palo Alto, California, p. 433
Bessell M. S., Castelli F., Plez B., 1998, A&A, 333, 231 Bouvier J., Forestini M., Allain S., 1997, A&, 326, 1023 Braes L. L. E., 1961, Monthly Notices of the Astronomical
Society of South Africa, 20, 7
Braes L. L. E., 1962, Bulletin of the Astronomical Institutes of the Netherlands, 16, 297
Buscombe W., 1965, MNRAS, 129, 411
Caldwell J.A.R., Cousins A.W.J., Ahlers C.C., van Wame-lan P., Maritz E.J., 1993, South African Astronomical Ob-servatory Circulars, 15, 1
Cardini D., Cassatella A., 2007, ApJ, 666, 393 Chmielewski Y., 2000, A&A, 353, 666
D’Antona F., Mazzitelli I., 1997, in Micela G., Pallavicini R., Sciortino S., eds., Memorie della Societa astronomia Italiana, Vol. 68, Cool stars in clusters and associations: Magnetic activity and age indicators, Societa astronomia Italiana, p.807
Donati J.-F., Semel M., Carter B., Rees D. E., Cameron A. C., 1997, MNRAS, 291, 658
D’Orazi V., Randich S., 2009, A&A, accepted (arXiv:0905.1835)
Doyle J. G., 1996, A&A, 307, L45
Feigelson E. D., Gaffney III J. A., Garmire G., Hillenbrand L. A., Townsley L., 2003, ApJ, 584, 911
Foing B. H., Crivellari L., Vladilo G., Rebolo R., Beckman J. E., 1989, A&A Supp. Ser., 80, 189
Hogg A. R., 1960, PASP, 72, 85
Irwin J., Hodgkin S., Aigrain S., Hobb L., Bouvier J., Clarke C., Moraux E., Bramich D. M., 2007, MNRAS, 377, 741
James D. J., Jeffries R.D., 1997, MNRAS, 291, 252 James D. J., Jardine M. M., Jeffries R. D., Randich S.,
Collier Cameron A., Ferreira M., 2000, MNRAS, 318, 1217 Jardine M., 2004, A&A, 414, L5
Jardine M., Unruh Y. C., 1999, A&A, 346, 883 Jeffries R. D., Oliveira J. M., 2005, MNRAS, 358, 13 Jeffries R. D., Totten E. J., James D. J., 2000, MNRAS,
316, 950
Kim Y.-C., Demarque P., 1996, ApJ, 457, 340
Krishnamurthi A., Pinsonneault M. H., Barnes S., Sofia S., 1997, ApJ, 480, 303
Krishnamurthi A., Terndrup D. M., Pinsonneault M. H., et al., 1998, ApJ, 493, 914
Kurucz R. L., 1993, CDROM #13 (ATLAS9 atmospheric models) and CDROM #18 (ATLAS9 and SYNTHE rou-tines, spectral line database)
Linsky J. L., Hunten D. M., Sowell R., Glackin D. L., Kelch W. L., 1979, ApJ Supp. Ser., 41, 481
Lyng ˙a G., 1961, Arkiv f¨or Astronomii, 2, 379 Mallik S. V., 1997, A&A Supp. Ser., 124, 359
Marino A., Micela G., Peres G., Sciortino S., 2003, A&A, 407, L63
Marino A., Micela G., Peres G., Pillitteri I., Sciortino S., 2005, A&A, 430, 287
Marsden S. C., Waite I. A., Carter B. D., Donati J.-F., 2004, Astron. Nachr., 325, 246
Marsden S. C., Donati J.-F., Semel M., Petit P., Carter B. D., 2006, MNRAS, 370, 468
Mestel L., Spruit H. C., 1987, MNRAS, 226, 57
Micela G., Sciortino S., Harnden Jr F.R., et al., 1999, A&A, 341, 751
Nordstr¨om B., Mayor M., Anderson J., et al., 2004, A&A, 418, 989
Noyes R. W., Hartmann L. W., Baliunas S. L., Duncan D. K., Vaughan A. H., 1984, ApJ, 279, 763
O’Dell M. A., Panagi P., Hendry M. A., Collier Cameron A., 1995, A&A, 294, 715
Patten B. M., 1995, PhD thesis, University of Hawaii Patten B. M., Simon T., 1996, ApJ, Supp. Ser., 106, 489 Perry C. L., Bond H. E., 1969, PASP, 81, 629
Perry C. L., Hill G., 1969, AJ, 74, 899
Perryman M.A.C., Brown A.G.A., Lebreton Y., et al., 1998, A&A, 331, 81
Pinsonneault M. H., Stauffer J., Soderblom D. R., King J. R., Hanson J. B., 1998, ApJ, 504, 170
Pizzolato N., Maggio A., Micela G., Sciortino S., Ventura P., 2003, A&A, 397, 147
Platais I., Melo C., Mermilliod J.-C., Kozhurina-Platais V., Fulbright J. P., M´endez R. A., Altmann M., Sperauskas J., 2007, A&A, 461, 509
Preibisch T., Kim Y.-C., Fatava F., et al., 2005, ApJ Supp.
Ser., 160, 401
Prosser C. F., Randich S., Stauffer J. R., 1996a, AJ, 112, 649
Prosser C. F., Randich S., Stauffer J. R., Schmitt J. H. M. M., Simon T., 1996b, AJ, 112, 1570
Radick R.R., Thompson D.T., Lockwood G.W., Duncan D.K., Baggett W.E., 1987, ApJ, 321, 459
Randich S., 1998, in Donahue R.A., Bookbinder J.A., eds., Cool Stars, Stellar Systems and the Sun 10, ASP Confer-ence Series, Vol.154, p.501
Randich S., 2001, A&A, 377, 512
Randich S., Schmitt J. H. M. M., Prosser C. F., Stauffer J. R., 1995, A&A, 300, 134
Randich S., Schmitt J. H. M. M., Prosser C. F., Stauffer J. R., 1996, A&A, 305, 785
Randich S., Aharpour N., Pallavicini R., Prosser C. F., Stauffer J. R., 1997, A&A, 323, 86
Randich S., Pallavicini R., Meola G., Stauffer J. R., Bal-achandran S. C., 2001, A&A, 372, 862
Scholz A., Coffey J., Brandeker A., Jayawardhana R., 2007, ApJ, 662, 1254
Soderblom D. R., Stauffer J. R., Hudon J. D., Jones B. F., 1993, ApJ Supp. Ser., 85, 315
Stauffer J., Hartmann L. W., Jones B. F., McNamara B. R., 1989, ApJ, 342, 285
Stauffer J.R., Caillault J.-P., Gang´e M., Prosser C.F., Hart-mann L.W., 1994, ApJ Supp. Ser., 91, 625
Stauffer J. R., Hartmann L. W., Prosser C. F., Randich S., Balachandran S., Patten B. M., Simon T., Giampapa M., 1997, ApJ, 479, 776
St¸epie´n K., Schmitt J. H. M. M., Voges W., 2001, A&A, 370, 157
Valenti J. A., Fischer D. A., 2005, ApJ Supp. Ser., 159, 141 van Leeuwen F., 1999, A&A, 341, L71