A STUDY OF THE SEVERITY OF
DISABILITY AND NUTRITIONAL
STATUS OF PEOPLE WITH
DISABILITIES AND THE QUALITY OF
LIFE AMONG PEOPLE WITH PHYSICAL
DISABILITIES AND PRIMARY
CAREGIVERS OF PEOPLE WITH
DISABILITIES IN KANIYAMBADI
BLOCK
DISSERTATION SUBMITTED IN PARTIAL FULFILLMENT OF
THE REQUIREMENT OF THE TAMILNADU DR. M.G.R MEDICAL
UNIVERSITY, CHENNAI, FOR THE DEGREE OF MD BRANCH-XV
(COMMUNITY MEDICINE) EXAMINATION TO BE HELD IN
CERTIFICATE
This is to certify that “A study of the severity of disability and
nutritional status of people with disabilities and quality of life among
people with physical disabilities and primary caregivers of people with
disabilities in Kaniyambadi block” is a bona fide work of
Dr. Nancy Angeline G in partial fulfillment of the requirements for the
M. D Community Medicine examination (Branch-XV) of the
Tamilnadu Dr. M.G.R Medical University, Chennai, to be held in April,
2015.
GUIDE
HEAD OF THE DEPARTMENT
.
Dr. Vinod Joseph Abraham. MD, MPH
Professor
Department of Community Health Christian Medical College, Vellore.
Dr. Jasmin Helan Prasad. MD, MPH, DNB
Professor & Head
i
ACKNOWLEDGEMENTS
First and foremost I want to thank my mentor, guide and professor Dr. Vinod Joseph Abraham, for helping me complete my thesis.
The Head of the Department and my professor Dr. Jasmin for believing in me and giving me heart warming encouragements when I needed the most.
My professor, Dr. Kurien George, for always being eager to give a second chance to me and for his enquiries into the progress of my thesis.
All my professors who taught me at various periods in my postgraduation .
The Health Aides who taught me hands on Community Health.
The PTCHWs who accompanied me during difficult walks in villages.
The residents of the block who volunteered many a times to help me find a participant’s
house.
Occupational therapist, Mr. Samuel Prasanna and Social worker Mrs. Gifta, for their intense help in the focus group discussion.
My best friend Divya V.S. and my batchmates Sam, Rohan, Sindhu and Bose for the friendship that we shared. My mother , father and sister for their unconditional love.
All the participants and their caregivers for their co-operation.
Mr. Damodaran, the librarian and Mr. Williams for the help with printing. Mr. Saravanakumar and Mr. Arun for teaching me bibliography. All staff in CHAD for their support.
ii
ACRONYMS
ADL – Activities of Daily Living AOR – Adjusted Odds Ratio BMI – Body Mass Index CC – Calf circumference
CHAD – Community Health And Development CI - Confidence interval
CMC - Christian Medical College EQ5D – Euroqol
ICC – Interclass Correlation Coefficient
ICF – International Classification of Functioning, disability and health ICIDH - International Classification of Impairment, Disability and Handicap IRB – Institutional Review Board
IRT – Item Response Theory MAC – Mid Arm Circumference MNA – Mini Nutritional Assessment
NSSO – National Sample Survey Organization PROs – Patient Reported Outcomes
PTCHW – Part Time Community Health Worker PWD – People With Disabilities act
QALY – Quality Adjusted Life Years QLI – Quality of Life Index
QOL – Quality Of Life SES – Socio Economic Status
UPIAS – The Union of the Physically Impaired Against Segregation UN – United Nations
WHO – World Health Organization
iii
INDEX OF TABLES AND FIGURES
Table no. Title of Table Page
Table 3.1 Description of ICF Components and domains 12
Table 3.2 Definitions of different types of education 24
Table 3.3 Definitions of different types of occupation 25
Table 3.4 Description of WHO classification of adult underweight,
overweight and obesity according to BMI 33
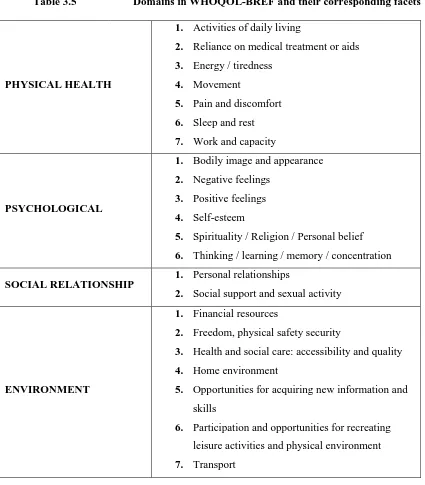
Table 3.5 Domains in WHOQOL-BREF and their corresponding facets 44
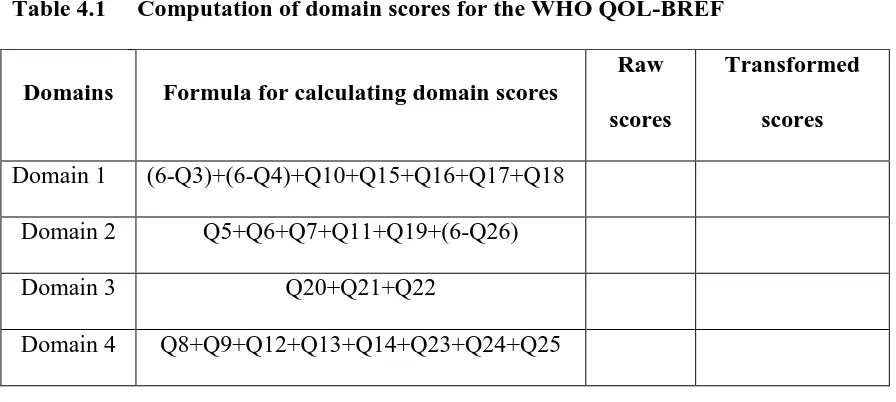
Table 4.1 Computation of domain scores for WHOQOL- BREF 49
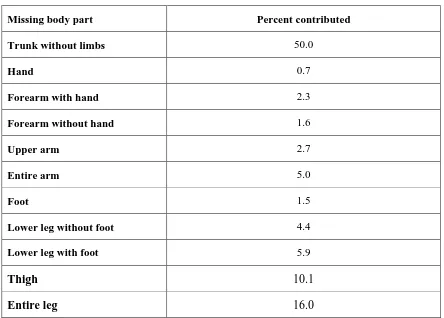
Table 4.2 Percent of body weight contributed by specific body part 59
Table 4.3 Screening scores for Mini Nutritional Assessment (MNA) scale 60
Table 4.4 Scoring for malnutrition indicator scores for MNA scale 60
Table 4.5 International classification of functioning, disability and health
(ICF) grading 61
Table 5.1 Distribution of the people with disabilities by age 63
Table 5.2 Distribution of the people with disabilities by marital status 64
Table 5.3 Distribution of the people with disabilities by literacy status 64
Table 5.4 Distribution of the people with disabilities by education 65
Table 5.5 Distribution of the people with disabilities by occupation 65
Table 5.6 Distribution of the people with disabilities by the total monthly
family income in Rupees 66
Table 5.7 Distribution of the people with disabilities by the education of the
iv
Table No. Title of table Page
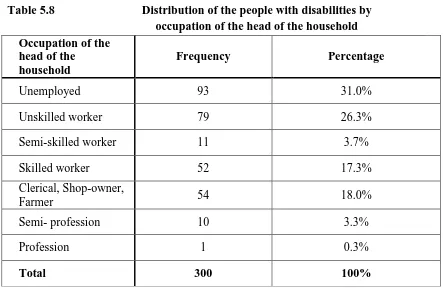
Table 5.8 Distribution of the people with disabilities by the occupation of the
head of the household 67
Table 5.9 Distribution of the study population by socio-economic status 67
Table 5.10 Distribution of the study population by type of house 68
Table 5.11 Distribution of the study population by type of family 68
Table 5.12 Distribution of the study population by religion 68
Table 5.13 Distribution of impairments among the people with disabilities 69
Table 5.14 Distribution of the people with disabilities by number of
impairments 69
Table 5.15 Distribution of the people with disabilities by type of disability 70
Table 5.16 Distribution of cause of disability among the people with disability 70
Table 5.17 Distribution of the people with disabilities by type of co-morbidity 71
Table 5.18 Distribution of the people with disabilities by use of aids 72
Table 5.19 Distribution of different types of aids used by the people with
physical disabilities 72
Table 5.20 Distribution of people with disabilities by receipt of disability
pension 72
Table 5.21 Distribution of males with disabilities by use of alcohol or tobacco 73
Table 5.22 Distribution of Body Mass Index (BMI) of persons with disabilities
as per the WHO classification 73
Table 5.23 Distribution of primary caregivers of the people with disabilities by
age 74
Table 5.24 Distribution of primary caregivers by their relation with the person
with disability 75
Table 5.25 Description of duration of disability among the people with
disability 75
Table 5.26 Duration of caregiving and the primary caregiver’s relation with the
person with disability 76
Table 5.27 Prevalence of malnutrition (by Mini Nutritional Assessment scale
v
Table No. Title of table Page
Table 5.28 Percentage of malnutrition among the people with disability as per
the malnutrition indicator score 77
Table 5.29 Distribution of the people with disabilities by the number of meals
taken in a day 77
Table 5.30 Distribution of the people with disabilities by their view on
nutritional status 77
Table 5.31 Distribution of the people with disabilities by Mid-Arm
Circumference (MAC) 78
Table 5.32 Distribution of the people with disabilities by Calf circumference
(CC) 78
Table 5.33 Distribution of the people with disabilities by decline in food intake 78
Table 5.34 Distribution of the people with disabilities by protein consumption 79
Table 5.35 Distribution of the people with physical disabilities by their self rate
of quality of life 79
Table 5.36 Description of domain wise scores of quality of life among the
people with physical disabilities 80
Table 5.37 Distribution of the people with physical disabilities by their
satisfaction with health 80
Table 5.38 Distribution of the people with physical disabilities by their
frequency of negative feelings 81
Table 5.39 Distribution of primary caregivers of the people with disabilities by
their self rating of quality of life 81
Table 5.40 Description of domain wise scores of quality of life among the
primary caregivers of people with disabilities 82 Table 5.41 Description of primary caregivers of people with disabilites by their
satisfaction with health 82
Table 5.42 Distribution of the primary caregivers of people with disabilities by
their frequency of negative feelings 82
Table 5.43 Description of domain wise scores of Disability Assessment
Schedule (DAS) among the people with disabilities 83
Table 5.44
Distribution of the people with disabilities by the number of days in which he/she was totally unable to carry out usual activities in the past one month
84
Table 5.45
Distribution of people with visual disabilities by International Classification of Functioning, disability and health (ICF) grading of
difficulty in seeing 85
Table 5.46 Distribution of people with hearing/speech disabilites by ICF
vi
Table no. Title of table Page
Table 5.47 Distribution of people with disabilities by ICF grading of difficulty
in employment 86
Table 5.48 Distribution of people with disabilities by ICF grading of difficulty
in community life 86
Table 5.49 Effect of socio-economic status on the quality of life of people with
physical disabilities 88
Table 5.50 Factors affecting the physical domain of quality of life of people
with physical disabilites 89
Table 5.51 Factors affecting the psychological domain of quality of life of
people with physical disabilities 90
Table 5.52 Factors affecting the social domain of quality of life of people with
physical disabilities 91
Table 5.53 Factors affecting the environmental domain of quality of life of
people with physical disabilities 92
Table 5.54 Factors affecting the physical domain of quality of life of primary
caregivers of the people with disabilities 93
Table 5.55 Factors affecting the psychological domain of quality of life of
primary caregivers of the people with disabilities 94 Table 5.56 Factors affecting the social domain of quality of life of primary
caregivers of the people with disabilities 95
Table 5.57 Factors affecting the environmental domain of quality of life of
primary caregivers of the people with disabilities 96 Table 5.58 Factors affecting the nutritional status of the people with disabilities 97
Table 5.59 Factors affecting the severity of disability of the people with
disabilities 98
Figure no. Title of figure Page
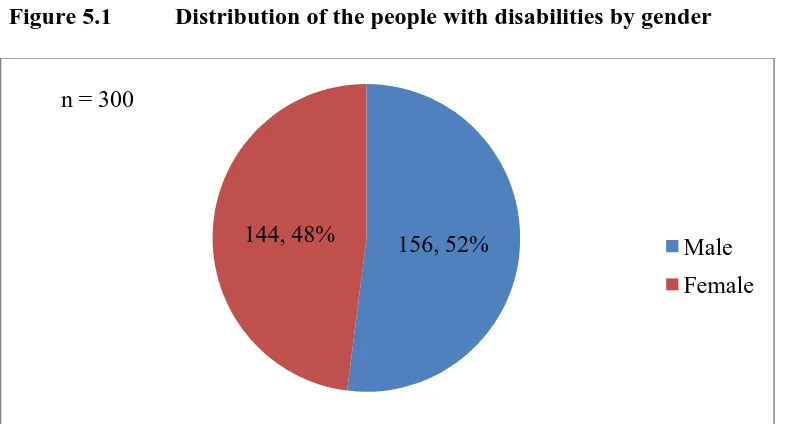
Figure 3.1 Interactions between the components of ICF 11 Figure 5.1 Distribution of the people with disabilities by gender 63 Figure 5.2 Distribution of people with disabilities by presence of co-morbidity 71 Figure 5.3 Distribution of primary caregivers of people with disabilities by
gender
74
Figure 5.4 Change in income status as a result of health condition ( among the people with disabilities)
84 Figure 5.5
vii
TABLE OF CONTENTS
1. Introduction--- 1
2. Objectives--- 4
3. Review of literature--- 5
4. Materials and methods--- 53
5. Results--- 63
6. Discussion--- 111
7. Limitations--- 120
8. Summary and conclusions--- 121
9. Recommendations--- 123
10.Bibliography--- 124
11.Annexures
Annexure 1- Map of the Kaniyambadi Block Annexure 2 - Questionnaire part 1
Annexure 3 - International Classification of Functioning, disability and health Annexure 4 - WHO Disability Assessment Schedule (DAS) 2.0
Annexure 5 - Mini Nutritional Assessment (MNA)Scale Annexure 6- WHOQOL- BREF
Annexure 7- Information sheet – English Annexure 8- Information sheet – Tamil
ABSTRACT
Title:
A study of the severity of disability and nutritional status of people with
disabilities and quality of life among people with physical disabilities and
primary caregivers of people with disabilities in Kaniyambadi block
Department: Community Health
Name of the candidate: Nancy Angeline G
Degree and subject: M.D Community Medicine
Name of the guide: Dr. Vinod Joseph Abraham
BACKGROUND:
Disability is a complex, multidimensional concept which affects all domains of life. Caregivers of people with disabilities face strains that influence their health and quality of life. Our study aims to assess the quality of life of people with disabilities and their caregivers. Severity of disability and nutritional status of people with disabilities was also assessed.
METHODS:
RESULTS:
Among the 203 people with physical disabilities aged 18 years and above, 37.5% self rated their quality of life as poor. Factors which were significantly associated with poor quality of life in physical domain among them were non congenital causes of disability (AOR 3.025, 1.086-8.425) and severe disability (DAS score ≥45.21) (AOR 3.319, 1.585 – 6.948). Being single (AOR 3.253, 95% CI 1.474-7.181) and lower socio-economic status (AOR 4.092, 1.55-10.804) were significantly associated with poor quality of life in social domain of the people with physical disabilities. Being unemployed (AOR 2.404, 95% CI 1.181-4.894) was significantly associated with environmental domain of quality of life people with them. Among the 300 primary caregivers of people with disabilities, 25.7% reported poor quality of life. Caregiver being elderly (AOR1.764, 95% CI 1.007–3.088) and severe disability (AOR2.042, 95% CI 1.258-3.314) were associated with poor quality of life in physical domain among the caregivers. Caregiver being a parent or child (AOR1.804, 95% CI 1.075-3.027) and lower socio-economic status (AOR 2.076, 95% CI 1.64-3.705) were associated with poor quality of life in psychological domain and female caregivers (AOR 4.317, 95% CI 2.005-9.294) were significantly associated with poor quality of life in social domain. Among the persons with disabilities 60% were either malnourished or were at risk for malnutrition. Being single (AOR 1.831, 95% CI 1.013-3.311), having more than one disability (AOR 2.127, 95% CI 1.093-4.136) and severe disability (AOR 6.106, 95% CI 3.194-11.67) were significantly associated with malnutrition and being at risk for malnutrition.
CONCLUSIONS:
1
1.
INTRODUCTION
Most individuals would have suffered from disability, be it temporary or permanent, either in younger, middle or old age. Many families have atleast one member with disability and any family member would have had a caregiving experience at some point in the ir lives. Disability has become a problem worldwide since most of the population is ageing (1). Increasing number of persons with disabilities worldwide have characterized the world’s most underprivileged groups who have been least included in any
developmental plan and goals internationally. Developing nations represent 80% of the persons with disabilities (2). Disability is considered as an evolving notion. It is not ascribed to a particular person but results from an inter-relationship between the environment and the society (3).
A person with disability has a different view of his health, the society, the environment and the world. This draws a distinction from a normal person’s view point. Quality of life
of a person with disability cannot be assessed only by health related quality of life since disability affects social, psychological and environemntal domains of a person’s quality
2
transport and housing facilities, education and employment opportunities (7). Obesity and overweight among the people with disabilities and inadequate diet are demonstrated in multiple studies (8,9) but there is dearth of studies on malnutrition among the people with disability.
In the Indian scenario, caregivers are usually family members who provide care to the person with disability. Caregiver mental and physical wellbeing is forgotten due to the focus on the person with disability.
However, caregivers undergo significant turmoil during the process of caregiving such as change in occupational and social aspects of their lives, unstable family income, stress, feeling burdened and depression. Reduced participaion in community activities is also noted among caregivers due to their caregiving role. Some of their cargiving roles includes difficult tasks which drains them emotionally and physically (10). Cognitive impairment and psychiatric diseases in the persons receiving care produces more burnout in the caregivers (11). Significantly lower quality of life has been observed among caregivers of people with disabilities as compared to the general population. Greater caregiver burden implies poorer quality of life (12).
3
disability to know the patient’s needs, to planning, policy making, allocate resources and
to measure outcomes (13).
4
2.
OBJECTIVES
1. To assess the quality of life of people with physical disabilities aged 18 and above in Kaniyambadi block.
2. To assess the severity of disability and nutritional status among the people with both physical and mental disabilities aged 18 years and above in Kaniyambadi block.
5
3.
REVIEW OF LITERATURE
Disability has never been in the limelight in the world of public health. However, off late there has been growing concern about the mounting population with disability through out the world. In present days due to effective public health interventions and medical research many people are living longer. Many individuals who would have previously died from injuries, impairments and congenital defects are continuing to survive with impairments (16). The people with disability often remain as minorities and are invisible in the society. Public health prevents disabilities but the health and welfare of disabled are relatively new concepts. In recent years there has been an increase in disability studies most of being cross sectional in nature and have revealed the gaps in health care and inequality experienced by the the people with disabilites (17).
3.1 DEFINITION OF DISABILITY
Defining disability is considered highly controversial because the understanding of disability is changing over the years (2). The terms used for people with disabilties in the past are now considered offensive and euphemism has changed the way they were being called. Terms such as moron, imbeclie, idiot, feeble minded and cretin were replaced by the psychiatry term ‘Retarded’(3). In the pre industrial era, the people with physical disabilities were called crippled, handicapped and lame. These were considered politically incorrect and newer terms such as physically challenged and disabled came into being (20).
6
manner or within the range considered normal for a human being’ and handicap as ‘any difficulty (for a given individual) resulting from an impairment or a disability, that limits or prevents the fulfilment of a role that is normal (based on age, sex and social and cultural factors) for that individual’ (21).
7
forth. The National Sample Survey Organization(NSSO) survey of the disabled persons 1981 used only 3 types of disability for its definition of disability namely visual, hearing and speech and locomotor (25).
3.2 MODELS OF DISABILITY
In attempting to define disability it is important to know the models of disability. Disability is a multifaceted complex condition which continues to interest the researchers who are studying it. The important models put forward to explain disability are (26,27): moral or religious model, medical model, social model, rehabilitative model, nagi’s model and International Classification of Functioning, disability and health (ICF) model
3.21 MORAL OR RELIGIOUS MODEL
It is the oldest model for disability and thankfully is disappearing from many countries. According to this model, disability is the result of the sins commited by self or some family member. Diseases such as seizure or schizophrenia were considered as divine possession or devil’s possession in various communities. Several religions consider
disability a result of God’s dissatisfaction with a person. Exorcism was considered as cure for psychiatric illnessess and the people with disabilities were identified as the needy requiring merciful care by some religions.This model is crticised for causing social ostracism among the people with disabilities and their family. Guilt, shame and loathing of self form this model (27,28).
3.22 MEDICAL MODEL
The medical model for disability gathered momentum around 19th century. To date, this model continues to be followed. The people with disabilities are at the mercy of physicians to be healed, to devise policies and the society had no role in the people with disabilities’s lives (27). Also called ‘Personal tragedy model’, this often causes the people
8
physical environment in the people with disabilties’s lives is forgotten in this model (29). The medical model revolves only around the person with disability devoid of external factors. Disability is considered as a disease and the person with disability is assumed to fill the role of sick. This model has the greatest impact on how disability is being viewed. Cure and eugenics were approaches for this model (30).
3.23 SOCIAL MODEL OF DISABILITY
One of the oldest social models of disability was described by Jane and Lucien Hanks in 1948. It explains the social model in non western countries. Some people with disabilities were excluded from societies and were even considered as dangerous. Economically the people with disabilities were considered liable since they rob considerable amount of capital which could be used for productive purposes (31). In the present days it is a favourable model among people with disabilities and sociologists alike since it makes the society more involved with disability (32). The Union of the Physically Impaired Against Segregation(UPIAS) British model of disability states that the society majorly makes a physically impaired person as disabled by means of seperating them from main stream and preventing them from actively participating in activities (33). Social model is concerned with hurdles removal, social equity and autonomous living. Rights of the persons with disabilities and activism require the social model for their functioning. It’s a realistic instrument which unshackles the disabled from the barriers they face. It increases the self worth of the individual with disability (34).
3.24 RIGHTS BASED MODEL OF DISABILITY
9
is one such rights based legislation. In 1993 the first European disabled people’s parliament was conducted which warranted against discrimination, societial, environmental barriers and promises full participation of the people with disabilities in the society (35,36). The rights of the person with disability has been devised by United Nations (UN). After the International Year of Disabled Persons, 1981 the World programme of Action for the person with disability was developed by General assembly of UN. It highlighted the rights of the persons with disabilties as equal opportunities as compared to normal people, same share in conditions of living and economic development. In the UN decade of persons with disabilities, it was suggested that the states should take adequate steps to remove hurdles which prevent the people with disabilities from implementing their rights and freedom and encourage them to participate in social and economical activities. The persons with disabilities are citizens like any normal person and they should enjoy equal rights and assistance in education, occupation and medical services. Equal rights and obligations should make sure that the person with disability perform in societies as normal members (37). The Persons With Disabilites act 1995 (Equal opportunities, protection of rights and full participation) was passed for Asia and Pacific regions, for Governments to adopt special measures for prevention of disabilities, social, educational development of the people with disabilities, supply of aides, access to places for them and disability research (38).
3.25 REHABILITATIVE MODEL
10
be done by the people with disabilities were encouraged among the veterans (39). Thus the rehabilitative model is the sister model of medical model but with promising benefits for the people with disabilities. It implies that all people with disabilities need special training by therapists who will ensure that the persons with disabilities become functional and go back to the communities without the role of sick. Many of the disablities can never be cured but the people with disabilities can be trained to function almost normally by rehabilitation (27).
3.26 NAGI’S MODEL OF DISABILITY
In 1991 Nagi put forth this model of disability which focuses more on the cultural and environmental aspects of disability. A woman who lives in a community where women do not go to work, could not go to work would not be considered as disabled even if she were physically unable to work due to a disability. On the other hand, a woman lives in a community where women regularly go for work will be considered as disabled. This model stresses more on the interaction between the individual, society, physical environment, cultural beliefs and political situations than the disability as such (40).
3.27 INTERNATIONAL CLASSIFICATION OF FUNCTIONING, DISABILITY AND HEALTH
11
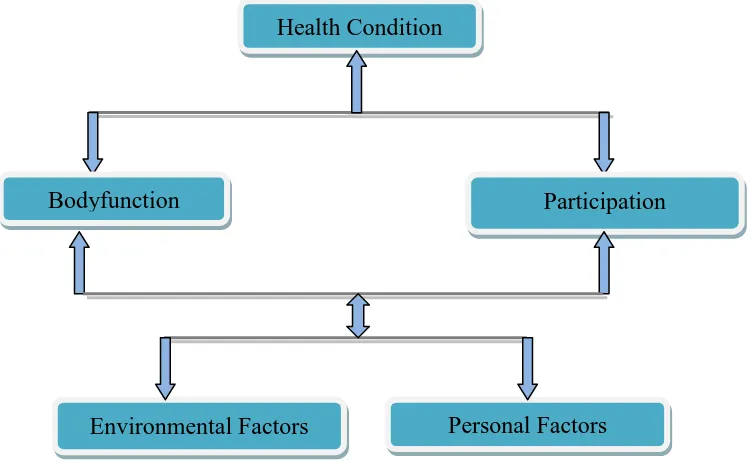
[image:24.595.103.480.465.703.2]aspects of UN convention on the Rights of persons with Disabilities and also other international and country wise policies. The ICF associates functioning and disability with functions and structure of body, activity and participation of people and environmental factors which also play a role in disability (41). ICF does not detach health from disability unlike conventional models. However on careful examination the domains that define health and disability are infact similar and the manifesation is only varied. ICF is the latest and a concept centered model which makes disability universal and understandably simple. It does not rely only on medical aspects of disability but also psychological social, cultural and environmental effects on an individual with disability. It is very different from its fore runner ICIDH (International Classification of Impairment, Disability and Handicap) because in ICIDH disability is largely due to the physical impairment. ICF model is used in disability surveys, censuses, data analysis, development and monitoring of national programmes. (42).
Figure 3.1 Interactions between the components of ICF
Source: ICF,WHO 2001:1.Available from ICF: An overview. Introducing the ICF. Available from http://www.wcpt.org/sites/wcpt.org/files/files/GH-ICF_overview_FINAL_for_WHO.pdf
Health Condition (Disorder/Disease)
Bodyfunction Structure
Participation
12
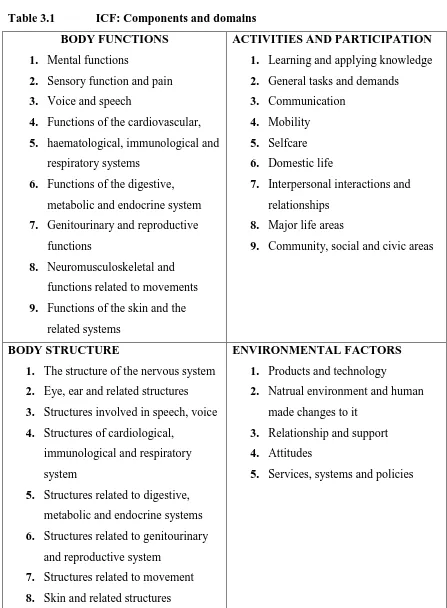
Table 3.1 ICF: Components and domains BODY FUNCTIONS
1. Mental functions
2. Sensory function and pain
3. Voice and speech
4. Functions of the cardiovascular,
5. haematological, immunological and respiratory systems
6. Functions of the digestive, metabolic and endocrine system
7. Genitourinary and reproductive functions
8. Neuromusculoskeletal and functions related to movements
9. Functions of the skin and the related systems
ACTIVITIES AND PARTICIPATION 1. Learning and applying knowledge
2. General tasks and demands
3. Communication
4. Mobility
5. Selfcare
6. Domestic life
7. Interpersonal interactions and relationships
8. Major life areas
9. Community, social and civic areas
BODY STRUCTURE
1. The structure of the nervous system
2. Eye, ear and related structures
3. Structures involved in speech, voice
4. Structures of cardiological, immunological and respiratory system
5. Structures related to digestive, metabolic and endocrine systems
6. Structures related to genitourinary and reproductive system
7. Structures related to movement
8. Skin and related structures
ENVIRONMENTAL FACTORS 1. Products and technology
2. Natrual environment and human made changes to it
3. Relationship and support
4. Attitudes
5. Services, systems and policies
Source: WHO 2001 : 29-30. Available from
13
3.3 MAGNITUDE OF THE PROBLEM
The world health survey conducted among 69 countries showed the prevalence of disability among adults aged 18 years and above to be 15.6%. This corresponds to a total number of more than one billion. The prevalence ranges can be as high as 18.0% in lower income countries and 11.8% in the higher income countries. In all the countries vulnerable groups such as women, poor and the elderly suffer the most from disability (8).
In the survey of the income and program participation done in the United states in 2005 the prevalence of disability was found to be 21.8% (9). In the United Kingdom there are 11 million adults with disability and 770,000 children with disability (45). The 2012 Canadian disability survey reports that 11% adults have either pain, mobility or flexibility disability types and 3.9% of them reported mental disability (10). Among the younger age group mental disability was more common at about 2.2% but 12.7% of the older reported pain as the most common disability. Very severe disability constituted 20.6% of those who were surveyed.
14
disability and 4% speech disability. Greater than two thirds of the elderly had one functional limitation and 22% had atleast one restricted activity of daily living (49). In 2004 a cross sectional study in Karnataka found the prevalence of disability to be 6.3%. Persons with multiple disabilities contributed to 80% of all disabilities (50). In a community based study done in rural parts of Karnataka the prevalence of mental disability was observed to be 2.3% and the prevalence was higher among elderly and illiterate (51). In Kaniyambadi block, Vellore district of Tamilnadu the prevalence of disability was found to be 6.7%(52). In another study done in rural part of Tamilnadu prevalence of disability was found to be 0.85% (53) .The prevalence of disability varies from country to country due to reasons such as different definitions for disability, different methodology and quality of studies (54). In a bibliographic search done by the WHO the prevalence of indicators of impairments was 0.1 - 92% , disability was 3.6 – 66%, handicap 0.6 – 56% and low quality of life 1.8 – 26% (55).
3.4 DISABILITY IN DEVELOPING AND DEVELOPED NATIONS
In developed nations the prevalence of disability appears to be high due to various factors such as excellent medical, elderly care, medical research and rehabilitation services (54). More over they tend to collect data through surveys which provide plentiful data on disability as compared to censuses (56). Types and prevalence of disability in a country also depends upon the pattern of chronic diseases, conflicts, injuries, substance abuse and disasters (57). There is paucity of data on disability in general and more so in the developing and under developed countries (58). Available data is considered to be of poor quality(59). To make matters worse 71% of the people with disabilities comprises of people who have invisible disabilities like learning and cognitive disability (60).
15
disabilies. Abuse is rampant. These violations of human rights happen due to cultural beliefs and attitudes. Therefore the disability picture in developing nations is incomparable with that of the developed nation (61).
In Bangladesh Titumir and Hossain reported in 2005 the prevalence of disability as 5.6% and that the prevalence was less in areas where disability services were adequate (62). Even in developed countries despite functioning programs for the people with disabilites, the earnings of the people with disabilities are not proportional to their normal peers. However, the situation is worse in developing countries. While in developed countries accidents and conflicts are growing concerns of cause of disability, in developing countries infectious disease, maternal, perinatal conditions, injuries and childhood disability, which could be prevented or treated through rehabilitation are the reasons for disability (63).
3.5 MEASURING DISABILITY
The objectives of measuring disability includes, assessing the general health of the population, devising disability benefit policies, measuring needs of the disabled community, studying the impact of disability on employment and impact of disability on quality of life (64).
16
same question during a survey, when asked in a different manner produces different prevalences of disability (65).
Every disability has a different type of medical, social and rehabilitative need to be addressed and it is important that the measurement of disability is done. At first, many people find the term disability to be insulting and may refuse to identify themselves as one. When asked “Do you have disability?” the shame around disability and mental status
of the individual being asked are to be considered. Relevent questions that might be asked are “Do you have limitation in performing a particular activity?”. However, in countries
which depend upon censuses for data on disability, such questions might be practically difficult to administer since censuses are conducted over long periods and done among the entire population (54). It has been studied that simplifying questions on disability will improve the quality of results but its effect on rates of disability is not known. When attempting to measure disability both yes or no questions and five point scale are prone to self-proxy differences and inconsistency (65). There is insufficient data on how the government sample surveys and census data on disability is collected in India. The possible impact on types of disabilities measured also are unknown. Problems specific to India in measuring disability include stigma, accuracy in diagnosing impairments especially in the elderly, overlooking of mild impairments as normal part of life or ageing The census and the National Sample Survey (NSS) have significant differences in their definitions of impairments. This explains their differnce in estimates of disability in the country. The NSS definitions are more exhaustive and tend to produce higher prevalence (66).
3.6 ASSESSMENT OF DISABILITY
17
disaese, to ascertain if the patient requires benefits, to assess the working capacity of a person and social participation of a patient. Disability assessment is not only relevant in clinical settings but also in policy making and programming. It is useful for calculating outcomes, effeciency of a treatment/ intervention and allotment of resources (13).
In India, ssessment of disability is done for several reasons, A physician might be called to the court to testify a person as disabled, for issuing disability certificate and for assessing disability in clinical areas. Disability assessment may be done to issue ccertificates, tax deductions, travel charge concessions, priority in employment, for allocate awards, compensations and admittance into various educational courses. Some Acts in India which provide compensation in occurances of disability are -Work man’s compensation Act, Motor vehicle Act, Employment State Insurance Act, Railways Act, civil aviation Act and quantum damage Act. In India, disability assessment is done for issuing disability certificates, railway concession certificates, employment related certifiates and driving certificates for the people with disabilities (67–69). The social security benefits offered to a person with disability after disability assessment in India include reservation in government services, priority in employment, pension under Employees’s provident funs and Miscelleneous Provisions Act 1952, medical benefits under Employee’s State Insurance Act 1948, benefits mentioned in Workmen’s
18
physically handicapped persons with more than 50% disability and any blindness. They are entitled for a total of Rs. 400 per month (72).
3.61 TOOLS FOR DISABILITY ASSESSMENT 3.611 WHO DAS 2.0
This is a generic tool which can be used for both people with disabilities and people with out disabilities such as any diseased. WHO DAS 2.0 does not only assess disability but also diseases, injuries, psychiatric conditions and dependence on alcohol or drugs. It cannot distinguish between physical and mental disabling conditions.
The tool takes only 5 to 20 minutes to administer. Simple hand scoring of each domains can be done in busy clinical settings. Complex weighted scoring instructions are based on Item Response Theory (IRT). Conceptual relationship between ICF and DAS can be observed. It is also appropriate for different cultures.
The domains covered in WHO DAS 2.0 are, cognition and understanding, movement, personal care, social relationships, household and work/school related activities and community participation (73).
PSYCHOMETRIC PROPERTIES OF WHO DAS 2.0
In assessment of a measurement tool, validity and reliability are two essential components. Validity refers to the level at which the instrument measures what it is expected to measure. Reliability indicates the capacity of the instrument to measure consistently. Internal consistency refers to the ability of the tool to measure the same notion throughout the questionnaire, also referred to as inter-relatedness. Internal consistency is measured by Cronbach’s alpha and the acceptable range is 0.70 – 0.95
(74).
19
powerful tool which provides specific information on item functioning. It is composed of a parametric and a non parametric model which explain the probability of a particular answer to a scale as a function of the individual’s trait. WHO DAS distinguished various levels of disability well. Non parametric IRT analyses done in this study revealed that the WHO DAS 2.0 items and choices distinguished well among various levels of disability and was non partial towards gender (75). In another multi centric study done in Europe among 1119 participants with different chronic conditions, Cronbach's alpha ranged from 0.77 for self care domain and 0.98 for work/school domain. A reasonably high ceiling effect was observed in all domains, particularly in the self care domain (53.6%). The questionnaire correlated moderately with SF- 36. There was a statistically difference observed between working and non working population’s total scores (76).
VALIDITY
When WHO DAS was administered along with other instruments such as London Handicap scale, SF-36, Functional independence measure, WHO QOL 100 and WHO QOL BREF, correlation coefficients for similar domains were highest. For other domains the correlation coefficient was between 0.45 – 0.65
CROSS CULTURAL COMPATABILITY
WHO DAS was developed over 19 countries. Cross cultural applicability study was done by means of qualitative methods and it was concluded that the instrument was applicable universally (77).
TEST RETEST RELIABILITY AND INTERNAL CONSISTENCY
Overall cronbach’s value is very high for WHO DAS 0.98. Test retest reliability had an
20
3.7 GRADING OF DISABILITY
WHO introduced ‘disability classification’ for leprosy in 1960 and revised it in 1970 and 1988. The aim of grading was to assess any setbacks in case finding and to prevent disabilities. Grading was done only for eyes, hands and feet. The grades given were 0,1,2 scores and the corresponing degree of impairment was mentioned. This grading even though generated for leprosy, can be used for non leprosy cases also (78).
3.71 WHO GRADING SYSTEM HANDS AND FEET
Grade 0 - No anaesthesia, no visible deformity or damage
Grade 1- Anaesthesia present, but no visible deformity or damage Grade 2 - Visible deformity or damage present
EYES
Grade 0 - No eye problem due to leprosy; no evidence of visual loss
Grade 1- Eye problems due to leprosy present, but vision not severely affected as a result (vision: 6/60 or better; can count fingers at 6 metres).
Grade 2 - Severe visual impairment (vision worse than 6/60; inability to count fingers at 6 metres); it also includes lagophthalmos, iridocyclitis and corneal opacities (79).
RELIABILITY OF WHO DISABILITY GRADING
21
produced in another setting where inter-tester reliability was measured by means of kappa statistics. A value of 0.89 (95% CI 0.84 - 0.94) was obtained for the maximum grade and for Eye, hand and foot score 0.97 (95% CI 0.96 – 0.98) was obtained. WHO disability grading can be done by both experienced and inexperienced hands (81).
3.8 DISABLING CONDITIONS
The global burden of diseases 2004 report mentions these as leading disabling conditions causing moderate and severe disability - hard of hearing, refractive errors, depression, cataract, unintentional injuries, osteoarthritis, alcohol dependence, asthma, coronary artery disease, psychiatric illnesses and cerebrovascular disease (82). Communicable disease, maternal, perinatal and nutritional causes together causes 43.9%; non communicable diseases 40.9%; trauma 15.1%; cancers 5.1%; psychiatric problems 10.5% and cardiac diseases 9.7% of Disability adjusted life years worldwide (83).
22
pollution, unethical scientific experiments, war and violence (87). In a study done in rural area of Tamilnadu common causes of disability which were identified were congenital 60.7% and accidents 20.7% (53).
3.9 TYPES OF DISABILITY
There are various types of disabilities affecting people at any time in their lives.
According to the ICIDH WHO 1981 the types of disabilities are behavioural disabilities, communication disabilities, disability in performing personal care, locomotor disability, disability in body proportion, disability in dexterity, situational and environmental disability and disability in a particular skill (21). The International Classification of functioning, disability and health (ICF), WHO 2001 brings the numerous types of impairments, disabilities and handicaps under one classification.
Disability has multiple facets and it is related to
1. Body function and structure. Impairment happens at this level
2. Activities – functioning gets affected and limitation of activity happens 3. Involvement in various aspects of life – participation restriction occurs
4. Environmental factors affects all the above factors and acts either as barriers or hindrances
23
3.10 IMPACT OF DISABILITY ON THE INDIVIDUAL
Disability impacts social, economic, political, psychological aspects of a person’s life. There are five phases in adjusting to a particular disability. They include initial shock, understanding of condition, being defensive, recognition of condition and finally adaptation. Our socities push a person with disability to take up the role of minority status. Their social identity is defaced and they are considered as less attractive, less efficient and this affects the individual’s and family’s economic status as well. Significant
24
important since the unemployed lose their social position in the society and sometimes experience what is referred to as social death (91). Higher the level of disability lesser the employment status of the individual. Despite legislations disability level is inversely related to employment and income status (92). Schemes on social security and medical benefits for the people with disabilites are not sufficiently upheld by current programs. Expenditure on social security schemes surpass the income genrerated through non income means for the government (93). In a study done in Karnataka half of the people with disabilities were found to be unemployed (50).
ASSESSMENT OF SOCIOECONOMIC STATUS
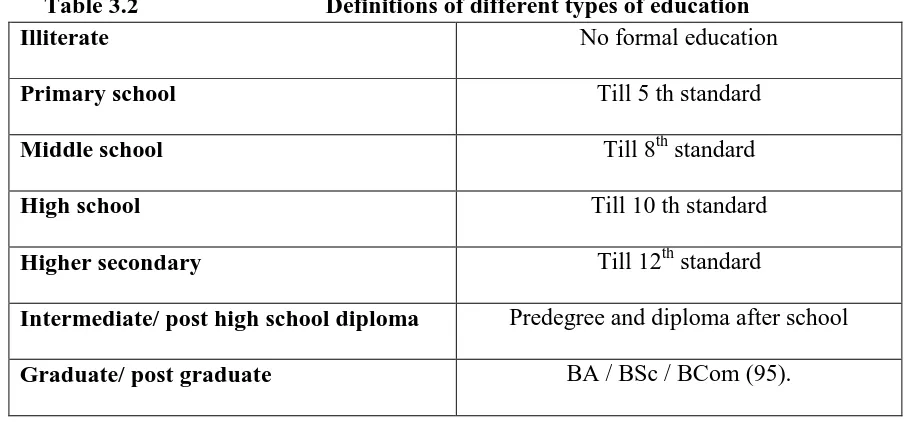
Socio Economic Status (SES) can be assessed using various scales.1) B G Prasad classification – this was developed in 1961 based on per capita monthly family income and number of family members. 2) Pareek classification is used in rural areas. It is constructed upon 9 features, namely, caste, occupation, education, social participation, amount of land owned, house type, farm power, owning of materials and total number of members in family. 3) Modified Kuppusamy’s scale is used in urban settings. Of these Modified Kuppusamy’s scale is widely used to assess the SES (94). Some important
[image:37.595.80.532.547.758.2]definitions in relation to SES are
Table 3.2 Definitions of different types of education Illiterate No formal education
Primary school Till 5 th standard
Middle school Till 8th standard
High school Till 10 th standard
Higher secondary Till 12th standard
Intermediate/ post high school diploma Predegree and diploma after school
25
TYPE OF HOUSE
Hut: A single roomed house made up of kutcha or semipucca materials like mud, bamboo, grass, leaves, reeds, thatch or unburnt bricks.
Kutcha house: Walls and roof of the house will be made of non pucca material like bamboo, mud, grass, leaves, grass, reeds.
Mixed house: Cannot be classified as pucca or kutcha. Mixture of both materials is seen
[image:38.595.85.537.74.523.2]Pucca house: Walls and roof made of pucca materials like cement, concrete, burnt bricks, stone, iron, timber, tiles, corrugated iron asbestos or cement sheet (97).
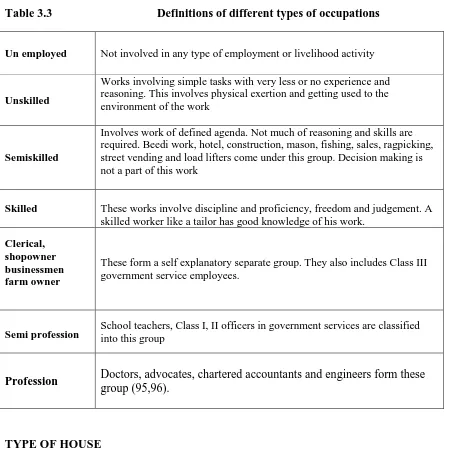
Table 3.3 Definitions of different types of occupations
Un employed Not involved in any type of employment or livelihood activity
Unskilled
Works involving simple tasks with very less or no experience and reasoning. This involves physical exertion and getting used to the environment of the work
Semiskilled
Involves work of defined agenda. Not much of reasoning and skills are required. Beedi work, hotel, construction, mason, fishing, sales, ragpicking, street vending and load lifters come under this group. Decision making is not a part of this work
Skilled These works involve discipline and proficiency, freedom and judgement. A skilled worker like a tailor has good knowledge of his work.
Clerical, shopowner businessmen farm owner
These form a self explanatory separate group. They also includes Class III government service employees.
Semi profession School teachers, Class I, II officers in government services are classified into this group
Profession Doctors, advocates, chartered accountants and engineers form these
26
TYPES OF FAMILIES:
Nuclear: Consists of married couple and their children. They occupy the same dwelling place.
Joint/ exended : A number of married couples and their children live together. All the property is held in common. Senior male member is the head of the household (98).
3.11 IMPACT OF DISABILITY ON SOCIETY
The society has always rejected any deviation from normalcy and disability is no exception. In Neur, an african tribal culture, babies born bigger than normal size were thrown into river. Twins were considered as abnormal and killed at birth (99).
A person with physical disability are often found to have lost their social identity. They were socially less influential, despite being equally or more competant than the non disabled (100).
People with disability are hardly employed in technical, executive and administrative professions. Disabled population profile is so diverse that it is very difficult to define their employment requirements broadly. Due to options of flexibility, the people with disabilities prefer self employment and part time occupations. Inspite of having discrimination acts, discrimination is reported in work places (101). A study conducted in United States in 2000 revealed that disabled people are paid less not because of their impairments or competancy levels but because of prejudice (102).
27
adversely affect the pschological well being of the individual restricting their participation. Disabled children are observed to have reduced self esteem. Such situations favours abuse, since the child is seen as defective(103). There is a dearth of studies on sexual abuse on disabled. Evidence proves that people with disabilities are at increased risk of sexual abuse. The vulnerability of the population exposes them to this social evil (104).
3.12 IMPACT OF DISABILITY ON FAMILIES
Four impacts of disability on children of families with disability mentioned in literature are acquisational, social, emotional and behavioural. In families of parents with mental illness children were obseved to have increased risk of psychiatric illness and psychiatric symptoms.
Much of the stigma associated with disability also affects the children. They are usually the acceptors of stigmatizing remarks and comments from the society. Emotional effects of a disability in the family arises due to caregiver role taken up by the children, maladaptation to the changing family dynamics and multiple responsibilities. Acute illness in the family can bring the family together and improve the security levels, but chronic illness and disability in particular can be emotionally draining (105).
Families of children with disability were observed to be spending twice as compared to that of normal children. At the same time, disabled children report that they receive only a third of what they demanded. Many children are made to believe by their parents that they are as good as other families economically even though their incomes are below national averages. All parents labour to do their best for their children but parents of disabled children are concerned that they are not adequately spending for their children’s
28
spent on essential commodities rather than on amusements such as gifts, holidays and birthdays (106).
3.13 DISABILITY AMONG THE VULNERABLE POPULATIONS
29
women to be non productive is deficiency in self esteem. Most women report not being considered as a human or as a woman due to their disability. Due to humiliation, difficuly in transport and poor communication skills these women are isolated from mainstream society (114).
Relationship between the poor and disability has been well established. Disability and poverty have a two way relationship. Disability is the cause and effect of poverty. People with disability are at a higher risk of disability and those with disability have higher chances of becoming poor. A survey conducted among elderly poor showed that disability and poverty are related. They observed that every marginal increase in log of per capita expenditure will bring down the likelihood of disability by 0.11 (115).
3.14 NUTRITIONAL STATUS OF DISABLED
Its vital that everyone eats right but the disabled need special mention since their nutrition is negatively influenced by their impairments. The reasons being their impairments dimnishing their oppurtunity of purchasing and cooking varieties of foods, their caregivers deciding to cook easy, narrower range of foods, being old and being institutionalized and consuming monotonous food available there. With all these concerns, weight management and adequate nutrition becomes complex issues for a disabled as compared to a normal person (116).
OBESITY AND DISABILITY
30
2.5; 95% CI 2.3 – 2.7) and those lower limb locomotor disability. The Behavioural Risk Factor Surveillance System was conducted in the United States from 1998 to 1999 and the results were analysed by CDC. Of all the people surveyed the disabled were more obese 27.4% (95% CI 25.5-29.3
)
than those who were non disabled 16.5% (95% CI15.9-17.1) (117). For those with physical disability, inactivity and muscular atrophy contributes greatly to obesity and for those with mental disability the inadequate diet, medications and poor eating practices are the reasons for obesity (118,119).
3.15 TOOLS FOR ASSESSMENT OF NUTRITIONAL STATUS IN ADULTS
Conventionally weight, BMI, serum protein and dietery changes were used for nutritional assessment of adults but they provide only a snapshot of the nutritional status. They don’t predict the complications that could rise out of malnutrition. Their values can be distorted in case of serious comorbidities (120).
Validated tools which can be used to assess the nutritional status of adults are 1. Subjective global assessment scale
2. Patient generated subjective global assessment scale (121) 3. Mini nutritional assessment
SUBJECTIVE GLOBAL ASSESSMENT SCALE (SGA)
31
consumption, disease related stress and weight loss (120). SGA mainly concentrates on the effect of disease on nutrition. It correlates with anthropometry values, diet history and protein levels (122). In an Indian study done among cancer patients SGA scores were significantly associated with unfavourable outcomes, increased hospital stay and higher mortality. The odds ratio being 2.89 for association between malnutrition and adverse outcomes (95% CI 1.25-6.67) (123). In a study done to measure the level to which the physician’s SGA scoring was affected by his training, 202 inpatients were assessed.
Multivariate analysis was done and factors which were found to be influenzed by the physician’s teachings were loss of subcutaneous tissue muscle wasting and loss of weight.
A good degree of interobserver agreement was found (kappa = 0.78, 95% CI 0.624 to 0.944, p < 0.001). It was concluded that SGA can be used by clinicians of different classes such as nurses and physicians (124). Its use has been validated among critically ill, dialysis and surgical patients (125–127).
MINI NUTRITIONAL ASSESSMENT (MNA)
32
33
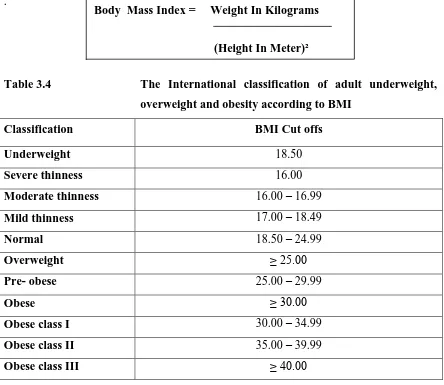
3.16 BODY MASS INDEX
The mini nutritional assessement includes calculation of Body Mass Index for the patients. Body mass index was discovered by Adolphe Quetelet as a relative body weight index. He concluded in his studies on human growth that ‘ weight increases as the square of height’ . It was coined as quetelet index (137).
[image:46.595.86.530.216.601.2].
Table 3.4 The International classification of adult underweight, overweight and obesity according to BMI
Classification BMI Cut offs Underweight 18.50
Severe thinness 16.00
Moderate thinness 16.00 – 16.99
Mild thinness 17.00 – 18.49
Normal 18.50 – 24.99
Overweight ≥ 25.00 Pre- obese 25.00 – 29.99
Obese ≥ 30.00 Obese class I 30.00 – 34.99
Obese class II 35.00 – 39.99
Obese class III ≥ 40.00
B
Source: Adapted from WHO, 1995, WHO, 2000 and WHO 2004. Global database on Body Mass Index. Available from http://apps.who.int/bmi/index.jsp?introPageintro html.
WEIGHT MEASUREMENT IN BEDRIDDEN AND CHAIR BOUND PATIENTS
In community dwelling patients, measurement of weight and height using conventional methods becomes difficult. Deformities due to arthritis, congenital conditions, kyphosis and scoliosis makes it all the more complicated. In a study done among 368 people,
34
significant positive correlation was observed between weight and height, abdominal circumference, arm circumference, calf circumfernece and subscapular skinfold thickness. Weight predicting equation was achieved by multiple linear regression. With only a measuring tape, weight of a bedridden patient can be calculated (138).
HEIGHT MEASUREMENT IN BEDRIDDEN AND CHAIR BOUND PATIENTS
In a study done among 100 young and 63 elderly people significant correlations between height and total arm length and forearm length were found (139). In another study among 65 and above elderly population, high correlation coefficients were obtained for demi arm span ( r = 0.85) (140). In a study done among 17-70 year olds, knee height had a good prediction of height ( men r² = 79%, women r² = 73%) (141). 553 subjects from different ethnic groups were studied to find relation ship between arm-span and height. High correlation coefficient ( r = 0.73 - 0.89 ) was observed between arm-span and height for all ethnic groups (142).
MEASUREMENT OF MID UPPER ARM CIRCUMFERENCE
Mark a point perpendicular to the long axis of the upper arm and measure with a tape around the arm. Tape should not be pulled too tight (143).
Weight in Kilogram = 0.5759 x ( arm circumference in cm) + 0.5263 x ( abdominal
circumference in cm ) + 1.2452 x ( calf circumference in cm) – 4.8689 x ( male = 1/ female =2) – 32.9241
Height measurement in cms from demi arm span for females = (1.35 x demi arm span ) + 60.1
For males = (1.40 x demi arm span ) + 57.8
Height measurement in cms from knee height for females = 84.88 – ( 0.24 x age in years ) + (1.83 x knee height in cms )
35
MEASUREMENT OF CALF CIRCUMFERENCE
1. Expose the calf
2. Let the patient sit comfortably
3. Measure the circumference of the widest part of the calf with measuring tape (144).
MEASUREMENT OF KNEE HEIGHT
1. Make the patient sit comfortably with both legs hanging freely
2. Measure from 4 cm above the front of knee to the lateral malleolus using the lateral malleolus (145).
MEASUREMENT OF DEMI ARM SPAN
1. Ideally measured in standing position
2. Elevate right arm and measure from midpoint of sternal notch to a point between middle and ring finger (145).
MEASUREMENT OF ABDOMINAL CIRCUMFERENCE
In anthropometry the measurement of abdominal circumference is done in the following manner. First, palpate the right iliac crest. Then, draw an imaginary horizontal line at top point of right iliac crest, pointing towards mid axillary line. Place the measuring tape around the abdomen at this level. Measurement is done at minimal respiration (143). In bedridden and chair bound community dwelling patients it is extremely difficult if not impossible to measure height and weight by routine measures.
3.17 CAREGIVING IN DISABILITY
36
face crisis in emotional, social, medical, economical and spiritual aspects of their life (148). Caregiving in the United States Survey 2009 showed that 28.5% of the population take the role of care giving in their lives, the majority of them being females - 66%. Thirty six percent of all the caregivers are people who take care of their parents and 3 in 10 of caregivers expressed stress (149). Fifty percent of caregivers feel that their health is affected negatively by caregiving (150). A study done in Casa among family members of intellectually disabled children showed that family situations become problematic when a child has psychiatric problems. In this study the mothers of intellectually disabled children identified poor endevour, inadequate support from partners and level of difficulty as factors causing stress (151). Caring opportunity may occur at any point of life and when it happens, it affects the carer’s social, economic and physical aspects of life. Some concerns which agonise carer’s lives are urinary and defecation problems in the care recepient, loss of sexual relationship, financial constraints, inadequate sleep and risk of suicide by the recepient. Carers often feel neglected, isolated, depressed and upset with the society. They cope better if the patient is their loved one (10).
A study done in the United Kingdom among caregivers of stroke patients showed that patients and caregiver’s anxiety are determinants of caregiver burden. Training the caregiver was found to be effective on caregiver burden which was independent of other factors. The level of disability, age, gender and societal support were not found to be associated with caregiver burden (152). In Canada 54% of the caregivers are females (153). Female caregivers report more depression and burden. They also feel that their wellbeing and health is reduced (154).
37
being unhealthy physically and among those who took care of patients with psychiatric complications of stroke (11).
3.18 PATIENT REPORTED OUTCOME MEASURES (PROS)
The aim of ideal health care should be to provide patient centered successful treatment (155). Incorporating the patients’s viewpoint on treatment and symptoms is vital for any quality care. In the 1980s PROs were introduced as patient’s viewpoints on treatment outcomes. Patient reported outcome measures are outcome measures which are from the patient’s perspective. They give a better understanding of how patients perceive the
quality of health care, symptoms, effect of treatment on their everyday lives and how the disease impacts their quality of life. These measures are being increasingly used in trials, clinical care and quality assessments (156).
The different types of instruments available are, disease specific, generic, utility specific, population specific, individualized, summary items and dimension specific (157,158). Patient reported oucome measures which measure the functional impairment and disabilities are of keen interest to the physicians. Health related quality of life scales measures symptoms and reduction in activity. Quality of life scales are of primary interest to patients (159).
DISEASE SPECIFIC MEASURES
38
for being restrictive in focus, neglecting important outcomes such as social support, adjustment, etc (160).
GENERIC MEASURES
It can be used in any population with any disease. Multiple domains of health can be studied. In many instances of measurement of health interventions generic measures have been used.
Most of them are constructed around the definition of health put forward by the WHO. There is a general criticism that generic measures construe the domains of health in a narrow manner. Most of them focus mainly on physical functioning and health rather than coping and adaptability (161). Commonly used Generic measures are:
1. Ferrens and powers Quality of Life Index 2. WHO QOL-BREF
3. Euro QOL instrument (EQ5D) 4. Short Form health survey (SF36)
FERRENS AND POWERS QUALITY OF LIFE INDEX
39
satisfaction has been studied as a measure of convergent validity. Ferrens and Powers quality of life index has generic and disease specific versions (163).
THE36 ITEM SHORT FORM SURVEY (SF-36)
40
administer with adequate internal consistency (Cronbach’s alpha>0.7). Scores for self
care and mental health were significantly varied from those devoid of disabilities. SF- 36 unlike other scales avoids ceiling effect and measures all concepts of functionality except social functioning (167).
EUROQOL (EQ-5D)
The effect of disease and treatment on the quality of life is measured using Quality adjusted life years (QALYs). Utility scores are used to represent a person’s choice for a particular health level. Utility is a measure used in health economics to summarize quality of life in cost- utility analysis, which is a very common economic evaluation. It ranges from zero to one. Zero is equivalent to death and one is equivalent to perfect health. The scores enable a description of 245 different types of health states (168). EQ-5D consists of two parts - a descriptive system and a visual analogue scale with worst and best visualized health in top and bottom. The scores range from -0.594 to 1.The EQ-5D was first developed for adults but now a new children’s version for 8-18 year olds (EQ-5D-Y) has been developed. EQ-5D covers 5 dimensions namely movement, self care, routine activities, pain and anxiety. Each of the above dimensions is approached through three levels - no, minimal and extreme problem. EQ-5D is one of the most frequently used questionnaires to assess health-related quality of life. It covers holistic aspects of health as well as physical, mental and social functions (169).
QUALITY OF LIFE
The concept of Quality of life has been around since 1940 and it continues to interest health care workers. It started when two researchers in 1940 coined the term “performance status” of cancer patients. Another scale created by Zubrod et al in 1950
41
construed as quality of life. Authors have considered quality of life as individual and personal, concerned with value rather than medical or knowledge approach (170). Presently it is a term which is widely used by physicians, sociologists, economists, statisticians, anthropologists, philosophers and the common man.What defines Quality of life is a broad question.
More and more robust studies on quality of life are being published. It is used to describe a myriad of concepts such as well being, functioning, social adjustments, satisfaction and happiness. Since there can never be one standard definition of quality of life, it has been limited now to health related quality of life for the use of clinicians (171).
In Britain, in-depth interviews conducted among 999 elderly identified certain themes for quality of life and they are decent social bonds, available help, dwelling in house and not institutionalised, feeling secure, good transport facilities, involving in relaxing activities, position in the society and healthy life (172).
QUALITY OF LIFE OF MENTALLY DISABLED
In an in-depth interview conducted among 12 mentally handicapped individuals it was identified that they were profoundly displeased with their public life, independence and chance to develop skills at their homes (173). Mentally disabled individuals are generally satisfied with services provided but they express that services tend to infuse a sense of dependency on them. Contrary to traditional beliefs the intellectually disabled are aware of the stigma and hatred the society has meted out to them. Despite these fragments of abounding information of versions of quality of life of the mentally disabled, it is very complicated and time consuming to develop a quality of life questionnaire for the mentally disabled (174).
42
stigma, hatred and false belief expressed by the others. The general population do not recognize that it is the illness which is causing the person to behave in a particular way. This results in a mentally ill person being deprived of prospects that characterize good quality of life such as employment, health and good relations. The general public considers people with mental illness to be responsible for their own illness (175).
Contextual issues around quality of life of intellectually dis