A RANDOMIZED CONTROLLED TRIAL COMPARING THE EFFECT OF
FORTIFICATION OF HUMAN MILK WITH AN INFANT FORMULA
POWDER WITH UNFORTIFIED HUMAN MILK ON THE GROWTH OF
VERY LOW BIRTH WEIGHT BABIES
DOCTORATE IN MEDICINE (NEONATOLOGY)
OF
DR. VIJAY GUPTA
DEPARTMENT OF NEONATOLOGY
CHRISTIAN MEDICAL COLLEGE
1
Certification
This is to certify that the dissertation entitled “
A RANDOMIZED
CONTROLLED TRIAL COMPARING THE EFFECT OF FORTIFICATION
OF HUMAN MILK WITH AN INFANT FORMULA POWDER WITH
UNFORTIFIED HUMAN MILK ON THE GROWTH OF VERY LOW
BIRTH WEIGHT BABIES.
” is a bonafide work done by
VIJAY GUPTA
in the Department of Neonatology, Christian Medical College,
Vellore, in partial fulfilment of the Tamil Nadu Dr. M.G.R. Medical
University rules and regulations for award of Doctorate in
Medicine (branch XI) Neonatology under my guidance and
supervision during the academic year 2012-2015.
Dr. Niranjan Thomas Guide
Professor & Head
2
Certification
This is to certify that the dissertation entitled “
A RANDOMIZED
CONTROLLED TRIAL COMPARING THE EFFECT OF FORTIFICATION
OF HUMAN MILK WITH AN INFANT FORMULA POWDER WITH
UNFORTIFIED HUMAN MILK ON THE GROWTH OF VERY LOW
BIRTH WEIGHT BABIES.”
is a bonafide work done by
VIJAY GUPTA
in the Department of Neonatology, Christian Medical College,
Vellore, in partial fulfilment of the Tamil Nadu Dr. M.G.R. Medical
University rules and regulations for award of Doctorate in
Medicine (branch XI) Neonatology under my guidance and
supervision during the academic year 2012-2015.
Dr. Niranjan Thomas Professor & Head
3
Certification
This is to certify that the dissertation entitled “
A RANDOMIZED
CONTROLLED TRIAL COMPARING THE EFFECT OF FORTIFICATION
OF HUMAN MILK WITH AN INFANT FORMULA POWDER WITH
UNFORTIFIED HUMAN MILK ON THE GROWTH OF VERY LOW
BIRTH WEIGHT BABIES.”
is a bonafide work done by
VIJAY GUPTA
in the Department of Neonatology, Christian Medical College,
Vellore, in partial fulfilment of the Tamil Nadu Dr. M.G.R. Medical
University rules and regulations for award of Doctorate in
Medicine (branch XI) Neonatology under my guidance and
supervision during the academic year 2012-2015.
Dr. Alfred job Deniel Principal
4
Certification
This is to certify that the dissertation entitled
“A RANDOMIZED
CONTROLLED TRIAL COMPARING THE EFFECT OF FORTIFICATION
OF HUMAN MILK WITH AN INFANT FORMULA POWDER WITH
UNFORTIFIED HUMAN MILK ON THE GROWTH OF VERY LOW
BIRTH WEIGHT BABIES.”
is a bonafide work done by me in the
Department of Neonatology, Christian Medical College, Vellore, in
partial fulfilment of the Tamil Nadu Dr. M.G.R. Medical University
rules and regulations for award of Doctorate in Medicine (branch
XI) Neonatology during the academic year 2012-2015.
12
ACKNOWLEDGEMENT
First of all, I am grateful to Almighty God for enabling me to complete my
postgraduate thesis with utmost honesty and sincerity.
I thank all the parents of preterm babies who extended their support to my
work and lent their valuable time listening to me regarding my study. I am
grateful for the trust and faith the parents had in me permitting their
precious ones to be included in our study
I wish to express my sincere thanks to Dr Niranjan Thomas, Professor and
Head of the Department of Neonatology, who guided and supervised my
study. He always helped me with brilliant ideas and solutions to problems
which we came across during the study. I am grateful and indebted to him
for his constant encouragement and support throughout the study.
My sincere thanks to Dr Anil Kuruvilla, Professor, Department of
Neonatology for his constant help and guidance throughout the study
I place on record, my sincere gratitude to Dr Sridhar Santhanam Professor,
Department of Neonatology, for his constant help, support and
encouragement.
I thank Dr Manish Kumar, Associate Professor, Department of Neonatology
for his guidance and valuable opinion which helped me in pacing out my
work and to finish it in time.
I thank all the doctors in our neonatal unit especially Dr Nelby, Dr Shabeer,
Dr Abirami, Dr Benjamin, Dr Sumitha, Dr Annie, Dr Mintoo and all
postgraduates from child health who helped me in my thesis with timely
13
I thank Ms Sumithra and Ms Indu, Intensive Care technicians, who helped me
in collecting innumerable blood gas samples required for the study
I thank Indira, our social worker, Hima our occupational therapist, nursing
staff of the department of Neonatology who helped me selecting the study
cases, translating the information into tamil for the parents and in obtaining
parental consent after explaining in detail to parents in their respective
mother tongues which would have been impossible task for me.
I thank Mr G Selvakumar, secretary Dept. of Neonatology for all time expert
opinions and for solving problems as if they did not exist.
I express my thanks to Mr George for providing all the support and
assistance at various moments during my course.
I thank Ms Grace, my biostatistician who solved the number game for my
thesis and transformed them into meaning full results
I thank my parents whose constant prayers and blessings always guided me,
my wife Prabha for constant support and encouragement, my kids Vaishnavi
and Shaurya for ameliorating my tiredness with their smiles, my elder sister
Alka who inspired me time and again to fight against the tough situations
and to win over them.
I would like to express my appreciation to all my family members for their
constant support, unceasing encouragement and prayers throughout.
14
CONTENTS
SL.NO.
TITLE
PAGE
NO.
1.
ABBREVIATIONS
15
2.
INTRODUCTION
17
3.
AIMS AND OBJECTIVES
20
4
REVIEW OF LITERATURE
21
5.
MATERIAL AND METHODS
46
6.
RESULTS
52
7.
DISCUSSION
72
8.
SUMMARY
90
9.
CONCLUSION
92
10.
STRENGTHS OF STUDY
93
11.
LIMITATIONS OF STUDY
95
12.
BIBLIOGRAPHY
96
13.
APPENDIX
116
(I) ENGLISH INFORMATION SHEET AND CONSENT
FORM
(II) TAMIL INFORMATION SHEET AND CONSENT
FORM
(III) TELUGU INFORMATION SHEET AND CONSENT
FORM
15
Abbreviations
AAP American academy of pediatrics AEDF Absent end diastolic flow
AFI Amniotic fluid index
AGA Appropriate for gestational age BUN Blood urea nitrogen
CDC Centers for Disease Control and prevention CI Confidence Interval
CLD Chronic lung disease CRP C reactive protein EBM Expressed breast milk
ELBW Extremely low birth weight babies
ESPHAGN European Society of Paediatric Gastroenterology, Hepatology and Nutrition Committee on Nutrition
GER Gastro oesophageal reflux HMF Human milk fortifier
16
MIR Mid infra red
NEC Necrotising enterocolitis NICU Neonatal intensive care units NNT Numbers needed to treat OEP Osteopenia of prematurity
PDI Psychomotor Developmental Index PHM Preterm human milk
PVL Periventricular leucomalacia REDF Reverse end diastolic flow ROP Retinopathy of prematurity SD Standard deviation
17
INTRODUCTION
Human milk is considered the best source of nutrition for preterm newborn babies,
due to several nutritional and immunologic advantages (1-9). Exclusive feeding
with human milk has been shown to reduce morbidity and mortality related to
neonatal sepsis and necrotising enterocolitis (10–15). Postnatal growth retardation is
a serious and major concern in growing preterm very low birth babies, especially in
low-mid income countries like India (16).
Growth failure in preterm very low birth weight (VLBW) babies has been attributed
due to protein deficiency rather than energy deficit (17–19). There is physiologic
decline in concentration of protein, sodium, zinc and other micronutrients
throughout lactation. This physiologic decline in milk concentration of protein and
micronutrients precedes any reduction in recommended daily requirements for
preterm infants, leading to inadequate nutrient supply and finally growth failure
(20).
Postnatal Growth failure has been shown to increase the risk of poor
neurodevelopmental outcome at 18 months of age by Ehrenkrantz et al (21). Also,
post natal weight gain was found to be better correlated with long term neurological
outcomes as compared to appropriateness of weight for gestational age in study
18 VLBW premature babies exclusively fed unfortified human milk during
hospitalization fail to show growth rates comparable to intra uterine growth rates
due to inadequate protein and minerals in expressed human milk for growing
premature babies (22-25). VLBW babies usually needs higher calories, protein and
minerals to achieve adequate catch up growth (26) and to achieve this, fortification
of human milk has been recommended as the standard of care (1).
Fortification of human milk to feed preterm babies is still a challenging task in
developing countries like India. Much of the fortifiers used in the developed
countries are not available in India. The only available human milk fortifier in India
is Lactodex HMF. Another HMF “HIJAM” manufactured by “Endocura pharma pvt
limited” has come recently into the market after this study was completed. There are
however still several limitations with the use of lactodex HMF. This includes added
daily cost (80 – 100 Rs /day, Rs 15 for each 2 gm sachet (27), lack of Iron and
unavailaibility in smaller cities and towns (27-29). The other problem of using a 2
gm sachet is the difficulty to quantify the exact amount of HMF powder to be
mixed with milk, for example if a mother expresses a limited quantity of milk (< 50
ml at a time ) or if the infant is fed lower volumes. There are not many studies with
HMF use in India. One study from Chandigarh (30) showed significantly improved
weight gain pattern, linear growth and head circumference growth in the fortified
19 Unlike HMF, infant milk powder is freely available and is a cheaper alternative.
The addition of infant milk formula powder to human milk (2g for each 50ml) will
increase the protein content to 2.0- 2.9g/100ml of preterm human milk assuming
variable protein concentration of preterm human milk ranging between 1.5- 2.4
g/100ml (20). In view of significant limitations of the available HMF and some
reports in literature of use of term or preterm infant milk powder for human milk
fortification (29, 31) we tested the hypothesis that fortifying human milk with infant
20
AIM AND OBJECTIVES
AIM: To study the effect of human milk fortification with an infant formula as
compared to unfortified human milk on the growth and biochemical parameters of
preterm VLBW babies
a. Primary Objective:
To evaluate if fortifying expressed breast milk with formula milk powder improves
weight gain in preterm VLBW babies when compared to use of unfortified human
milk
b. Secondary Objective:
The secondary objectives were, difference between the two groups in terms of:
1. Linear growth - rate of length gain in cm/week
2. Head circumference- gain in cm/wk
3. Blood urea nitrogen, serum albumin and Pre albumin levels
4. Co-morbidities like feed intolerance, sepsis and NEC
21
REVIEW OF LITERATURE
Epidemiology: Preterm population, India and worldwide
Globally 15 million babies are born premature each year, of which India accounts
for nearly 23.6% of all preterm birth (32). Among all the live births 13% are born
premature in India (32) as compared to 11.7% in the United states (2011) (33).
More than 75% of these babies, who are born premature can be saved with feasible
and cost effective interventions like antenatal steroids, essential new born care,
breast feeding and Kangaroo mother care and rationale use of antibiotics to treat
new born infections (34). In India, VLBW babies constitute nearly 4-7% of all live
births and VLBW preterm babies account for nearly 30% of early neonatal deaths
(35).
Postnatal growth failure
Following the birth and initial cardio respiratory stabilization of premature VLBW
infant, nutrition plays a pivotal role in ensuring intact survival. Nutrition comprises
of Total parentral nutrition (TPN) and Minimal eneteral nutrition (MEN) during the
stages of early cardio respiratory instability followed by enteral nutrition using
22 Postnatal growth retardation is a major concern in growing preterm very low birth
babies in high income countries (36) as well as in low- mid income countries like
India (16). Human milk is considered the best source of nutrition for preterm
newborn babies due to its several nutritional and immunologic advantages (1-9).
However VLBW premature babies exclusively fed unfortified human milk during
hospitalization fail to show growth rates comparable to intra uterine growth rates
(22-25).
Atkinson et al (22) showed that VLBW babies fed their own mothers milk do not
have adequate calcium and phosphorus intake, though the retention of sodium and
potassium in first two weeks of life is comparable with intrauterine standards.
Tönz et al tried feeding preterm babies with higher protein concentration (2.5 g/dl)
milk mixture (FM 85 , 85 Kcal /100ml) along with supplementation of calcium and
phosphorus to attain growth rates comparable to intrauterine standards which was
difficult with exclusive human milk feeding in view of inadequate protein
concentration and other nutrients (23).
Cooper et al demonstrated better growth rate in preterm VLBW babies when fed
preterm formula (containing 2.4 g/dl of protein; 4.1 g/dl of fat; 8.8 g/dl of
23 electrolytes as compared to breast milk) as compared to breast milk (weight gain;
27.7 g/day vs.17.2 g/day; p < 0.001). Head circumference growth, skin thickness
fold was better in the preterm formula group as compared to expressed breast Milk
(EBM) The time to reach weight of 1.8 kg was significantly shorter in the preterm
formula group as compared to the EBM group (27 days vs 39 days ; p < 0.001)
(24) .
This growth failure associated with un-supplemented human milk has been
attributed mainly due to protein deficiency rather than total calories (17–19). With
increasing duration of lactation there has been physiologic decline in the
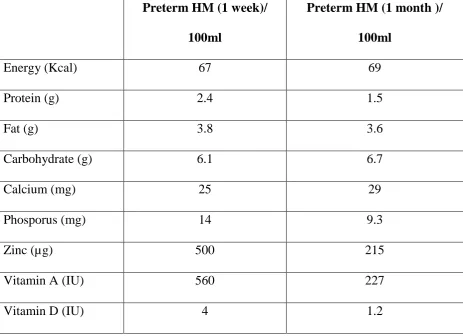
concentration of proteins and other nutrients (Table 1, Figure 1) like sodium and
24
TABLE 1: Comparison of preterm human milk on day 7 and
day 28 of lactation (20).
Preterm HM (1 week)/
100ml
Preterm HM (1 month )/
100ml
Energy (Kcal) 67 69
Protein (g) 2.4 1.5
Fat (g) 3.8 3.6
Carbohydrate (g) 6.1 6.7
Calcium (mg) 25 29
Phosporus (mg) 14 9.3
Zinc (µg) 500 215
Vitamin A (IU) 560 227
25
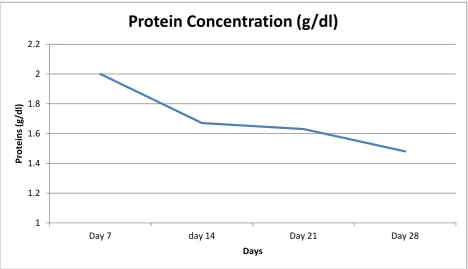
Figure 1: Protein concentration of Preterm human milk at
different stages of lactation (37)
Impact of growth failure on long term outcomes:
Inadequate nutrient supply (mainly protein) because of this physiological decline of
protein and micronutrients in human milk results in post natal growth failure (20).
Improved post natal weight gain correlates with better long term neurological
outcome (19) and postnatal growth failure has been shown to increase the risk of
poor neuro-developmental outcome at 18 months of age (21). 1
1.2 1.4 1.6 1.8 2 2.2
Day 7 day 14 Day 21 Day 28
Pr
o
te
in
s
(g/d
l)
Days
26 Latal – hajnal et al demonstrated improved Psychomotor Developmental Index; PDI
(mean + SD) in SGA (89.9 +17.4 vs 101.8 +14.5; P<.001) and improved PDI (81.9
vs 95.1; P<.001) and Mental Developmental Index; MDI (94.9 vs 101.7, P=.05) in
AGA babies who achieved adequate catch up growth (> 10 centtile) at 2 years of
age as compared to infants with catch down growth (< 10 centile at 2 years age).The
incidence of severe cerebral palsy also increased significantly in infants who do not
achieve adequate catch up growth as compared to infants who achieve adequate
catch up growth at 2 years (22.9% vs 1.2%; P=.008) (19)
Ehrenkranz et al showed significantly decreasing incidence of cerebral palsy,
abnormal neurological examination , MDI and PDI scores < 70 at 18 – 22 months
corrected age among ELBW cohorts with better weight gain pattern ranging from
12 g/kg/day (quartile 1) to 21.2 g/kg/day (quartile 4). Cerebral palsy at 18 – 22
months was diagnosed 8 times more in 1st quartile cohort as compared to the 4th quartile. Similarly the PDI < 70 and MDI < 70 was almost twice as common in 1st quartile as compared to 4th quartile at 18 – 22 months corrected age. (21)
Poor linear growth and Poor neurodevelopment outcome has been closely linked, as
illustrated by Ramel et al (38) where lower standardized Z-scores for length at 4
and 12 months chronological age was significantly associated with lower cognitive
function score at 2 years of life. Studies (39-40) showing that improved linear and
27 nutrition in early part of life had positive impact on later (18 months)
neurocognitive outcome.
Stephens et al(40) demonstrated 4.6 and 8.2 point increase in MDI at 18 months
corrected age with every increase in 10 Kcal energy intake and added 1g/kg protein
intake in first week of life respectively. Hence very low birth weight babies
(VLBW) usually needs higher calories, protein and minerals to achieve adequate
catch up growth and optimal development. (26)
NUTRITIONAL REQUIREMENT OF PRETERM BABY
Neonatal period represents the critical phase of brain growth especially in babies
born premature and who are deprived of adequate parental and enteral nutrition for
many reason related to cardio-respiratory instability and gut immaturity in early
neonatal period. Nutritional deficits in the early and late neonatal period may lead to
postnatal growth restriction (36, 41) and may have long term effect on the growth
and neuro-developmental outcome (19, 21, 38, 42).
Though both protein and energy are important components required for optimal
28 formulas. Too low or too high protein energy ratio may lead to excess fat deposition
in the adipose tissue and leading to long term morbidity (43).
Protein requirements of 3 – 4.4 g/kg/day with protein energy ratio of 2.6 – 3.4 have
been advocated (43, 44). The more premature the baby the higher the daily protein
requirements and hence the protein energy ratio (44).
Appropriate nutritional requirement is based on the assumption of supporting the
growth velocity comparable to intrauterine growth rates (weight gain > 15g/kg/day).
Adequate protein supplementation is necessary to support growth, body
composition and positive nitrogen balance (43).
Protein requirement are higher at lower gestational age (increased growth velocity)
and gradually decreases with increase in gestational age (lower growth velocity) and
corresponding weight (43).
Protein plays a important role in optimal neurodevelopment as it may be required
for normal process of neurogenesis, dentritic arborization, synaptogenesis,
myelination and cell signaling via growth factors and neurotransmitters (45). Hence
inadequate protein intake is a limiting factor for growth (46) and neurocognitive
29 Increased intake of eneteral protein has a positive effect on weight gain pattern,
linear growth and head circumference growth but no effect on subcutaneous tissue
as measured by triceps skin fold thickness (43). Previously there were concerns that
increased protein administration may result in metabolic acidosis, increased blood
urea nitrogen levels, poor growth, and poorer neuro-developmental outcomes (48).
However, safety with improved outcomes has been shown with the use of higher
protein intake of the current new formulations and products (40, 43, 49-51).
Similarly kashyap et al (52) reported protein overload and higher blood urea
nitrogen levels with protein intakes of 4.3g/kg/day and Protein / Energy (P/E) ratio
of 3.6/100kcal. More recently Cooke et al demonstrated the safety with same P/E
ratio with absolute mean protein intakes of 4.6 g/kg/day (53).
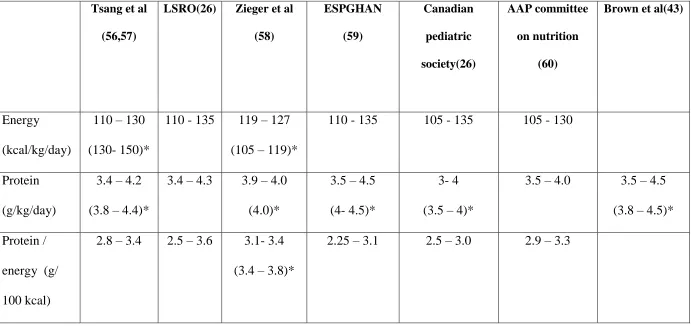
Presently, for optimal growth of preterm VLBW babies higher protein intake (range
3.5 – 4.5 g/kg/day) with adequate calories maintaining normal Protein / energy ratio
is recommended (Table 2). Providing carbohydrate as source of non protein calories
rather than fat improves protein accretion in enterally fed preterm VLBW babies as
it reduces the oxidation of proteins (54). Hence when total calories are kept
constant, nutritional formula which provides carbohydrate/ fat ratio of 2:1 improves
30
Table 2: Nutritional Recommendations for preterm VLBW babies
Tsang et al
(56,57)
LSRO(26) Zieger et al
(58) ESPGHAN (59) Canadian pediatric society(26) AAP committee on nutrition (60)
Brown et al(43)
Energy
(kcal/kg/day)
110 – 130
(130- 150)*
110 - 135 119 – 127
(105 – 119)*
110 - 135 105 - 135 105 - 130
Protein
(g/kg/day)
3.4 – 4.2
(3.8 – 4.4)*
3.4 – 4.3 3.9 – 4.0
(4.0)*
3.5 – 4.5
(4- 4.5)*
3- 4
(3.5 – 4)*
3.5 – 4.0 3.5 – 4.5
(3.8 – 4.5)*
Protein /
energy (g/
100 kcal)
2.8 – 3.4 2.5 – 3.6 3.1- 3.4
(3.4 – 3.8)*
2.25 – 3.1 2.5 – 3.0 2.9 – 3.3
31 Kashyap et al (52) demonstrated improved weight gain pattern, linear growth and
head circumference growth with minimal effect on triceps skin fold thickness by
increasing the protein intake from 2.24 g/kg/day to 3.6 g/kg/day, keeping the energy
intake constant (115 kcal /kg/day). On the other hand, only the weight gain and
triceps skin fold thickness increased with no or minimal effect on linear growth and
head circumference growth by increasing the energy intakes from 115 kcal/g/day to
149 kcal /kg/day keeping protein intake almost constant (3.5 – 3.6g/kg/day). Hence
excess protein administration relative to energy is catabolised rather than supporting
lean body mass growth. Similarly excess calorie intake relative to protein results in
building up of fat in adipose tissue (43) and does not contribute to linear growth.
Fortification options
There are several milk fortifiers available in the western market which when added
to preterm human milk act to bridge the nutritional gap and aim to provide
recommended enteral nutrition for the preterm VLBW babies. In several studies the
use of HMF was found to be safe with improved growth and nutritional parameters
in preterm VLBW babies as compared to administration of unfortified human milk
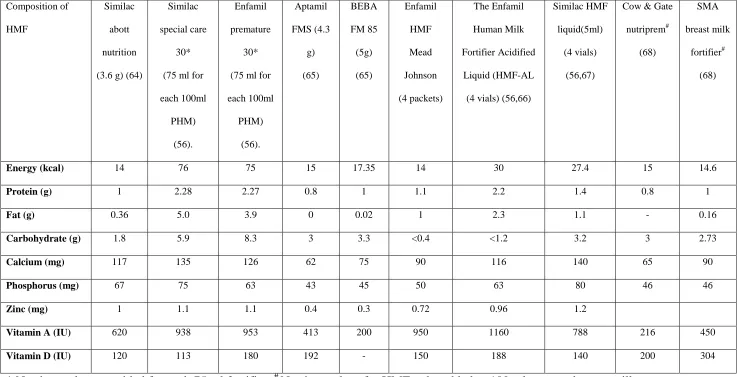
(61-63). Below is the detailed list of several fortifiers available with their nutrient
32
Table 3: Nutritional composition of various human milk fortifiers(47).
Composition of
HMF
Similac
abott
nutrition
(3.6 g) (64)
Similac
special care
30*
(75 ml for
each 100ml PHM) (56). Enfamil premature 30*
(75 ml for
each 100ml PHM) (56). Aptamil FMS (4.3 g) (65) BEBA FM 85 (5g) (65) Enfamil HMF Mead Johnson (4 packets) The Enfamil Human Milk Fortifier Acidified Liquid (HMF-AL
(4 vials)(56,66)
Similac HMF
liquid(5ml)
(4 vials)
(56,67)
Cow & Gate
nutriprem# (68) SMA breast milk fortifier# (68)
Energy (kcal) 14 76 75 15 17.35 14 30 27.4 15 14.6
Protein (g) 1 2.28 2.27 0.8 1 1.1 2.2 1.4 0.8 1
Fat (g) 0.36 5.0 3.9 0 0.02 1 2.3 1.1 - 0.16
Carbohydrate (g) 1.8 5.9 8.3 3 3.3 <0.4 <1.2 3.2 3 2.73
Calcium (mg) 117 135 126 62 75 90 116 140 65 90
Phosphorus (mg) 67 75 63 43 45 50 63 80 46 46
Zinc (mg) 1 1.1 1.1 0.4 0.3 0.72 0.96 1.2
Vitamin A (IU) 620 938 953 413 200 950 1160 788 216 450
Vitamin D (IU) 120 113 180 192 - 150 188 140 200 304
33
GOALS OF FORTIFICATION
The idea of fortifying human milk comes from the prevalence of wide spread
postnatal growth failure in preterm very low birth weight babies (16,36). Though
human milk is ideal for infant nutrition, (1-9) it has been observed that babies fed
exclusively human milk grow slower as compared to babies fed on preterm formula
feeds (69,70). As described above this has been attributed to declining nutritional
contents of preterm human milk with increasing duration of lactation (20). So, to
retain the nutritional and immunological advantages associated with feeding of
breast milk and to optimise growth, preterm human milk is fortified to achieve
target nutrient composition which may support post natal growth comparable to
intrauterine growth standards (> 15 g/kg/day) (56). The various fortifying agents
to achieve the same have been elaborated in table 3.
Individual macronutrient (protein, fat, carbohydrate etc) can also be added alone to
human milk or to already fortified human milk as and when the need arises to
achieve the optimal nutrient intake as per recommendations. They can also be used
as a part of individualized fortification, where there is need to add a specific nutrient
depending on the analyzed milk content or metabolic response of the baby.
Available supplements like Similac liquid protein (1g/ 6ml)(56), Aptamil Protein+
powder 0.82 g protein/1g (65), beneprotein powder 0.86g protein/ g(64),
Microlipid, safflower oil fat emulsion (0.5 g fat /ml) and Polycose polymer powder
34 achieve the target nutritional composition of preterm human milk ( 4.4 g/100 ml of
fat, 8.8g/ 100 ml of carbohydrate and 3g/100 of protein ) as per ESPGHAN
guidelines (when total fluid intake is 150 ml/kg/day) (59,64) Hair et al also
suggested the use of human milk derived cream as an adjunctive supplement to
preterm human milk based diets to improve the linear and weight growth patterns
in preterm VLBW babies(71).
There were some concerns regarding the use of bovine milk derived human milk
fortifiers which gave way to the development of Human milk derived fortifiers
(TABLE 4) for feeding of preterm Infants (56,72,73) Human based fortifiers have
been shown to reduce the risk of NEC as it is free of bovine milk antigen (65).
These fortifiers are available in various additive concentrations so that the treating
physician can choose different HMF preparation to be added to human preterm milk
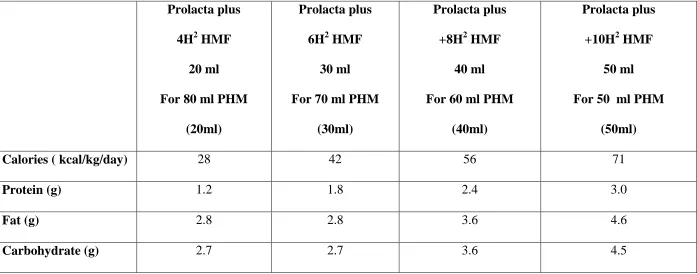
depending on the total daily fluid requirements of the baby (56). The use of human
milk based fortifiers (HMF 60) are associated with remarkable growth velocity
reaching around 24.8 +5.4 g/kg/day (74) as compared to bovine HMF 40, HMF 100
35
Table 4: Exclusive Human milk derived fortifiers (56).
Prolacta plus
4H2 HMF
20 ml
For 80 ml PHM
(20ml)
Prolacta plus
6H2 HMF
30 ml
For 70 ml PHM
(30ml)
Prolacta plus
+8H2 HMF
40 ml
For 60 ml PHM
(40ml)
Prolacta plus
+10H2 HMF
50 ml
For 50 ml PHM
(50ml)
Calories ( kcal/kg/day) 28 42 56 71
Protein (g) 1.2 1.8 2.4 3.0
Fat (g) 2.8 2.8 3.6 4.6
36 As concerns for the risk of bacterial contamination with the use of powdered
fortifier and subsequent bacteraemia exist, the Centres for Disease Control and
Prevention (CDC) do not recommend the use of powdered formulas and milk
fortifiers for feeding preterm infants (75,76). Acidified liquid HMF with higher
protein concentration were later introduced to counter the risk of bacterial
contamination associated with powdered supplements and to support the growth as
well (77).
APPROACHES TO FORTIFICATION
There are two different approaches described to fortify preterm human milk:
1. Standard fortification
2. Individualised fortification
a. Targeted fortification/ tailored fortification
b. Adjustable fortification
STANDARD FORTIFICATION
This method of fortification implies addition of fixed dose of fortifier (powder/
liquid) to a fixed quantity of preterm human milk (with presumed assumption of
1.5g/dl of protein concentration in preterm milk produced at 2 weeks of lactation
(13). This method does not take into account the varying caloric and nutrient
37 expression as well as varying composition between different mothers (37,49,78,79).
It is well known that there is gradual decline of protein in the breast milk with
increasing duration of lactation (80).Therefore, the resulting fortified formulation
may have less calories and protein than what is expected, and hence may lead to
growth faltering due to protein and other nutritional deficiency (46,56,81).
Despite growth benefits with use of multi-component fortification (63) the growth
of preterm babies receiving standard multi-nutrient fortification differs
quantitatively and qualitatively from the ideal fetal growth velocity and was much
slower compared to preterm infants who were fed preterm formulas(15,69,70). The
actual protein intakes were found to be significantly lower by 0.5 – 0.8 g/kg/day
than assumed with little or insignificant difference in the energy intake when
standard method of fortification was used (46,47). Therefore individualized
fortification is a recent concept and is considered the best recommended strategy for
fortification of human milk (82).
The problem of protein under nutrition associated with standard fortification can be
38
TARGETED FORTIFICATION:
In this strategy, native preterm human milk is analysed for macronutrient content at
regular intervals using mid infra red (MIR) spectroscopic analyser (49) and
fortified appropriately to reach the desired or target protein concentration (3.5
g/kg/day) (56,83). The concept of targeted fortification was introduced by Polberger
et al showing improved enteral protein intakes resulting in optimal growth,
removing the variability bias of protein concentration in human milk (83).
Fortification done via this method is a 3 step procedure;
1. Analysis of macronutrient composition in native human milk sample
using the MIR(Milkoscan) (49)
2. Addition of routine fortifier powder / liquid to preterm human milk
3. Pre defined additional amounts of macronutrient (Protein, fat and / or
carbohydrate) is / are added (native breast milk nutrient concentration
+ nutrient increment by routine fortification) to achieve the
macronutrient concentration as per recommended guidelines (64).
Hence in targeted fortification, frequent analysis of human milk ( once or twice
weekly) as suggested by Polberger et al. (78,83) and adjustment of its macronutrient
composition as per recommended guidelines avoids under / over nutrition of the
39 reducing the amount of fortifier used significantly and also prevents the risk of feed
intolerance due to increased milk osmolality.
Adjusted fortification:
In this strategy preterm human milk is fortified depending on the metabolic
response of the baby (levels of blood urea nitrogen) to the overall protein intakes
(47). The amount of fortifier (protein) to be added to the preterm human milk
depends on the changes in serial measurements of blood urea nitrogen values, which
are considered as surrogate markers of protein nutriture and a range of 9 -14 mg/dl
is targeted (56,84).
This model of fortification avoids inadequate or excessive protein intake and was
found to be more practical and feasible in units where MIR analyser is not available
(84). It was shown to provide adequate enteral proteins resulting in optimal growth
comparable to intrauterine growth standards (84). This method of fortification has
been promoted and implemented successfully in several Italian NICUs (85).
However the only drawback is that, BUN values do not always correlate with
protein adequacy in the first week of life and may merely reflect renal immaturity of
40
FORTIFICATION OF MILK IN INDIA
Fortification of human milk to feed preterm babies is still a challenging task in
developing countries like India. Much of the fortifiers used in the developed
countries (as mentioned in TABLE 3 and 4) are not widely available in India. The
only available human milk fortifier in India is Lactodex HMF (Raptakos, Brett &
Co. Ltd) and more recently HIJAM (Endocura pharma pvt limited) (88). There are
several limitations with the use of Lactodex HMF in India. It is not easily available
in small towns and cities. Fortification of Human milk with Lactodex HMF cost Rs
80 – 100 per day (assuming consumption of 300 ml milk daily for 1500 g preterm
baby requiring 6 sachets of HMF each costing around 15 Rs for 2g). Iron
supplementation is required along with fortification to meet the daily recommended
intake (27-29). Another practical issue with use of 2g sachet is the difficulty to
quantify the exact amount of powder to be mixed with expressed milk if mother
expresses limited quantity of milk (< 50 ml at a time) or if the infant is fed lower
feeding volumes as there is no measuring unit available to add less than 2gm
powder (eg; 0.5g and 1 g). There is only one study from Chandigarh, India (30)
which has looked at the use of this HMF in preterm population. Mukhopadhyay et
al (30) demonstrated significantly better weight gain (15.1 vs 12.9 g/kg/d, P
<0.001), significantly better linear growth (1.04 vs 0.86 cm/week, P = 0.017 and
significantly better head growth (0.83 vs 0.75cm/week, P<0.001) with fortification
of milk using Lactodex HMF as compared to unfortified EBM in preterm (< 34
41 found to have significantly better weight gain (16g/Kg/d vs 12.9g/kg/d, P = 0.002)
and linear growth (1.09 cm/week vs 0.92 cm/week, P = 0.042) compared to controls
whereas only linear growth (1 cm vs 0.82 cm; p = 0.006) was significantly better
among the AGA groups as compared to controls.
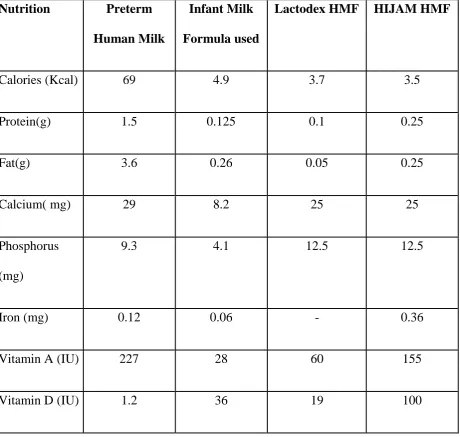
The use of HMF is difficult in developing countries like India due higher cost,
limited availability and the risk of bacterial contamination (89). HIJAM HMF has
been recently introduced in the Indian market but no studies are available on its use.
Its macronutrient composition is much better as compared to Lactodex HMF (88).
(Table 5) Use of HIJAM HMF along with preterm human milk may somewhat
approaches ESPHAGAN guidelines. Additional cost (Rs 12/ 1 g sachet, Rs 120 –
140 /day), higher calcium, phosphorus levels and protein crossing upper end of
normal especially in early periods of lactation when protein concentration is higher
in preterm milk, are its limitation. Many people still do not advocate the routine use
of fortifiers and reserve its use in cases of growth faltering in preterm (< 32 weeks)
42
Table 5: Nutrient composition of Preterm Human Milk and
various fortifying options available in India (20, 27, 88).
Nutrition Preterm
Human Milk
Infant Milk
Formula used
Lactodex HMF HIJAM HMF
Calories (Kcal) 69 4.9 3.7 3.5
Protein(g) 1.5 0.125 0.1 0.25
Fat(g) 3.6 0.26 0.05 0.25
Calcium( mg) 29 8.2 25 25
Phosphorus
(mg)
9.3 4.1 12.5 12.5
Iron (mg) 0.12 0.06 - 0.36
Vitamin A (IU) 227 28 60 155
43
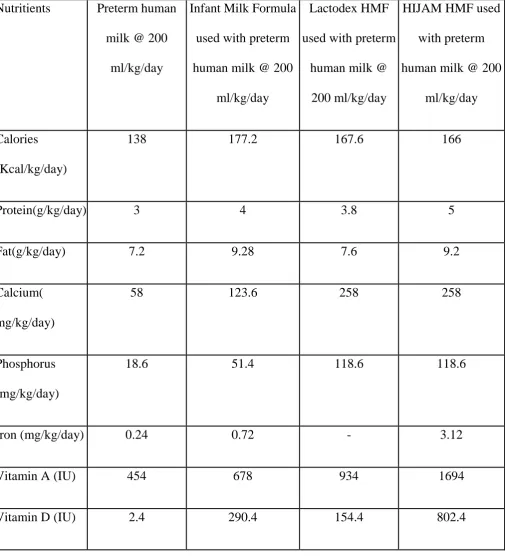
Table 6: Total Nutrients received by the infant using one of the
feeding options
Nutritients Preterm human
milk @ 200
ml/kg/day
Infant Milk Formula
used with preterm
human milk @ 200
ml/kg/day
Lactodex HMF
used with preterm
human milk @
200 ml/kg/day
HIJAM HMF used
with preterm
human milk @ 200
ml/kg/day
Calories
(Kcal/kg/day)
138 177.2 167.6 166
Protein(g/kg/day) 3 4 3.8 5
Fat(g/kg/day) 7.2 9.28 7.6 9.2
Calcium(
mg/kg/day)
58 123.6 258 258
Phosphorus
(mg/kg/day)
18.6 51.4 118.6 118.6
Iron (mg/kg/day) 0.24 0.72 - 3.12
Vitamin A (IU) 454 678 934 1694
44
FORMULA POWDER USED AS HMF:
In places where standard preparations of HMF are not available or its use is limited
because of financial or practical constraints, there are some reports of infant milk
powder being used for the fortification of preterm human milk in the literature (29,
31, 90, 91).
Chowdhary et al. (31) from Delhi, India justified using term infant milk powder for
fortifying preterm human milk in view financial constraints.
Sankar et al (29) from India suggested using preterm infant formula( Dexolac
Special Care [Wockhardt Co.], Pre-Lactogen [Nestle Co) for fortification of human
milk when HMF can’t be used because of unavailability or cost factor.
Khorana et al (90) conducted a pilot study from Thailand comparing the
post-discharge milk powder formula used as a fortifying agent with HMF for preterm
human milk fortification. They did not find any significant differences in terms of
growth parameters, biochemical parameters, duration of stay, morbidities (definite
NEC and osteopenia of prematurity) between the two groups. The use of post
discharge formula for human milk fortification was found to be 19 times cheaper as
45 Zuckerman et al (91) randomised feeding very low birth infants with breast milk
versus breast milk fortified with preterm formula containing high calcium (550 mg)
and phosphorus (300mg) concentration. There was no difference in terms of weight
gain, radiological rickets, serum mineral levels though intake of calcium and
phosphorus was higher in the fortification group as compared to unfortified milk.
RATIONALE FOR DOING THE STUDY
There are concerns with the use of HMF (Lactodex HMF) in India as discussed in
the previous sections. Unlike HMF, infant milk powder is freely available in Indian
market and a cheaper alternative to HMF. The addition of infant milk formula
powder to human milk (2g for each 50ml) achieves a reasonable nutrient
formulation (table 6) for feeding preterm VLBW babies in resource limited settings.
The protein content reaches to 2.0- 2.9g/100ml assuming variable protein
concentration of preterm human milk ranging from 1.5- 2.4 g/100ml (20). The
nutrients like iron, calcium, phosphorus and multivitamins can be added as usual to
make up the nutrients as per target recommendations. There are some reports in
literature on the use of term or preterm infant milk powder for human milk
fortification (29,31)) including a pilot study done from Thailand (90) but there are
no large controlled trials. With this background, we planned a randomized
controlled trial to test the hypothesis that fortifying human milk with infant milk
46
MATERIAL AND METHODS
Design: Prospective, open, parallel group, randomized control trial.
Setting: Tertiary care neonatal unit in south India.
Participants: All babies < 34 weeks and <1500gms born during the study period
(November 2013 to December 2014) were included in the study.
Exclusion criteria: Any baby with major congenital malformation, necrotizing
eneterocolitis stage 2 or stage 3, not reaching full volume feeds by day 21 of life, or
parents not willing to participate were excluded from the study.
Gestation age was calculated based on the last menstrual period / 1st trimester ultrasound dating. In cases of discrepancy gestational age assessment was done
postnatally using the Dubowitz assessment.
The Institution review board and Ethics committee approval was obtained and the
trial was registered at the clinical trials registry (CTRI/2013/11/004149 on
19/11/2013). Parents of babies who fulfilled the inclusion and exclusion criteria
47 Randomization and allocation concealment: The babies were randomized into
two groups (fortified human milk or unfortified human milk) once the babies
reached full feeding volumes (150ml/kg/day) using stratified block randomization
(stratified according to birth weight- < 1250 and 1250 to <1500 g with block size of
2:3). Statistician involved in the study generated the random allocation sequence
and serially numbered opaque sealed envelopes were used to conceal the allocation
Methods: Fortification of human milk was done using an infant milk formula
powder (see table 5 for contents). Each 25 ml of expressed breast milk was fortified
with addition of 1gm infant milk formula powder (Simyl LBW TM, FDC Limited). Final osmolality of fortified milk with infant milk powder was measured using
freezing point depression osmometer (Osmomat 030 Germany) and was
397Miliosmol/kg. Feeds (gavage/paladai) were given every 2-3 hours, graded up to
200 ml/kg as per the nursery protocol. The fortified milk was used within 3 hrs at
room temperature, thereafter it was discarded. To standardize the measuring of milk
powder from the 200 gm tin can, a standardized spoon was used (0.5 g/scoop-spoon
was validated with an error of +/- 0.05g). All babies in both the groups were
supplemented with extra calcium(28 mg/day), phosphate (66mg/day), iron (
6.2mg/day)and multi-vitamin drops (B complex , vitamin C 40 mg, Vitamin E 1.5
mg, vitamin A 1000IU and vitamin D 400 IU) as per current nursery protocols. Data
forms were filled during the study period and were analysed at the end. The control
48 The baseline anthropometric measurements- Weight in grams (using calibrated
electronic weighing scale [Essae DS 852, Essae Teroka Limited India] with error
+/- 5g) ,length in cms (using infantometer) and head circumference (using non
stretchable tape to nearest of 0.1cm) were measured at the time of randomization.
Babies were subsequently weighed daily and length and head circumference
measured weekly until they reached weight of >1800 g. Base line blood urea
nitrogen and blood gas was done on the day of randomization and thereafter once
weekly from the date of randomization until the baby reached 1800 g. Routine
metabolic work up including serum calcium, phosphorus and alkaline phosphatase
levels were done at 4- 6 weeks of chronological age as per the nursery protocol. In
addition, serum albumin and pre albumin were also done at this time. Calcium,
phosphorus, alkaline phosphate and serum albumin were analysed by calorimetric
method using Beckman Coulter AV5800, Ireland. Serum Pre albumin and Urea
were analysed by quantitative immune-turbidimetric assay and urease method
respectively by the Beckman Coulter AV5800 Analyser, Ireland. The laboratory is
National Accreditation Board for Testing and Calibration Laboratories (NABL)
accredited and in addition to internal quality assurance, runs the external quality
assurance from Biorad, RCP, Australia.
Blinding was not possible for the caregivers and the parents because of the nature of
intervention. Measurement of outcome variables (like weight gain, linear growth
49 Data safety and monitoring: To monitor the trial, Data safety monitoring board
(DSMB) committee was instituted to review the data submitted to the committee
every 6 months. As per our ethical committee recommendations, to offset the risk
for the patient, if a baby in control arm failed to achieve a weight gain of at least 10
g/kg/day by the end of 4 weeks from the date of randomisation, fortification of milk
was started. Baby will continue to receive unfortified human milk along with usual
vitamin and mineral supplementations if fortification was withheld withhold for any
reason in the fortification arm. Babies in both groups who broke the protocol were
analysed in the group, they were randomised (intention to treat analysis)
Outcome: The primary outcome measure was weight gain in g/kg/day in the two
groups from the date of randomization until the baby reached 1800 g. The primary
outcome, weight gain /kg/day was the mean of weight gain /kg from the day of
recruitment until the end point (baby reaches > 1800 g). The denominator used each
day for calculating the weight gain was the birth weight or the previous day weight
whichever was higher (92). The secondary outcome measures were linear growth
(length gain in cm/ week calculated as (length on the end point – length on the day
of recruitment) X 7/ no. of days baby was in study ), head circumference increase
(Head circumference gain in cm/ week calculated as (head circumference on the end
point – head circumference on the day of recruitment) X 7/ no. of days baby was in
study), duration of hospital stay and co morbidities like feed intolerance, sepsis and
50 Definitions:
Feed intolerance: presence of vomiting (bilious), abdominal distension and
presence of prefeed gastric aspirate >50% of feed volume (93, 94).
Necrotising eneterocolitis: as per modified bells criteria (95)
Sepsis: newborn with clinical signs and symptoms with elevated CRP or with blood
culture proven sepsis.
Abnormal uterine artery dopplers: S/D ratio > 3 after 30 weeks of gestation (96)
Oligohydramnios: AFI < 5 for oligohydramnios (single deepest pocket SDP <2)
(97)
Metabolic acidosis: ph < 7.25 and serum bicarbonate < 17 meq/l (98)
Anemia requiring packed cell transfusion (99)
Hyponatremia : < 135 meq/l (98),
Hypocalcemia: < 7 mg/dl (100),
Osteopenia of prematurity(OEP); alkaline phosphatise levels >420IU/l and
phosphorus levels <4.5 (101-103,
51
Statistical analysis
Sample size: Target sample size was calculated to be 69 in each group for a power
of 90% with Alpha error of 5% for a 2 tailed test (based on Indian study by
Mukhopadhyay et al (30) showing the difference in the mean weight gain to be 2.2
and std deviation of 4 gm/kg/day in each group (p<0.01). To account for a 20 %
loss to follow up in each arm, a total of 85 babies were recruited in each arm.
Analysis was on an intention to treat basis. Groups were compared by using
student’s t-test for continuous variables and Pearson’s chi-square and Fisher’s exact
52
RESULTS
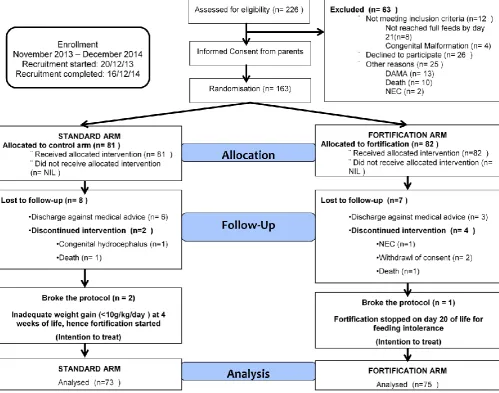
53 Of the 226 eligible babies, 163 babies (81 in standard arm and 82 in fortification
arm) were randomised into the study. A total of 63 babies were excluded prior to
randomisation because they did not meet inclusion criteria or refused informed
consent. Of these, 148 (90.8%) babies (73 in standard arm and 75 in the
Fortification arm) completed the study and were available for analysis (Figure 2).
In the standard arm 8 of the 81 babies were excluded from the study (Figure 2),
leaving 73 for final analysis. Similarly 7 babies in the fortification arm were
excluded from the study after randomisation, leaving 75 for final analysis. One baby
in the fortification arm developed NEC on day 7 of fortification (intervention) and
was excluded from the trial. Two babies, 1 in standard arm and another in
fortification arm died after randomisation due to septic shock and inborn error of
metabolism respectively. There were two babies in the standard arm who were
started on fortification because of inadequate weight gain (<10g/kg/day) by 4
weeks of age and 1 baby in fortification arm where fortification stopped in view of
persistent feed intolerance. All 3 babies were analysed in their respective arm in
54
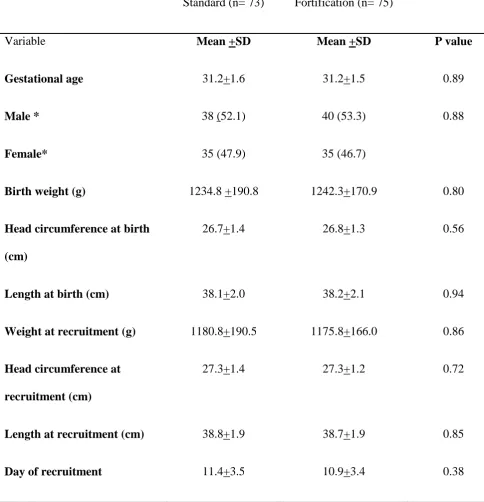
Tables 7: Base line neonatal demographic variables
Standard (n= 73) Fortification (n= 75)
Variable Mean +SD Mean +SD P value
Gestational age 31.2+1.6 31.2+1.5 0.89
Male *
Female*
38 (52.1)
35 (47.9)
40 (53.3)
35 (46.7)
0.88
Birth weight (g) 1234.8 +190.8 1242.3+170.9 0.80
Head circumference at birth
(cm)
26.7+1.4 26.8+1.3 0.56
Length at birth (cm) 38.1+2.0 38.2+2.1 0.94
Weight at recruitment (g) 1180.8+190.5 1175.8+166.0 0.86
Head circumference at
recruitment (cm)
27.3+1.4 27.3+1.2 0.72
Length at recruitment (cm) 38.8+1.9 38.7+1.9 0.85
Day of recruitment 11.4+3.5 10.9+3.4 0.38
55 All baseline neonatal demographic variables were comparable between the two
groups. The mean (+ SD) birth weight in the standard and fortification arm was
1234.8+190.8g and 1242.3+170.9g (p= 0.8) respectively. The mean (+SD)
gestational age in the standard and fortification arm was 31.2 + 1.6 weeks and 31.2
+ 1.5 weeks (p= 0.89) respectively (Table 7). The gender ratio was similar in both
the groups (male; 52.1% vs 53.3 %; p = 0.88). The mean (+ SD) weight at
recruitment in the standard and fortification arm also was not different
(1180.8+190.5g and 1175.8+166.0g p= 0.86). Other baseline demographic
variables, anthropometric variables (length and head circumference) at birth and at
the time of recruitment were similar in both the groups. Mean (+ SD) age at which
the babies were recruited into the trial once the babies were on full volume feeds
was 11.4 + 3.5 days and 10.9 + 3.4 days (p = 0.38) in standard arm and the
56
Tables 8: Base line antenatal maternal characteristics and labour details
Standard (N= 73) Fortification (N= 75)
Variable n(%)/mean +SD n(%)/mean +SD P value
Booked 71(97.3) 73(97.3) 1.00
Primigravida
Multigravida
44(60.3)
29(39.7)
31(41.3)
44(58.7)
0.02
Hypertensive disorders 36(49.3) 38(50.7) 0.87
Gestational diabetes mellitus 2(2.7) 8(10.7) 0.10
Antepartum hemorrahge 4(5.5) 9(12.0) 0.16
Abnormal uterine artery doppler 19(54.3) 22(64.7) 0.65
Absent end diastolic flow / Reverse end diastolic flow
10(43.5) 5(33.3) 0.53
Oligohydramnios 9(22.5) 14(29.2) 0.48
Antepartum steroids 67(94.4) 70(94.6) 1.00
Risk of sepsis 31(42.5) 34(45.3) 0.73
Normal delivery 24(32.9) 16(21.3) 0.11
Apgar score ( 5 min)* 8.8 +1.2 8.6 +1.1 0.30
Apgar score (10min)* 9.59 + 0.7 9.41+ 0.7 0.15
*Values expressed as n(%) or mean + SD and, p value < 0.05 as significant. Abnormal dopplers defined as >
57 Majority of the mothers (97.3%) were booked in both the groups (Table 8). The
number of primigravida mother were found to be significantly more in the standard
arm as compared to the fortification arm (60.3% vs 41.3% ; p = 0.02). However
this may not have any bearing on our primary and secondary outcomes. Maternal
risk factors like hypertensive disorders (49.3% vs 50.7%; p= 0.87), gestational
diabetes mellitus (2.7% vs 10.7 %; p = 0.1) and antepartum haemorrhage (5.5% vs
12%; p = 0.16) were comparable in the standard and the fortification arm
respectively. There were 54.3 % mothers with abnormal uterine artery doppler in
the standard arm as compared to 64.7 % mothers in the fortification arm (p= 0.65).
The incidence of oligohydramnios (AFI < 5cm and SDP < 2cm) were comparable in
both groups (22.5% vs 29.2%; p = 0.48). Nearly 94% mothers in each group
received antenatal steroids. Antenatal risk factors for sepsis in newborn were
comparable in both groups (42.5% vs 45.3%; p = 0.73). Around 32.9% mothers
delivered normally in the standard group as compared to 21.3 % in the fortification
group (p = 0.11) but this was not statistically significant. Apgar scores (Mean + SD)
at 5minutes (8.8 + 1.2 vs 8.6 + 1.1; p = 0.3) and 10 minutes (9.6 + 0.7 vs 9.4 +0.7; p
58 TABLE 9: Base line neonatal morbidity prior to intervention/ randomisation
Standard (N = 73) Fortification ( N= 75)
Variable n(%)/mean +SD n(%)/mean +SD P value
Depression at birth## 18(24.7) 18(24) 0.93
Transient tachypnea 14(19.2) 15(20) 0.90
Hyaline membrane disease 18(24.7) 20(26.7) 0.78
hsPDA 9(12.3) 13(17.3) 0.39
Apnea of prematurity 10(13.7) 7(9.3) 0.41
Air leak syndrome 1(1.4) 4(5.3) 0.37
Feed intolerance 27(37.0) 18(24) 0.09
Metabolic acidosis* 21(28.8) 23(30.7) 0.80
Sepsis 9(12.3) 11(14.7) 0.68
Babies requiring
Respiratory support (CPAP/ High flow/ IMV/HFO)
32(43.8) 35(46.7) 0.73
Packed cell transfusion# 3(4.1) 5(6.7) 0.72
Central lines 61(83.6) 68(90.7) 0.20
Hyponatremia¥ 36(52.2) 36(48.6) 0.67
Hypocalcemia Ψ 8(12.5) 13(19.7) 0.27
Blood urea nitrogen on recruitment day (mg/dl)
8.7+5.8 8.4+5.2 0.7
*Metabolic acidosis: ph < 7.25 and bicarbonate <17 meq/l (98), #Transfusion criteria for anemia (99);
##
depressed at birth: apgar scores < 6 at 5 minutes (104,105) , Hyponatremia¥ : < 135 meq/l (98),
59 The early neonatal morbidities (Table 9) like depression at birth, transient tacypnea
of newborn, hyaline membrane disease, apnea of prematurity, air leak syndrome
and hemodynamically significant patent ductus arteriosus were comparable in both
the arms. There was no difference between the two groups with respect to babies
requiring any form of respiratory support (CPAP, High Flow or mechanical
ventilation), insertion of central lines (umbilical venous catheter or inserted central
venous catheter) or requiring packed cell transfusion for anemia before recruitment
into the study. Though the incidence of sepsis prior to randomisation (probable and
/ or blood culture positive sepsis) was more in the fortification group as compared
to standard group (12.3% vs14.7 %; p = 0.68), this was not statistically significant.
Similarly the incidence of feed intolerance was more in the standards arm as
compared to fortification arm prior to randomisation ( 37% vs 24%; p = 0.09) but it
was statistically not significant. The incidence of metabolic acidosis prior to
randomisation was also comparable between the two groups. There was no
significant difference with respect to incidence of hyponatremia (52.2% vs 48.6% ;
p = 0.67) and hypocalcemia (12.5 % vs 19.7 % ; p = 0.27) between the standard and
fortification groups. The mean + SD blood urea nitrogen levels (8 + 12.5 vs 13 +
19.7; p = 0.27) on the day of randomisation were not different between the two
60 Table: 10 Outcome variables: Anthropometric variables between the two groups
Standard (N= 73) Fortification (N= 75)
Variable Mean +SD Mean +SD P value
Weight gain (g/kg/day) 16.1+2.9 18.03+2.91 <0.001
weight gain (g/ day) 24.2+5.4 27.38+5.69 <0.001
Linear growth (cm/week) 0.96+0.23 1.04 +0.21 0.02
Head circumference growth (cm/
week)
0.9+0.2 0.97+0.19 0.12
Subgroup analysis ( wt < 1250 g) Standard (N=35) Fortification (N= 32)
Weight gain (g/kg/day) 15.7+2.7 17.1+2.5 0.03
Linear growth (cm/week) 0.91+0.18 1.02 +0.13 0.01
Head circumference growth (cm/
week)
0.87+0.15 0.91+0.18 0.31
Subgroup analysis ( wt > 1250 g) Standard (N=38) Fortification (N= 43)
Weight gain (g/kg/day) 16.38+3.1 18.72+3.0 0.001
Linear growth (cm/week) 0.99+0.27 1.06 +0.25 0.23
Head circumference growth (cm/
week)
0.97+0.23 1.02+0.19 0.31
61
Figure 3: Mean daily weight of babies plotted against time in two groups
1150 1250 1350 1450 1550 1650 1750 1850
0 10 20 30 40 50 60 70 80
m
e
an
d
ai
ly
we
ig
h
t
(g)
time in days
62
Primary outcome variable:
The weight gain velocity was significantly better in the fortification group (16.06 +
2.9g/kg/day vs 18.03 + 2.9 g/kg/day; p<0.001) as compared to the standard group
(Table 10 & figure 3). The weight gain velocity remained significantly better in the
fortification arm even on subgroup analysis (weight gain velocity for <1250g:
15.7+2.7g/kg/day vs17.1+2.5; p=0.03 and weight gain velocity for >1250g:
63
Figure 4: Mean weekly length of babies in both the groups
38.5 39 39.5 40 40.5 41 41.5
1 2 3 4 5 6 7 8 9 10
M
e
an
le
n
gth
(
cm
)
time in weeks
64
Figure 5: Mean weekly head circumference of babies in both the groups
27 27.5 28 28.5 29 29.5 30 30.5 31 31.5 32
1 2 3 4 5 6 7 8 9 10
M e an H e ad c ir cu m fer e n ce (c m ) weeks
65
Secondary outcome variable:
The overall linear growth (length gain in cm /week 0.96+0.23 cm vs 1.04+0.21cm;
p=0.016) showed significant improvement in the fortification arm (Table 10 &
figure 4). The linear growth remained significantly better in the fortified arm in the
subgroup analysis for babies with birth weight <1250g (0.91+0.18 vs 1.02 +0.13;
p=0.01) but not for birth weight >1250g (0.99+0.27 vs 1.06 +0.25; p = 0.23). The
head circumference growth in fortification arm (head circumference gain in cm/
week (0.92+0.2 cm vs 0.97+0.2 cm: p= 0.122) though showing an improved trend,
was not statistically significant. The results did not change even on sub group
66 Table 11: Secondary outcomes: Clinical and biochemical parameters between the two
groups
Standard(N = 73) Fortification(N = 75)
n(%)/mean +SD n(%)/mean +SD P value
Sepsis 2(2.7) 6(8.0) 0.28
Feed intolerance 2(2.7) 4(5.3) 0.68
Duration of stay (days) 38.1+13.9 34.75+12.1 0.12
Albumin (g/dl) 2.8+0.4 2.9+0.4 0.68
Prealbumin (g/dl) 10.4+3.7 11.7+4.3 0.05
Hypoalbuminemia < 2 g/dl 1(1.5) 1(1.4) 1.00
Pre albumin< 10 mg/dl 34(50) 33(47.1) 0.74
Calcium (mg/dl) 9.1+0.7 9.1+0.7 0.82
Phosphorus (mg/dl) 6.2 +1.4 6.5+1.5 0.18
Alkaline phosphatase IU/l 371.6 +138.9 333.7+119.4 0.08
Alkaline phosphatase > 420 (IU/l) 51(71.8) 57(79.2) 0.31
Phosphorus <4.5 (mg/dl) 7(9.9) 5(6.9) 0.53
Mean Blood urea nitrogen (mg/dl) 5.4+3.6 5.5+3.7 0.82
Metabolic acidosis 5(6.8) 6(8.0) 0.79
67
Figure 6: Weekly blood urea nitrogen levels (with 95% CI) between the two arm
0 2 4 6 8 10 12
0 1 2 3 4 5
M e an b lo o d u re a n itr o ge n (m g/ d l) wi th 95% CI
time in weeks
68 Looking at the comorbidities, though feed intolerance (2.7% vs 5.3% p = 0.681) and
sepsis (2.7 % vs 8% p = 0.276) were more common in the fortification arm, this was
not statistically significant. There was one case of NEC in the fortification arm which
was excluded from the trial as per the study protocol.
The other secondary outcome variable (table 11) like serum albumin (2.8 + 0.4 g /dl
vs 2.9 + 0.4, p = 0.683) and serum prealbumin (10.4 + 3.7 g/dL vs 11.7 + 4.3g/dl, p =
0.051) though showing an improving trend in the fortification arm were not
statistically significant. The incidence of hypoalbuminemia (serum albumin < 2g/dl)
(1.5% vs 1.4%; p= 1) and number of babies with serum prealbumin < 10g/dl (50% vs
47.1%; p = 0.74) were comparable between the two arms. The mean serum levels of
calcium, phosphorus, alkaline phosphatase (done at 4 – 6 weeks of age) were similar
in the two groups. The number of babies with serum alkaline phosphates > 420 IU /l
and serum phosphorus <4.5 mg/dl were comparable between both the groups. The
incidence of metabolic acidosis (6.8% vs 8%; p = 0.79) between the two groups, was
statistically not significant. The blood urea nitrogen was done weekly to analyse the
nitrogen accretion rates, and was comparable between the two groups with the
exception of the levels done after a week of randomisation which was significantly
higher in the standard arm. This unexpected difference could be because of a single
baby having a high value (19.16 mg/dl) in the standard arm. Otherwise mean blood
urea nitrogen values were higher in the fortification arm as compared to the standard
69 Duration of hospital stay was decreased in the fortification group (38.1 + 13.9 days vs
70 Table 12: Other co-morbidities and biochemical parameters between the two
groups.
Standard(N= 73) Fortification(N= 75)
Variable n(%)/mean+SD n(%)/mean +SD P value
Periventricular leucomalacia£ 5(6.8) 11(14.7) 0.13
Anemia requiring packed cell
transfusionΨ
15(20.5) 9(12.0) 0.16
Chronic lun