PLASMA MYELOPEROXIDASE LEVELS IN TYPE-2
DIABETES MELLITUS
DISSERTATION SUBMITTED FOR
M.D. DEGREE
BIOCHEMISTRY – BRANCH XIII
THE TAMIL NADU DR. M.G.R. MEDICAL UNIVERSITY
PSG INSTITUTE OF MEDICAL SCIENCES AND RESEARCH
COIMBATORE
CERTIFICATE
This is to certify that the dissertation titled “Plasma Myeloperoxidase levels in Type-2 Diabetes Mellitus” submitted by Dr.R.Sujatha is an original work done by her at PSG Institute of Medical Sciences and Research, Coimbatore. This work was done under the guidance of Dr.B.Gayathri, Associate Professor, Department of Biochemistry, PSG Institute of Medical Sciences and Research.
Dr. S. Ramalingam Dr.G.Jeyachandran
Principal Professor and Head
PSG IMSR Department of Biochemistry
PSG IMSR
Place: Coimbatore Dr. B. Gayathri
Date:
Associate ProfessorDECLARATION
I solemnly declare that this dissertation “Plasma myeloperoxidase levels in type-2 diabetes mellitus” was written by me in the Department of Biochemistry, PSG Institute of Medical sciences and Research, Coimbatore, under the guidance of Dr. B. Gayathri, Associate Professor, Department of Biochemistry, PSG Institute of Medical Sciences and Research, Coimbatore.
This dissertation is submitted to the Tamil Nadu Dr. M. G. R Medical University, Chennai in partial fulfilment of the university regulations for the degree of M.D Biochemistry – Branch XIII examinations to be held in April 2015.
Place: Coimbatore
ACKNOWLEDGEMENT
I express my sincere thanks to
Dr.S.Ramalingam
, Principal, PSG
Institute of Medical Sciences and Research for granting me
permission to conduct the study and utilize the facilities needed for
the study.
I express my thanks to
Dr.G.Jeyachandran
, Professor and Head,
Department of Biochemistry for his support and guidance.
I express my heartfelt and sincere gratitude to my guide
Dr.B.Gayathri
, Associate Professor, Department of Biochemistry for
her constant motivation and encouragement throughout my study
period. Without her untiring, enthusiastic support and valuable
suggestions this study would not have been possible.
I wish to thank Professor
Dr.D.Vijaya,
Associate Professor
Dr.R.Sathiamoorthy
for their guidance.
I render my grateful and sincere thanks to
Dr.Senthil Kumar,
Assistant
Professor,
Department
of
Endocrinology
and
Dr. J. Jeyachandran,
Professor and Head, Department of General
Medicine for permitting me to collect the samples.
I express my gratitude to my colleagues
Dr.K.Indhu
and
Dr.J.Sowndharya
for their moral support in my study period.
I express my thanks to technicians and other workers in the
department of Biochemistry, PSG IMS & R, Coimbatore, who have
helped me in my study.
I thank my friend
Dr .M.Hari Hara Sudha
who has been a constant
support to me in all my endeavours.
My acknowledgement would be incomplete without thanking my
parents
Mr.P.RajaRagupathy
,
Dr.R.Subburathinam
and my brother
who are the pillars of my strength.
ABBREVIATIONS
ADA
- American Diabetes Association
AGE
- Advanced Glycation End products
BMI
- Body Mass Index
CETP
- Cholesterol Ester Transfer Protein
CVD
- Cardiovascular Disease
DM
- Diabetes Mellitus
FFA
- Free Fatty Acids
Hb
- Hemoglobin
HbA
1c
- Glycated hemoglobin
HDL
- High Density Lipoprotein
IFG
- Impaired Fasting Glucose
IGT
- Impaired Glucose Tolerance
LDL
- Low Density Lipoprotein
LPL
- Lipoprotein Lipase
MODY
-Maturity Onset Diabetes of the Young
MPO
- Myeloperoxidase
NEFA
- Non-Esterified Fatty Acids
NADH
-Nicotinamide Adenine Dinucleotide Hydrogen
NADPH - Nicotinamide Adenine Dinucleotide phosphate
PAI-1
- Plasminogen Activator Inhibitor-1
PK-C
- Protein Kinase-C
VLDL
- Very Low Density Lipoprotein
TABLE OF CONTENTS
S.No
TITLE
PAGE
1
INTRODUCTION
1
2
AIMS AND OBJECTIVES
3
3
REVIEW OF LITERATURE
4
4
MATERIALS AND METHODS
63
5
STATISTICAL ANALYSIS
78
6
RESULTS
79
7
DISCUSSION
94
8
CONCLUSION
100
9
SUMMARY
102
10
SCOPE FOR FUTURE STUDY
104
11
REFERENCES
INTRODUCTION
Myeloperoxidase (MPO), an enzyme of the heme peroxidase
superfamily in mammals is present within the azurophilic granules of
leukocytes. It plays a major role in innate host defence by participating in
the oxygen dependent killing of invading pathogens. MPO exhibits its
anti-microbicidal property by catalyzing a unique reaction in which
hydrogen peroxide reacts with chloride ions. The product formed by this
reaction is the potent oxidant hypochlorous acid 1. In addition, evidence
shows that increased enzymatic activity of MPO is seen in many chronic
inflammatory conditions. MPO is capable of generating reactive oxygen
species that modify lipids and proteins which contributes to
atherogenesis. Recent studies have shown that low density lipoprotein
(LDL) on exposure to reactive nitrogen and halogen species by MPO gets
converted into more atherogenic forms in the walls of the blood vessel 2.
Also MPO participates in the generation of dysfunctional high density
lipoprotein (HDL) contributing to pro-inflammatory state which triggers
atherosclerosis 3. Apart from this, MPO consumes endothelial derived
nitric oxide, thus reducing its bioavailability and impairing its functions
such as vasodilatation and anti-inflammatory properties. Thus MPO is
mechanism in the process of atherosclerosis. Plasma MPO concentrations
have been found to provide independent prognostic value to predict
adverse outcomes in patient population with coronary artery disease 2.
Diabetes mellitus (DM) is a metabolic disorder, which occupies the
seventh leading cause of death 4. The burden caused by the morbidity and
mortality in patients with type-2 DM is mainly driven by its vascular
manifestations. The underlying pathology of vascular complications is
centrally linked to amplified production of reactive oxygen species,
specifically superoxide radicals and hydrogen peroxide (H2O2).
Superoxide radicals generated from the uncoupling of electron transport
chain is found to oxidize endothelial derived nitric oxide and thus lead to
endothelial dysfunction. H2O2 derived from superoxide is the principal
substrate for leukocyte peroxidases, in particular MPO. DM is associated
with increased risk of premature vascular disease due to accelerated
atherosclerosis. Inflammatory reactions take place in early phase of DM.
Presence of pro-inflammatory state and endothelial dysfunction in DM
are evidenced from previous studies 5.
The rationale of this study is to evaluate the plasma MPO activity
in type-2 DM patients and to study their correlation with lipid profile and
AIMS AND OBJECTIVES Aim:
The aim of the study was to estimate the plasma MPO activity in type-2
DM patients and non-diabetic controls.
Objectives:
1. To compare the plasma MPO levels in 2 groups of subjects namely
non-diabetic controls and type-2 diabetic patients.
2. To study the correlation between plasma MPO activity and lipid
profile in the study groups.
3. To study the correlation between plasma MPO activity and HbA1c
REVIEW OF LITERATURE
Introduction:
Diabetes mellitus is the most common non-communicable disease
worldwide 6. It describes a disorder of metabolism which is multifactorial
in origin and characterised by chronic hyperglycemia. It is associated
with metabolic disturbances related to carbohydrate, protein and fat
which results from reduced insulin secretion or action or both 6.
History of DM:
Diabetes mellitus was first described in the Egyptian population.
The term was first coined by Aertaeus, a Greek physician. The word
diabetes meaning ‘to pass through’ in Greek was first used by Apollonius
of Memphis in 250 BC. The word mellitus, the Latin word for honey was
supplemented by Thomas Willis in 1600 to differentiate this disease from
diabetes insipidus which was also linked with increased frequency of
urination.
The disease was identified by the ancient Indian physicians Charaka and
Susruta who classified it as Madhumeha or honey urine. They described
the differences in the clinical presentation of patients with Madhumeha:
some patients were thin, had severe polyuria, thirst, dehydration and few
` The role for pancreas in diabetes was revealed by Joseph von
Mering and Oskar Minkowski in 1889 who established that when
pancreatectomy was done in dogs they developed all features of diabetes
and died shortly afterwards 8. Although diabetes has been known
since pre-historic times and various effective treatments have been known
in various parts of the world since the middle Ages, an effective treatment
was developed after the Frederick Banting and Charles Best from
Canada first used insulin in 1921 and 1922 7.
Epidemiology of DM worldwide:
DM is the most common endocrine disorder worldwide. Type-2
DM accounts for more than 85% of diabetes cases in the world. In 2010,
it was estimated that about 285 million people have diabetes in the world,
of which 80% live in under developed countries 9. The maximum number
of people with diabetes is 76 million and seen in the Western Pacific
region. The area with highest prevalence rate of 11.7% is in North
America 9.The number of people with diabetes worldwide is expected to
Epidemiology of DM in India:
DM is reaching an exponential rate of epidemic proportions in
India. The level of burden due to diabetes as a disease and its potential
complications are massive. It poses significant healthcare burdens on the
society. More than 62 million Indians are currently diagnosed with the
condition 10. It has been predicted that by 2030 DM may affect up to 79.4
million individuals in our country 11. The increased number of diabetics
in India is mainly due to a significant increase in the incidence of type-2
diabetes, caused by increased migration from rural to urban areas, which
leads to changes in environmental and lifestyle 12.
India recently is exposed to an uncertain future with regard to the
possible burden that diabetes forces upon the society. Many factors affect
the prevalence of the disease in a country and identification of those
factors is necessary to bring about changes in order to face challenges in
the health care system.
Classification of DM:
An international expert committee set certain regulations in June
1997, and put forth new recommendations for the classification and
diagnosis of DM 13. It was recognised that the terms IDDM and NIDDM,
insulin treated Type-2 DM. Hence the terms insulin-dependent DM
(IDDM) and non-insulin-dependent DM (NIDDM) were made out dated.
The classification was revisited by World Health Organisation (WHO) in
2006, but no further modifications were introduced.
The current classification of DM is on the basis of the
pathophysiological process that progress to hyperglycemia. The two main
categories are designated type-1 and type-2. Both types go ahead by a
phase of abnormal phase of glucose equilibrium as the pathological
processes progress. Type-1 DM results from total or near-total absence of
insulin. Type-2 DM is a diverse group of disease characterized by
unpredictable levels of insulin resistance, impairment in insulin secretion
and high glucose production. Various genetic and metabolic irregularities
in insulin action or secretion or both are also found to contribute to the
common characteristic of hyperglycemia observed in Type-2 DM. Type-2
DM is ahead by an episode of abnormal glucose equilibrium state which
is referred to as impaired fasting glucose (IFG) or impaired glucose
tolerance (IGT). These two intermediate conditions were removed from
the formal classification of types of diabetes-but were retained as a risk
Table 3.1: Etiologic Classification of DM
I. Type 1 diabetes ( caused by islet cell destruction which usually
leads to total insulin deficiency)
May be due to either immune-etiology or idiopathic
II. Type-2 diabetes (can vary from insulin resistance to insulin
deficiency which mainly occurs as a result of defect in
secretion)
III. Other specific types:
A. Genetic defects of islet cell function characterized by mutations in:
1. Hepatocyte nuclear transcription factor- 4 (MODY 1)
2. Glucokinase (MODY 2)
3. Hepatocyte nuclear transcription factor -1 (MODY 3)
4. Insulin promoter factor-1 (MODY 4)
5. Hepatocyte nuclear transcription factor -1 (MODY 5)
6. NeuroD1 (MODY 6)
7. DNA of mitochondria
8. Subunits of ATP-sensitive potassium channel
B. Conditions which are caused by genetic defects in insulin action
1. Type A insulin resistance
2. Leprechaunism
3. Rabson-Mendenhall syndrome
4. Lipodystrophy syndromes
C. Diseases of the exocrine pancreas—pancreatitis, pancreatectomy,
neoplasia, cystic fibrosis, hemochromatosis, fibrocalculous
pancreatopathy, mutations in carboxyl ester lipase
D. Endocrinopathies—acromegaly, Cushing's syndrome, glucagonoma,
pheochromocytoma, hyperthyroidism, somatostatinoma, aldosteronoma
E. Drug or chemical induced - glucocorticoids, Vacor (a rodenticide),
pentamidine, nicotinic acid, diazoxide, β-adrenergic agonists, thiazides,
hydantoins, asparaginase, α-interferon, protease inhibitors,
anti-psychotics (atypical and others), epinephrine
F. Infections—congenital rubella, cytomegalovirus, coxsackie virus
G. Uncommon forms of immune-mediated diabetes—"stiff-person"
syndrome, anti-insulin receptor antibodies.
H. Other genetic syndromes sometimes associated with diabetes—
Turner’s syndrome, Friedreich's ataxia, Huntington's chorea,
Laurence-Moon-Biedl syndrome, Myotonic dystrophy, Porphyria, Prader-Willi
syndrome
IV. Gestational diabetes mellitus
Source: Adapted from American Diabetes Association, 2011.
Other types of DM
Other causes for DM consists of specific genetic defects in insulin
secretion or action, metabolic irregularities that damage secretion of
insulin, mitochondrial abnormalities and a whole lot of conditions which
make worse the glucose tolerance which are listed in Table 3.1. Maturity
onset diabetes of the young (MODY) is a sub-division of DM and is
inherited as an autosomal dominant pattern. It is characterised by early
age (<25 years) of onset of hyperglycemia and impaired insulin secretion.
Mutations in insulin receptors are also found to cause a group of atypical
disorders characterized by rigorous insulin resistance which leads to
development of DM.
DM can result from pancreatic exocrine dysfunction where there is
predominant pancreatic islet cell destruction such as in pancreatitis.
also manifest as DM. Viral infections such as cox-sackie virus have a
major concern in pancreatic islet cell destruction but are extremely rare
causes of DM 14.
Gestational Diabetes Mellitus:
Glucose intolerance has also been found to develop during
pregnancy. There is increased predisposition towards insulin resistance,
particularly in the last trimester of pregnancy. The increased requirement
of insulin during pregnancy leads to impairment in glucose tolerance.
Gestational diabetes occurs in approximately 4% of pregnancies. Most
women revert to normal glucose tolerance after delivery. However, they
develop a 30-60% significant risk of developing DM later in life 14.
Impaired Glucose Tolerance (IGT):
IGT is diagnosed in people who have fasting blood glucose
concentrations less than that required for diagnosis of DM, but have a
plasma glucose response during the routine oral glucose tolerance test
between that of a normal and diabetic state. An oral glucose tolerance test
Impaired Fasting Glucose (IFG):
IFG is similar to IGT and is diagnosed by a fasting glucose levels
above normal but below that needed for diagnosis of DM. It is a
metabolic stage between normal glucose homeostasis and DM.
A diagnosis of IFG was defined as the fasting plasma glucose
levels in the range of 100 mg/dL to 125 mg/dL.
The criterion for the diagnosis of IGT is 2-hour values following
the oral glucose tolerance test between 140 mg/dL to 199 mg/dL.
Pre-diabetes refers to a state in which the patients are diagnosed
with IFG or IGT conditions. These conditions designate the
comparatively high threat for potential development of diabetes mellitus.
They are viewed as risk factors for diabetes as well as cardiovascular
disease. The natural history of both the conditions is variable. 25% of
subjects with IFG or IGT can progress to apparent diabetes mellitus over
3-5 years. 50% remain in their intermediate glycemic status and about
25% regress to normal glucose tolerance over this period 15. Pre-diabetic
individuals are at high risk for cardiovascular disease, as a result of the
metabolic abnormalities related to carbohydrate, protein and lipids along
with the existence of known cardiovascular risk factors such as
sub-normal levels of HDL cholesterol, increased levels of triglycerides and
ADA 2010 Criteria for the diagnosis of type-2 diabetes mellitus:
1. Fasting plasma glucose ≥ 126 mg/dL.
Fasting is defined as no caloric intake for at least 8 hours.
OR
2. 2 hour plasma glucose ≥ 200 mg/dL during an oral glucose
tolerance test.
The test should be performed using a glucose load containing
the equivalent of 75 grams anhydrous glucose dissolved in
water, not recommended for routine clinical use.
OR
3. In a patient with classic symptoms of hyperglycemia or
hyperglycemic crisis, a random plasma glucose ≥ 200 mg/dL.
Random is defined as without regard to time since the last meal.
OR
4. HbA1c ≥ 6.5%.
The test should be performed in a laboratory using a method
that is certified by the National Glycohemoglobin
Standardization Program and standardized to the Diabetes
Control and Complications Trial assay.
*In the absence of unequivocal hyperglycemia and acute metabolic
decompensation, these criteria should be confirmed by repeat
Glycated haemoglobin (HbA1c):
Glycated haemoglobin has been well-known as an index of blood
glucose levels over a prolonged phase of time. It is an evaluation of risk
for the evolution of complications in patients with DM.
Chemically, glycation is the addition of a sugar residue to amino
groups of proteins which occurs spontaneously without the need for an
enzyme. Human adult haemoglobin usually consists of HbA, HbA2 and
HbF which comprises of about 97%, 2.5% and 0.5% each of the total
hemoglobin respectively HbA is made up of four polypeptide chains, two
α and two β chains. HbA1c is formed by reaction of glucose with the
N-terminal valine residue of any one of the β-chains of HbA to form an
unstable Schiff base. The Schiff base formation is reversible. This
undergoes Amadori rearrangement to form a stable conjugate referred to
as glycated haemoglobin. This reaction when it occurs between glucose
and other proteins leads to the synthesis of advanced glycation end
products (AGE) which contributes to the micro and macro vascular
complications of DM. Glycation of collagen is found to alter its
biological properties thereby increases cross linking and leads to the
formation of brittle collagen. Adhesion of plasma proteins in the altered
blood vessels leads to accumulation of LDL and consequent
After a broad review of recognized and rising epidemiological
verification, an International Expert Committee, suggested to employ the
HbA1c test to establish a diagnosis of diabetes. The cut-off limit was set
at a level of 6.5%. This test is considered valid if done using method
qualified by the National Glycohemoglobin Standardization Program.
The American Diabetes Association acknowledged this decision. The
traceability of the method should be to the Diabetes Control and
Complications Trial reference assay 18.
Major risk factors for Type-2 DM: Table 3.2: Risk Factors for Type-2 DM
Family history of diabetes ( parent or sibling with Type-2 DM)
Obesity (Body mass index (BMI ≥ 25 kg/m2)
Physical inactivity
Race/ethnicity (African American, Latino, Native American,
Asian American, Pacific Islander)
Previously identified with IFG, IGT or HbA1c of 5.7-6.4%
History of Gestational diabetes or delivery of baby >4 kilograms
Hypertension (blood pressure ≥ 140/90 mmHg)
HDL cholesterol level < 35 mg/dL
Polycystic ovary syndrome or acanthosis nigricans
History of cardio-vascular disease
Source: Adapted from American Diabetes Association, 2011.
Pathogenesis of Type-2 DM:
Type-2 DM is a heterogenous disorder, phenotypically, genotypically
and pathogenetically. The most common form of type-2 DM is found to
be the outcome of a grouping of genetic and acquired factors which
negatively affect beta cell function and sensitivity of tissues to insulin 19.
For some years it was notorious whether impairment of the functions of
beta cell or resistance to insulin action in peripheral tissues was the
underlying fundamental element. The idea that insulin resistance was the
basic defect had been traced back to the classic studies of Himsworth and
Kerr 20. Insulin resistance was found to result from the interplay of
numerous genetic and environmental factors.
Insulin resistance: Insulin resistance is defined as lack of ability of insulin to produce its typical biological functions at effective
circulating levels in normal subjects 21. It is found in non-diabetic
individuals who are obese and in patients with Type-2 DM. It is
usually attributed to defective insulin action. There is a broad
scientific continuum of insulin resistance that varies from
pancreatic islet cells to hyperglycemia in spite of increased doses
of exogenous insulin.
Loss of beta-cell function: The impairment of beta cell function is associated with the insulin resistance mediated increased beta-cell
demand that is required for developing fasting hyperglycemia. The
major defect is loss of secretion of insulin which is induced by
glucose termed selective glucose insensitivity. Excess increase in
blood glucose levels renders the beta cells insensitive to glucose.
The extent of beta cell dysfunction is found to be associated with
both glucose concentration and duration of hyperglycemia. The
normal pulsatile secretion of insulin is also found to be disturbed.
Diabetogenes: Genetic factors also contribute to the development of diabetes. Type-2 diabetes is a polygenic disorder which means
that multiple genetic polymorphisms must be there with or without
acquired abnormalities in order to cause diabetes. Genes that affect
beta cell apoptosis, beta cell regeneration, sensing glucose levels,
ion channels, energy transduction, microtubules or microfilaments,
metabolism of glucose and other islet proteins mandatory for the
synthesis, binding, progress and discharge of secretory granules 22.
Until recently, only a small number of polymorphisms have been
identified as risk factors: One involves amino acid genetic
which is expressed in target tissues of insulin action and beta cells.
Second involves the gene encoding a cysteine protease namely
calpain-10, which modulates insulin release as well as insulin
actions on skeletal muscle and adipose tissue 23. Multiple genetic
influences interact with exogenous factors such as environmental
agents to produce the diabetic state of the individual. However,
despite extensive efforts, the gene or genes causing the frequent
form of Type-2 diabetes remains indefinite.
Environment: Environmental factors ranging from dietary habits to level of physical activity are chief determinants in the
development of Type-2 DM. Obesity is associated with insulin
insensitivity and is the most significant predictive risk factor for
development of Type-2 DM. It is found to be mediated by a variety
of factors released from adipose tissue such as leptin, adiponectin
and many others which adversely affect functions of beta cell. An
inverse relationship exists between the level of physical activity
and the prevalence of Type-2 DM. Exercise is thought to produce
an increased sensitivity to insulin in skeletal muscle and adipose
tissue.
Dyslipidemia in diabetes mellitus:
production under basal and fasting conditions. It also leads to
reduced peripheral uptake of glucose. Insulin suppresses the
production of very low density lipoprotein (VLDL). Resistance to
this action of insulin increases circulating serum triglycerides
levels. Resistance to insulin action in the adipose tissue increases
the discharge of non-esterified fatty acids (NEFA) both to the liver
and skeletal muscle. This impairs the actions of insulin on glucose
metabolism in these tissues. Evidence from previous studies 24
suggested that insulin normally suppresses the production of
VLDL, especially VLDL -1 apo-B particles from the liver. This
effect is brought about by decrease in availability of non-esterified
fatty acids and also a direct effect of insulin on the liver cells where
it inhibits the assembly and synthesis of VLDL particles 25. In
discrepancy to normal subjects, insulin fails to restrain VLDL
apo-B production in those with Type-2 DM, though insulin profoundly
lowers NEFA concentrations. Overproduction of VLDL and the
defective insulin mediated inhibition of VLDL production are
found to be one major causative mechanism for the increase in
serum triglyceride concentrations in patients with insulin resistant
Type-2 DM 26.
HDL levels are reduced in patients with insulin resistance
exchange of cholesteryl esters and triglycerides, between HDL and
other lipoproteins that are rich in triglyceride, by cholesterol ester
transfer protein (CETP) in conditions producing a
hypertriglyceridemic state 27. Finally the HDL particles are
enriched with triglycerides which make them susceptible to the
action of hepatic lipase. This clears HDL particles from the
circulation at an increased rate. Further subnormal activity of
lipoprotein lipase (LPL) leads to further fall in HDL cholesterol
levels still further by decreasing the inter-conversion of HDL-3 to
HDL-2 particles 27.
Elevated concentrations of VLDL particles in diabetic
patients also increase the exchange of cholesterol ester and
triglyceride between VLDL and LDL cholesterol particles
mediated by CETP. This increases the triglyceride content of LDL
particles which makes them more susceptible for the action of
hepatic lipase 28. This enzyme hydrolyses triglycerides present in
the LDL particles thereby increasing their density. This sequence
of events explains why Type-2 DM individuals have smaller and
denser LDL particles than individuals without diabetes 29. The
small dense LDL particles are found to be highly atherogenic and
Metabolic derangements in diabetes: Carbohydrate metabolism in Type-2 DM:
People with Type-2 DM have fasting hyperglycemia and excessive
variations in glucose levels following ingestion of a carbohydrate rich
meal. In these patients insulin secretion is typically reduced and slow
following food ingestion. Defects in insulin secretion are usually
observed early in the evolution of Type-2 DM. In fact, variations in
timing and amount of insulin secreted by the pancreatic beta cells have
been reported in relatives of diabetic patients preceding the development
of hyperglycemia.
Chronic hyperglycemia in combination with elevated free fatty
acid levels impairs insulin secretion. Abnormalities in sensing glucose
levels, processing of insulin or intracellular signalling modify insulin
secretion. In addition, the mass of the pancreatic β-cell decrease with
increase in the duration of diabetes. Alterations in β-cell morphology
occur in most people with Type-2 DM with extensive intra-islet cell
deposition of amylin commonly being observed 31.
Defects in insulin secretion and action are found to contribute to
post-prandial rise in blood glucose levels. A delay in the rise of insulin
results in excessive glycemic variations. Also, a defect in insulin action
leads to sustained hyperglycemia32.
Glucose is an important regulator of its own metabolism. In the
presence of insulin at basal levels, an increase in plasma glucose
concentration stimulates uptake of glucose and suppresses its endogenous
production. This ability of glucose to regulate its own metabolism is
impaired in Type-2 DM. This is referred to as a defect in glucose
effectiveness. The resulting excess increase in glucose is caused by
impairment of glucose induced stimulation of glucose uptake 33.
Inhibition of glucagon secretion lowers both fasting and
post-prandial blood glucose levels. When insulin secretion is intact, failure to
suppress glucagon secretion has only minimal effect on glucose level
regulation. In Type-2 DM in which insulin secretion is decreased and
delayed glucagon causes marked hyperglycemia34.
Amylin is a polypeptide made up of 37 amino acids. It is secreted by the
pancreatic beta cell along with insulin in response to stimuli. Human
studies have shown that plasma levels of amylin and insulin are found to
rise and fall in parallel in both the fasting and fed states 35. It has been
implicated that excessive secretion of amylin may contribute to beta cell
In addition to defective insulin secretion, people with Type-2 DM
frequently reveal defective insulin action. Several studies have shown that
impairment of the suppression of glucose synthesis that is induce by
insulin and stimulation of use of glucose in skeletal muscle and adipose
tissue occurs in Type-2 DM 36, 37. The severity of resistance to insulin
action is influenced by several exogenous factors including exercise,
obesity, diet and also genetic factors. Insulin resistance increases with
increased severity of diabetes and improves by better glycemic control 38.
Defects in the capacity of insulin to regulate glucose metabolism in
muscle and adipose tissue are evident in normoglycemic relatives of
diabetic patients strongly favouring a genetic basis for insulin resistance.
Lipid metabolism in Type-2 DM:
Triglycerides are an important source of energy and storage form
of lipids. They are mobilized as free fatty acids (FFA). Plasma FFA
concentrations represent an equilibrium between their release and
clearance. FFA are taken up and re-esterified in adipose tissue and
hepatic cells. Some get oxidized in muscle (either cardiac or skeletal) and
also in the liver. They are released from intravascular digestion of
lipoproteins like chylomicrons which are rich in triglycerides and
intra-adipocyte lipolysis of triglyceride stores. FFA concentrations are
the post-prandial phase its rate of usage by both adipose and hepatic
tissues also contributes to the FFA concentrations 39.
Hormone-sensitive lipase is the primary regulator in adipose tissue
for the release of FFA. It is extremely sensitive to the hormonal actions of
the principal regulator of lipolysis, which is insulin. Increased insulin
secretion following an increase in glucose concentration after a meal
inhibits lipolysis. This leads to a decreased in plasma FFA concentrations.
It thus enhances insulin-dependent glucose clearance and insulin-induced
suppression of endogenous glucose production 40.
In individuals with diabetes, the ability of insulin to suppress
lipolysis is impaired, probably because of decreased sensitivity of
hormone-sensitive lipase to insulin. The resulting increase in FFA tends
to increase the blood glucose concentrations. Insulin also promotes FFA
disposal by stimulating re-esterification in adipose tissue to form
triglycerides. This is dependent on the availability of
glycerol-3-phosphate derived from insulin induced uptake of glucose and
intra-adipocyte glycolysis.
Circulating plasma triglyceride levels depends on the activity of
LPL to deliver FFA to the adipose tissue. Insulin and glucose
in the muscle. It thus separates triglyceride-derived and
lipoprotein-derived fatty acids away from muscle and into adipose tissue 41.
In Type-2 DM, insulin-induced activation of LPL in adipose tissue
is delayed whereas there is activation of skeletal muscle LPL. FFA
decrease glucose uptake in muscle by inhibiting glucose transport,
glucose phosphorylation and muscle glycogen synthase 42. Elevated FFA
stimulates gluconeogenesis in liver and synthesis of triglycerides. Acute
rise in FFA stimulates insulin secretion whereas chronic rise inhibits
insulin secretion 43. Thus, elevated FFA has been implicated in many of
the metabolic abnormalities associated with Type-2 DM.
Protein metabolism in Type-2 DM:
Protein metabolism at any given time is generally regulated by
substrate availability and the hormonal milieu. Insulin is found to have
profound influence over protein metabolism. People with Type-2 DM
have sufficient left over insulin secretion to limit protein breakdown and
maintain lean body mass. On the other hand, whole body nitrogen flux,
protein synthesis and breakdown are increased in poorly controlled
diabetic patients. Improvement in glycemic control by treatment with
either oral hypoglycemic agents or insulin restores these defects to
Few studies have examined regional protein dynamics in Type-2
DM. 3-methylhistidine excretion, an index of myofibrillar protein
breakdown has been found to be increased in individuals with poor
control of their diabetic status when differentiated from healthy
subjects44. Improvement in glycemic control decreased 3-methylhistidine
excretion. Clotting factors such as tissue plasminogen activator are found
in elevated concentrations in diabetic patients. In addition levels of
plasminogen activator inhibitor-1 (PAI-1) are also increased in these
individuals. This implies that the synthesis of certain proteins by the
hepatocytes and endothelial cells is abnormal. This provides additional
evidence of the increased threat of cardiovascular complications in
diabetic individuals 45.
Complications of DM:
The majority of the burden due to the morbidities associated with type-2
DM is the result of the plethora of complications which ensues the
development of the disease. The most common complications associated
with it are classified as acute and chronic based on their mode of onset.
Acute complications:
1. Diabetic ketoacidosis:
excreted in urine. When rate of synthesis exceeds the ability of
extrahepatic tissues to utilize them, they get accumulated in
blood. The combination of hyperglycemia, glucosuria,
ketonuria, and ketonemia is called diabetic ketoacidosis.
Untreated DM is the most common cause for ketosis.
2. Hyperglycemic Hyperosmolar State:
The primary defects in this condition are a relative state of
insulin deficiency and too little fluid intake. Deficiency state of
insulin increases hepatic glucose production which occurs
endogenously through glycogen breakdown and
gluconeogenesis. It also impairs uptake of glucose in skeletal
muscle. Hyperglycemia induces an osmotic diuretic state which
leads to depletion of the intravascular fluid compartment. This
is further exacerbated by inadequate fluid replacement. The
absence of ketosis in this condition is not completely
understood.
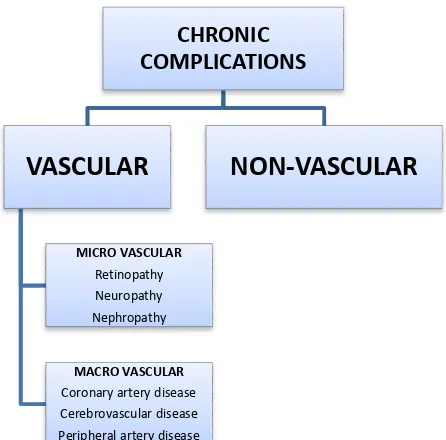
Chronic complications of DM:
The chronic complications of DM are known to affect
various organ systems. They can be divided into vascular and
Table 3.3: Vascular Microvascular
Eye disease
Retinopathy may be non Macular edema
Neuropathy
Sensory and motor Autonomic
Nephropathy
Macrovascular
Cardiovascular disease Peripheral arterial disease Cerebrovascular disease
Others
Gastrointestinal dysfunction such as gastroparesis, diarrhea Genitourinary abnormalities Dermatologic manifestations Infections Cataract Glaucoma Periodontal disease Hearing loss
Source: Harrison’s Principles of Internal Medicine 18 Vascular Complications of DM
Retinopathy may be non-proliferative or proliferative Macular edema
Sensory and motor
Macrovascular
Cardiovascular disease Peripheral arterial disease Cerebrovascular disease
Gastrointestinal dysfunction such as gastroparesis, diarrhea Genitourinary abnormalities
Dermatologic manifestations
Periodontal disease
Harrison’s Principles of Internal Medicine 18th edition. Table 344 CHRONIC COMPLICATIONS VASCULAR MICRO VASCULAR Retinopathy Neuropathy Nephropathy MACRO VASCULAR
Coronary artery disease Cerebrovascular disease Peripheral artery disease
NON-VASCULAR
proliferative or proliferative
Gastrointestinal dysfunction such as gastroparesis, diarrhea
edition. Table 344-7.Page
The risk of chronic complications increases with duration of
hyperglycemia. Since Type-2 DM often is preceded by a long disease free
period without any symptoms of hyperglycemia, many patients present
with complications at the moment of diagnosis.
The micro-vascular complications of Type-2 DM are found to
result from chronic hyperglycemia. Genetic susceptibility also has a
predominant contribution to the pathogenesis of complications in diabetic
patients. The role for chronic hyperglycemia in the development of
macro-vascular complications is not much evident. However, coronary
heart disease events and mortality are two to four times greater in patients
with Type-2 DM. These events are also found to correlate with fasting,
postprandial glucose levels in the blood and also with the HbA1c. Other
factors such as dyslipidemia and hypertension are also found to play
important roles in development of vascular complications in diabetic
patients 46.
Pathogenesis of vascular complications in DM:
Chronic hyperglycemia has been implicated as an important
etiologic factor in the development of diabetic complications. Four
theories were put-forth to explain the mechanisms by which it leads to
hypothesis suggests that hyperglycemia leads to epigenetic changes in the
affected cells.
One theory is that chronic hyperglycemia can progress to the
formation of AGE via the non-enzymatic protein glycation. This results
from the condensation of glucose with amino groups present in proteins.
AGE are found to cross-link extra cellular matrix proteins such as
collagen. These glycated proteins are found to modify the composition
and functions of the extracellular matrix and also exhibit a wide variety of
effects on the vascular system such as decreased synthesis of nitric oxide,
acceleration of atherosclerosis, glomerular dysfunction through
modification of basement membrane proteins.
Second theory suggests that excess glucose that results from insulin
deficiency is channelized into the sorbitol pathway. Normal metabolism
of glucose inside the cells is usually by phosphorylation and subsequent
glycolysis. When glucose levels are increased, it gets converted to
sorbitol by the enzymatic action of aldose reductase. Increased
concentration of sorbitol alters the redox potential, increases the cellular
osmolality and also generates reactive oxygen species which in turn leads
The third hypothesis suggests that increased glucose levels in the blood
increases the production of diacylglycerol. This activates the protein
kinase-C (PK-C) signal transduction pathway. PK-C alters the
transcription of genes for fibronectin, type IV collagen, contractile
proteins and other proteins of the extracellular matrix present in
endothelial cells and neurons.
A fourth presumption proposes that excess blood glucose leads to a
major flux through the hexosamine pathway. This generates
fructose-6-phosphate, a substrate for O-linked glycosylation and production of
proteoglycans. This leads to glycosylation of proteins such as endothelial
nitric oxide synthase or alters functions of certain proteins by regulating
gene expression of transforming growth factor or PAI-1. Increased
production of growth factors by one of the above proposed mechanisms is
Figure 3.1: Pathogenesis of vascular complications in DM
Source - Brownlee M. Pathobiology of diabetic complications. Nature 414: 2001;
813-820.
A possible unifying mechanism that leads to diabetic complications
is that, raised blood glucose levels due to insulin deficiency or insulin
superoxide radicals in the mitochondria. These free radicals were found
to be responsible for the deleterious effects on organ systems 47.
Cardiovascular morbidity in DM:
Diabetic patients are 2 to 4 times more likely to succumb to the
drastic effects heart disease than non-diabetics. More than 70% of
mortality in diabetic patients is attributed to cardiovascular disease
(CVD) 48. DM has been identified as a major risk factor for CVD by The
American Heart Association. Patients with CVD and co-existing DM
have a worse prognosis than that for non-diabetics. Further, multiple
vessel involvement in CVD is more likely in individuals with DM.
The co-existence of hyperglycemia along with other major
cardiovascular risk factors contributes to the increase in cardiovascular
system related morbidity and mortality in diabetic individuals. The other
major risk factors for macro-vascular disease in diabetic individuals
include altered lipid profile, associated systemic hypertension,
overweight and obesity, sedentary lifestyle and smoking habits. Further
certain alterations in biochemical parameters more prevalent in diabetic
patients also pose an additional risk to these individuals. These include
micro and macroalbuminuria, elevation of serum creatinine levels and
well-established risk factor for cardiovascular complications in individuals
with or without DM. These individuals have raised levels of plasminogen
activator inhibitors (especially PAI-1) and fibrinogen which enhances the
coagulation process and impairs fibrinolysis thus favouring development
of thrombus in the vasculature. The underlying mechanism for the
increased cardiovascular morbidity in DM is accelerated atherosclerosis.
The process of atherosclerosis starts from the formation of a fatty streak
that gradually progresses into more advanced plaques. It terminates in
complicated lesions of atherosclerosis, which through rupture and
thrombus formation can lead to acute myocardial infarction.
Atherosclerosis:
It is characterized by lesions in the endothelial intimal layer called
atheromas or atherosclerotic plaques that project into vessel wall lumen.
An atheromatous plaque is a raised lesion made up of a central core of
lipid which is made up of predominantly cholesterol and its esters
covered by a white fibrous cap. Apart from obstructing blood flow by
mechanical means, these plaques rupture and lead to distressing vessel
thrombosis. It can also deteriorate the underlying media thus leading to
formation of aneurysm 49. Hyperlipidemia is one of the most important
risk factor for atherosclerosis. The mechanism by which hyperlipidemia
Stage 1: Formation of foam cells:
Chronic hyperlipidemia, especially increase in cholesterol levels
can directly produce endothelial dysfunction by increasing free radical
production locally. These reactive radicals can cause injury to the tissues
and accelerates decay of nitric oxide thereby reducing its vasodilator
activity.
Lipoproteins accumulate within the intima in hyperlipidemic
conditions. They get oxidized through the action of oxygen free radicals
generated locally by macrophages or endothelial cells. Oxidized LDL is
ingested by macrophages through a scavenger receptor and accumulates
in phagocytes which are further referred to as foam cells. Further,
oxidation of LDL provokes the release of various growth factors,
cytokines and chemokines by endothelial cells and macrophages. This
increases further monocyte recruitment into atherosclerotic lesions.
Finally, oxidized LDL is toxic to endothelial cells and smooth muscle
cells and thus induces dysfunction of the endothelial cell. Accumulation
of this modified LDL within macrophages in various stages of plaque
formation reveals its importance in atherogenesis.
Stage 2: Progression of atherosclerosis: Smooth muscle cells containing lipid droplets are seen in the lesion. The condition is reversible
However when lipid is accumulated, the lesion progresses and the arterial
changes become irreversible.
Stage 3: Fibrous proliferation: There is a definite component of inflammation in atherosclerosis. Dysfunctional endothelial cells in the
major arteries express a variety of adhesion molecules, particularly
vascular cell adhesion molecule-1 which binds to monocytes and T-cells.
These cells adhere to the endothelium; migrate into the intima under the
control of locally produced chemokines. The transformation of
macrophages into monocytes into macrophages leads to engulfment of
lipoproteins, including oxidized LDL. Progressive accumulation of
oxidized LDL promotes lesion development. Macrophage activation
results in cytokine production which further increases adhesion of
leukocyte and chemokine production. It also produces reactive oxygen
species, aggravating LDL oxidation. T-lymphocytes that are recruited to
the intima interact with macrophages and generates a chronic
inflammatory state. However, activated T-cells elaborate inflammatory
cytokines. This process stimulates macrophages, endothelial cells and
Stage 4: Advancing fibrous plaque: This leads to contraction of the blood vessel wall leading to more turbulent blood flow and increased
tendency to clot formation 50.
Table 3.4: Major risk factors in development of atherosclerosis: Modifiable Non-Modifiable
Increased lipid levels in blood Systemic hypertension
Diabetes
Smoking – Tobacco
Advancing age Males
Individuals with family history Genetic defects
Source: Kumar, Abbas, Fausto, et al. Robbins and Cotran Pathologic Basis of
[image:48.595.111.473.394.664.2]Disease, 8th Edition, Chapter 11, Blood Vessels, Richard N Mitchell, Frederick J Schoen, Elsevies- Saunders, Philadelphia, 2010: 497.
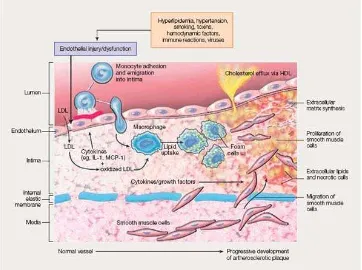
Figure 3.2: Sequence of cellular interactions in atherosclerosis
Source: Kumar, Abbas, Fausto, et al. Robbins and Cotran Pathologic Basis of
Risk factors such as hyperlipidemia cause injury to the endothelial
cells which results in sticking together of platelets and monocytes and
release of growth factors which leads to smooth muscle cell migration
and proliferation like platelet-derived growth factor. Macrophages and
smooth muscle cells transform to foam cells that constitute the
atheromatous plaques. It is derived from macrophages via the VLDL
receptor. In conditions of increased cholesterol levels, the extracellular
lipid is derived from accumulation in the vessel lumen and also from
degenerating foam cells. Accumulation of cholesterol in the plaque
reflects a disparity between the rate of its entry and exit from the
circulation. HDL helps to clear the cholesterol resulting from these
accumulations. Smooth muscle cells migrate to the intimal layer of the
blood vessels, proliferate in it and produce extracellular matrix proteins,
like collagen and proteoglycans 49.
Endothelial dysfunction in diabetes mellitus:
The increased occurrence of cardiovascular disease in diabetic
patients is generally attributed to the unfavourable effects of
hyperglycemia and oxidative stress. It has been revealed that pre-diabetic
conditions, such as IFG and IGT pose an increased risk for development
of cardiovascular disease 16. Atherosclerosis which has been implicated in
dysfunction due to the prevalence of any individual risk sources listed in
Table 3.4.
Vascular endothelial cells are found to play a crucial role in
maintaining cardiovascular environment. In addition to providing a
physical obstacle between vessel wall and lumen, it also secretes
numerous mediators which are found to control aggregation of platelets,
coagulation process and vessel tone. They also produce various mediators
which alternately mediate either vasoconstriction such as endothelin-1
and thromboxane A2 or vasodilatation such as nitric oxide, prostacyclins
and endothelium-derived hyperpolarizing factor. In larger arteries nitric
oxide is the major contributor to endothelium-dependent relaxation,
whereas in the smaller resistance vessels contribution of
endothelium-derived hyperpolarizing factor predominates 51.
Patho-physiology of endothelial dysfunction in Type-2 DM:
The main functions of endothelial cells are altered in Type-2 DM.
There are a number of mechanisms for the commencement of impaired
function of endothelium in type-2 diabetes described including
Hyperglycemia:
Hyperglycemia contributes to endothelial dysfunction in a number
of ways. Decreased activity of pentose phosphate pathway leads to
limited availability of NADPH, a necessary cofactor for endothelial nitric
oxide synthase which can cause reduced production of nitric oxide.
Increased glucose transport across endothelial cell membranes leads to
increased flux through polyol pathway. As a consequence glucose is
reduced to sorbitol by aldose reductase, leading to a further depletion of
NADPH. Sorbitol undergoes oxidation to fructose by sorbitol
dehydrogenase enzyme. This reaction uses NAD+, resulting in
amplification of NADH/NAD+ ratio, thereby leading to modification of
the redox state of the cells. This results in oxidative stress, which
promotes generation of superoxide anions which further quenches nitric
oxide, reducing its bioavailability 52.
Formation of AGE:
Hyperglycemia increases the denovo synthesis of diacylglycerol by
enhancing metabolism of glucose to diacylglycerol precursors through
glycolysis. The diacylglycerol activates an important signal transducer
namely PK-C. This leads to decrease in enzymatic activity of nitric oxide
synthase, especially the endothelial isoform and an increase in the
promotes generation of superoxide anions, which reacts with nitric oxide
to produce peroxy-nitrite (ONOO-) which damages adjacent tissues. The
amplified production of endothelin-1 due to the increase in glucose levels
via activation of the β and δ isoforms of PK-C leads to its increased
concentration in Type-2 DM 54. The PK-C leads to the migration and
proliferation of smooth muscle cells by increasing the production of
growth factors by the endothelium,.
Hyperglycemia produces vascular dysfunction due to the
interaction of AGE with their specific receptors on the endothelium. AGE
quench the nitric oxide and increases the susceptibility of LDL to
oxidation. The AGE and their receptors interact with each other which
lead to a rise in thrombomodulin and activate the receptors for the
numerous cytokines such as interleukin-1, tumour necrosis factor-α and
growth factors leading to the migration and proliferation of smooth
muscle cells. Other cell adhesion molecules are also increased related to
hyperglycemia. This alters the vascular permeability which in turn
favours the transmigration of mononuclear cells and the change of
monocytes to macrophages which finally become foam cells of the
Oxidative stress and diabetes mellitus:
Oxidative stress results from a disproportion between an
augmented generation of oxidant compounds and inadequate anti-oxidant
defence mechanisms which lead ultimately to tissue damage 56.
Generation of oxidant compounds is physiologically relevant as a defence
mechanism against invading microorganisms, cancer cells and also in
tissue healing and remodelling. Dysfunction in the oxidative mechanisms
can contribute to cell injury and death.
Sources of oxidative stress:
The respiratory chain of mitochondria represents the most potent
source of oxidants in the body. These oxidants exert deteriorating effects
contributing to aging of the cells and tissue damage. The phagocytes in
response to a suitable stimuli leads to the production of oxidants based on
the stimulated production of reactive oxygen species via univalent
reduction of oxygen at the molecular level. This leads to the activation of
polymorphonuclear neutrophils, monocyte and macrophages to increase
their oxygen consumption. This phenomenon is referred to as the
respiratory burst.
The NADPH oxidase enzyme system remains attached to cellular
membranes. It reduces molecular oxygen to the highly unstable
transformed into hydrogen peroxide. Both O2
-·and hydrogen peroxide serve as important precursors for the synthesis of potent oxidants.
Superoxide anion reacts with nitric oxide to produce highly reactive
nitrogen species. Hydrogen peroxide, through Fenton’s reaction reacts
with intracellular iron to produce the hydroxyl radical 57. Hydrogen
peroxide oxidises ferrous iron (Fe2+) to ferric form (Fe3+), a hydroxyl
radical along with a hydroxyl anion. This is followed by the reduction of
the ferric form to ferrous, a superoxide radical and a proton by the same
hydrogen peroxide.
(1)Fe2+ (Ferrous) + H2O2 +H+ → Fe3+ (Ferric) + HO•(hydroxyl radical)
+ H2O
(2) Fe3+ H2O2 + → Fe 2+
+ HOO• (Superoxide radical) + H+ (proton)
These reactions have been concerned in degeneration of the lipid cell
membrane, protein aggregation and DNA damage.
Hydrogen peroxide is the substrate for MPO to produce the
chlorinated oxidants. In the presence of chlorine, MPO converts hydrogen
peroxide into hypochlorous acid. This is a powerful compound capable of
inducing the oxidation a number of molecules like lipids, proteoglycans
and other membrane proteins or intracellular constituents, particularly the
thiol group of membrane proteins. In addition, hypochlorous acid reacts
oxygen species are released together with pro-inflammatory cytokines,
which again magnifies further oxidant generation.
Oxidative stress markers and antioxidants:
Oxidants are compounds which are highly reactive. They have a
very short half-life of only a few seconds. Therefore, their estimation
in-vivo is generally not possible. In contrast modification of lipids, proteins,
carbohydrates and nucleic acids, by oxy-radicals, have biological activity
ranging from hours to weeks. Thus they serve as ideal markers of oxidant
[image:55.595.105.531.410.764.2]stress 58.
Table 3.5: Markers of oxidative stress and anti-oxidants:
Oxidative stress markers Anti-oxidants
1. Lipid peroxidation:
Acrolein, Malondialdehyde,
4-hydroxynonenal,
thiobarbituric acid reactive
substances, Advanced lipid
oxidation products, Oxidised
LDL antibodies
2. Protein oxidation:
Advanced protein oxidation
1. Enzymatic
Superoxide dismutase
Catalase
Glutathione peroxidase
2. Non-enzymatic
Glutathione
Vitamin C
Vitamin E
3. Carbohydrate oxidation:
Advanced glycation end
products
4. Nucleic acid oxidation:
8-hydroxy-2’
deoxyguanosine
Albumin
Role of oxidative stress in the pathogenesis of diabetes and diabetic complications:
The mechanisms of free-radical production in diabetes include
glucose auto-oxidation, protein glycation, AGE formation and activation
of polyol pathway. All these pathways ultimately lead to an oxidative
stress in a number of tissues 59. The lack of appropriate compensatory
mechanisms from natural in-vivo antioxidant system produces an
imbalance in the redox state of the cell. This leads to the activation of
intracellular signalling pathways. The increased generation of reactive
oxygen species causes damage of proteins, lipids and nucleic acids.
Further the activation of signalling pathways known to regulate gene
expression also leads to cellular damage 60.
Lipid peroxidation produced by the activity of free radicals play a
with free radicals and undergo peroxidation. This leads to the formation
of lipid peroxides which on decomposition form numerous by-products
including malondialdehyde. This modified lipids after peroxidation
decreases the membrane fluidity which leads to a dysfunction in the
plasma membrane. It also changes the activity of membrane bound
proteins. The lipid peroxidation products are harmful to every cell in the
body and are related with a diversity of diseases including DM.
Inflammation in DM:
Inflammation has been proposed to be important supplementary causal
factors in the progress of Type-2 DM. The central mechanism by which
inflammation and stress are found to mediate insulin resistance is through
the inhibition of insulin receptor signalling pathways.
The cells of the adipose tissue are an important source of storage of lipids
and help in regulation of homeostatic environment for metabolism. It also
regulates the functions of macrophages in inflammation. In obesity, there
is inflammation of adipose tissue. This leads to an infiltration of adipose
tissue by macrophages and as a result of adipocytes produce their own
inflammatory cytokines. This inflammatory response of the adipose tissue
is a vital step in the progression of peripheral insulin resistance.
The numerous pathways of inflammation are found to be initiated
stress which leads to over-production of reactive oxygen species in the
mitochondria. Signals from all of these mediators converge on
inflammatory signalling pathways, which lead to the production of further
mediators of inflammation through regulation of transcription regulation
as well as to the direct inhibition of insulin signalling 61.
Inflammatory cytokines: Interleukin-6:
The pro-inflammatory cytokine interleukin-6 was among the first
to be implicated a as predictor of insulin resistance and cardiovascular
disease. There is an increased circulating level of interleukin-6 in
individuals with Type-2 DM. The production of interleukin-6 by the
abdominal adipose tissue is much higher than that from the subcutaneous
adipose tissue. This points towards the fact that interleukin-6 may be one
of the factors that make central adiposity a high risk factor for the
development of insulin resistance 62.
Interleukin-10:
It is an anti-inflammatory cytokine. The decrease of its synthesis is
found to be associated with the development of Type-2 DM. The immune
cells in the adipose tissue are found to produce this anti-inflammatory
factor. It acts on adipocytes to improve signalling pathways of insulin
Tumour Necrosis Factor-α:
It is a cytokine secreted both by immune cells and adipocytes. It
has been found to play a role in the development of insulin resistance 64.
Resistin:
Resistin is an inflammatory cytokine produced by the cells in the
adipose tissue and immune cells. Its expression is found to be suppressed
by thiazolidinediones and is up-regulated by pro-inflammatory cytokines
and bacterially derived lipopolysaccharide 65. It stimulates intracellular
signalling through NF-kB activation, which in turn promotes the
synthesis of other pro-inflammatory cytokines and surface adhesion
molecules 66.
Monocyte chemoattractant protein-1:
It is a chemoattractant protein. Its main role is to recruit the cells of
the immune system to inflammatory sites. Increased levels of this protein
are implicated in onset of several diseases which are represented by the
infiltration of monocytes such as psoriasis, rheumatoid
C-reactive protein:
It is a major acute phase reactant. It is synthesised mainly in the liver.
Levels of C-reactive protein are increased in conditions of inflammation
and they have been established as a risk marker for cardiovascular risk.
Its levels have been correlated with insulin resistance 68.
Myeloperoxidase (MPO):
Agner described the purification of an intensely green
iron-containing protein from purulent fluid in patients with tuberculous
empyema. It was found to exhibit peroxidase activity. Because of its
green colour, it was termed initially as verdo-peroxidase. As consequent
studies showed that this enzyme expression was restricted to myeloid
lineage cells, it was named MPO (EC.1.11.1.7). Chromosome 17 hosts
the gene that encodes this enzyme on its long arm 17q22-q23 69.
Immediately after translation of the MPO gene, a single 80kDa
protein is produced. This enters the endoplasmic reticulum and undergoes
cleavage of the signal peptide which is made of 41 aminoacids. Further,
N-linked glycosylation occurs which leads to incorporation of mannose
rich side chains. This leads to the formation of 90kDa apo-pro-MPO.
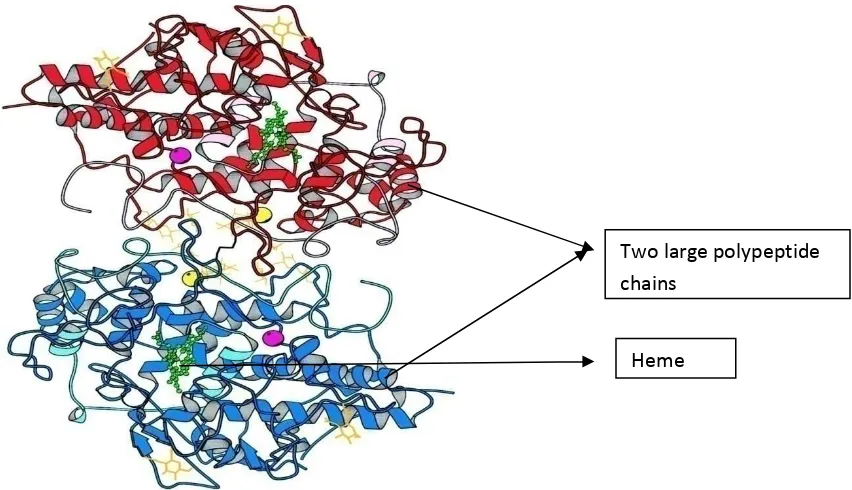
Apo-pro-MPO is enzymatically inactive because it lacks heme. The
This enters the Golgi complex. It undergoes a range of post-translational
proteolytic modifications to produce the full mature protein. The first
proteolytic action cleaves the 125 amino acid pro-peptide to generate a 74
kDa short lived intermediate. Then it undergoes a second cleavage to
form two subunits which consists of a 59 kDa heavy subunit and a 13.5
kDa light subunit. These two subunits are linked by covalent bonds with
the associated heme group. The native form of MPO has heme in the
ferric state. The mature MPO protein is formed by the combination of
two heavy and light p